Kalkine has a fully transformed New Avatar.

Company Overview: St Barbara Limited is a gold producer and explorer. The Company is engaged in mining and the sale of gold, mineral exploration and development. The Company segments include Leonora and Simberi. The Company's Leonora Operations include the Gwalia approximately 1.2 million tons per annum (Mtpa) processing plant and the Gwalia Underground mine. The Company's Simberi mine is on Simberi Island in Papua New Guinea, which includes gold and porphyry copper-gold targets. The Company's Simberi gold resources, reserves and mining operations are located in Mining Lease (ML) 136, which covers eastern half of Simberi Island, and the remainder of the island is covered by Exploration License (EL) 609, which also covers Tatau and Big Tabar Islands. Simberi focuses on epithermal gold in oxide and sulfide deposits. Simberi produced approximately 110,286 ounces of gold. The Company's Big Tabar Island is located approximately 20 kilometers south of Simberi, and over 30 kilometers north of Lihir Island.
.png)
SBM Details
Sep Qtr Gold Production Increased by ~1.6% than Previous Qtr: St Barbara Limited (ASX: SBM) is involved in the mining and sale of gold, mineral exploration and development. The company has three mining operations; Leonora Operations in Western Australia, Simberi Operations in Papua New Guinea and Atlantic Gold Operations in Nova Scotia, Canada. Looking at the performance over FY15 to FY19, total revenue of the company has grown with a compound annual growth rate (CAGR) of 4.7%. The bottom-line grew at a CAGR of 38.1% in the period FY15-FY19. Total revenue improved from $550 Mn in FY15 to $660.4 Mn in FY19, and net profit improved from $39.7 Mn in FY15 to $144.2 Mn in FY19. Net cash held at the end of the financial year was reported at ~$880 Mn, as compared to net cash of ~$226 Mn held in the previous year. The Company’s gross margin, EBITDA margin, net margin, Return on Equity, Return on Invested Capital and current ratio stood better than the industry median in FY19.
The company entered FY20 with a diversified portfolio of gold operations along with a number of near mine prospective targets at each operation, planned to be drilled in FY20. With the positive outlook of gold along with the company’s exploration program in 2020 which aims to focus on deep drilling at Gwalia, exploration in the Greater Gwalia area and in the Leonora region, continued exploration at Pinjin in Western Australia and Back Creek in New South Wales, etc., SBM is likely to generate decent and sustainable return for its shareholders in the coming times.
.png)
FY19 Underlying NPAT Data (Source: Company Reports)
Q1FY20 Key Highlights for the period ended September 30, 2019: Consolidated production for the quarter was reported at 87,569 ounces, as compared to 86,197 ounces in Q4FY19. Production at Gwalia stood at 38,153 ounces of gold for the quarter, with 164 kt of ore milled at an average grade of 7.4 g/t Au (gold). Production at Simberi for the period stood at 27,061 ounces of gold, at an average milled grade of 1.19 g/t Au. Production at recently acquired Atlantic gold stood at 22,355 ounces at an average milled grade of 1.29 g/t Au.
Other important operation details such as production costs, cash flow details, FY20 guidance for Atlantic Gold and an update on following the acquisition of Atlantic Gold, will be released by the company later in October 2019.
.png)
Production Summary (Source: Thomson Reuters)
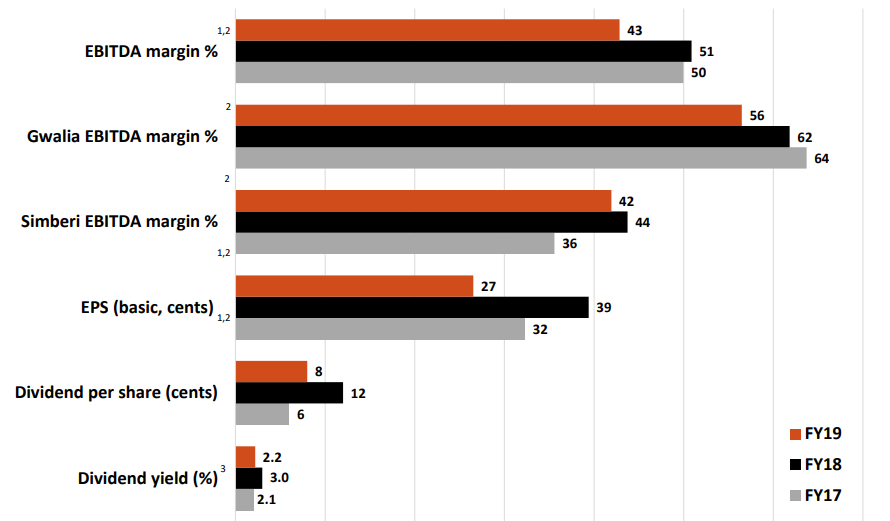
FY19 Key Highlights for the year ended June 30, 2019: Total revenue decreased from $679,204,000 in FY18 to $650,321,000 in FY19. This decrease was due to the reduced production for the Group, partially offset by the higher average gold price of $1,762 per ounce, as compared to $1,691 per ounce in FY18. Interest revenue for the period was reported at $10,073,000 in FY19 as compared to $5,283,000 in FY18. Other income for the year was reported at $115,000 as compared to $2,053,000 in FY18, representing minor asset sales.
Statutory net profit after tax (NPAT) for the period was reported at $144 Mn. Underlying NPAT for the period was reported at $142 Mn. Underlying NPAT represented net profit, excluding significant items (which included the benefit from an increase in deferred tax assets associated with the Simberi Operations, and costs associated with the acquisition of Atlantic Gold Corporation). Mine operating cost for the period was reported at $299,075,000 as compared to $275,695,000 in the previous year. The increase in operating cost can be attributed to the higher processing costs at Simberi and impact of weaker AUD/USD exchange rate on conversion of Simberi USD denominated results.
Total net cash contribution (a non-IFRS financial information, excluding corporate royalties paid) from operations for the period was reported at $213,209,000, which reflected an increase in substantial capital expenditure in 2019 at Gwalia and Simberi. The company declared a fully franked final dividend of 4 cents per share, with record date and payment date on September 4, 2019 and September 25, 2019, respectively.
Total production for the Group for FY19 was reported at 362,346 ounces of gold as compared to 403,089 ounces in FY18, and gold sales for the period was reported at 368,444 ounces in FY19 as compared to 400,956 ounces in FY18 at an average gold price of $1,762 per ounce in FY19 as compared to $1,691 per ounce in FY18. The impact of lower production at Gwalia of 220,169 ounces was partially offset by a new production record at Simberi of 142,177 ounces. Consolidated All-In Sustaining Cost (AISC) for the Group was reported at $1,080 per ounce in FY19 as compared to $891 per ounce in FY18, reflecting the impact of lower production and higher operating costs at Gwalia, and increased sustaining capital expenditure at both Gwalia and Simberi.
FY19 Key Financial Metrics (Source: Company Reports)
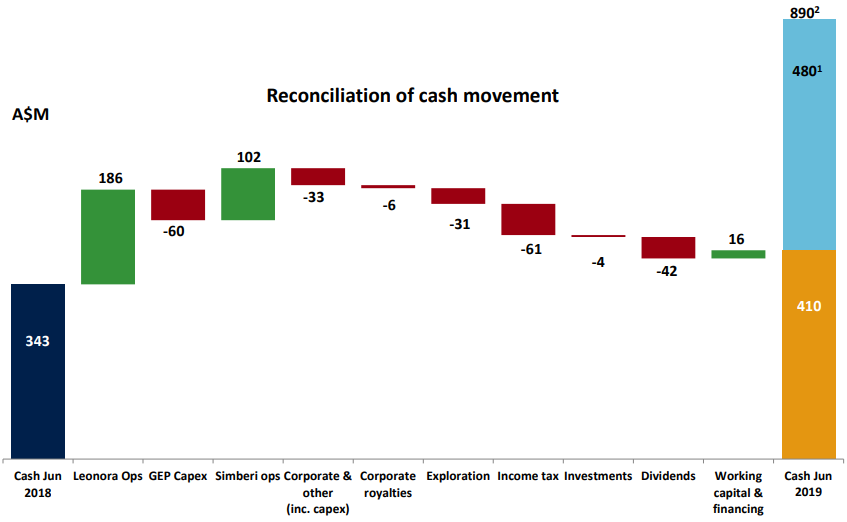
Cash Balance as on June 30, 2019 Increased by ~289% On Previous Year: Cash flows from operating activities for the year were reported at $240,774,000 as compared to $315,679,000 in FY18, reflecting the impact of lower receipts from customers and significantly higher income tax payments. Receipts from customers were reported at $647,566,000 as compared to $681,146,000 in FY18, reflecting the impact of lower gold sales from Gwalia. Payments to suppliers were reported at $336,717,000 as compared to $322,139,000 in FY18, mainly attributable to higher production volumes at Simberi.
Net cash flows from investing activities for the period was reported at $28,254,000, as compared to $212,988,000 in FY18, which included the benefit of cash transferred from deposits held to maturity of $106,200,000. Mine development expenditure was reported at $97,333,000 as compared to $59,134,000 in FY18, which included expenditure related to the Gwalia Extension Project. Expenditure on property, plant and equipment for the period was reported at $20,651,000 for FY19 as compared to $12,043,000 in FY18, which was due to higher expenditure at Gwalia and Simberi. Exploration expenditure for the period was reported at $12,676,000 as compared to $5,020,000 in FY18, which is related to the deep drilling program at Gwalia to extend the orebody at depth, and sulphide drilling at Simberi.
Net cash inflow from the financing activities for the period was reported at $436,885,000, as compared to net outflow of $42,843,000 in FY18. This included proceeds of $479,558,000 (net of transaction fees to assist in funding the acquisition of Atlantic Gold) from the issue of new equity. It also included the payment of dividends during the year at $41,634,000 as compared to $40,997,000 in FY18.
Cash balance as on June 30, 2019 was reported at $880,199,000 as compared to $226,443,000 in FY18, which included $479,558,000 from equity raised, with an additional $10,000,000 in deposits held to maturity. Total interest-bearing liabilities reduced from $39,000 in FY18 to ‘Nil’ as on June 30, 2019.
FY19 Cash Flow Metrics (Source: Company Reports)
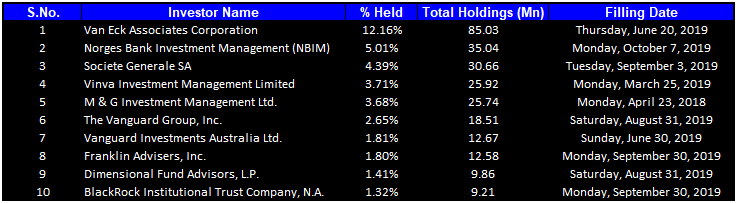
Top 10 Shareholders: The top 10 shareholders have been highlighted in the table, which together form around 37.93% of the total shareholding. Van Eck Associates Corporation holds the maximum interest in the company at 12.16%, followed by Norges Bank Investment Management (NBIM), holding 5.01% of the shares, which became a substantial holder in the company effective from October 7, 2019.
Top Ten Shareholders (Source: Thomson Reuters)
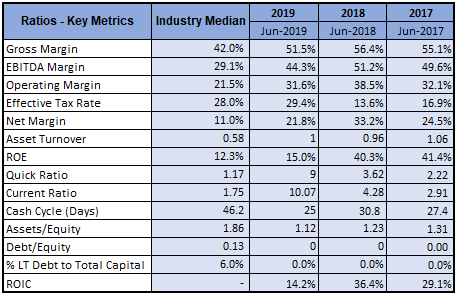
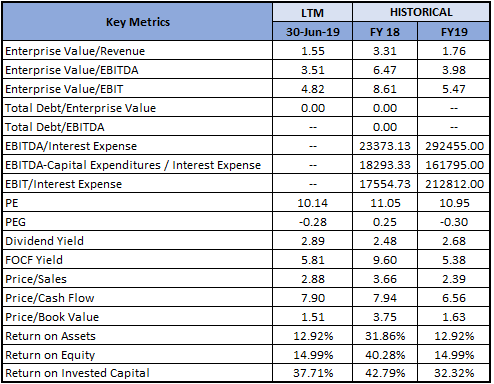
Key Metrics: In FY19, the company had a gross margin, EBITDA margin and net margin of 51.5%, 44.3% and 21.8%, better than the industry median of 42.0%, 29.1% and 11.0%, respectively, implying decent fundamentals for the company. Its ROE for FY19 stood at 15%, better than the industry median of 12.3%, which implies that the company generated a decent return for its shareholders than its peer group. Its Current ratio for the year stood at 10.07x, better than the industry median of 1.75x, which implies that the company is in a better position to address its short-term obligations.
Key Metrics (Source: Thomson Reuters)
Recent Update:
On October 7, 2019, Alice Queen Limited (ASX: AQX) informed the market that it has completed a soil and rock chip geochemical sampling program across its Horn Island project under a recently formed Joint Venture with St Barbara. The rock chip sampling has revealed an extensive zone of quartz-sulphide and quartz only veins, with associated sericite-chlorite alteration, extending ~2.0 km to the NW from the Horn Island gold resource (~0.5 Moz Au inferred resource, based on 7.96 Mn tonnes at an average grade of 1.9 g/t Au, using a 0.5 g/t Au cut-off grade).
Although assay results from this geochemical survey campaign are currently pending, several encouraging observations have been noted from rock chip sampling of outcropping quartz vein occurrences, supporting a number of fundamental features that potentially outline extension of the hydrothermal system from the currently defined Horn Island gold resource.
Key Risks: The company is susceptible to business risks such as fluctuations in the United States Dollar, spot gold price, hedging risk, government regulation, operating risks and hazards, weather conditions, production cost estimates, change in input costs, risks associated with exploration and development such as preciseness in estimates for ore reserves and mineral resources, etc.
What to Expect: As per the release, gold production for FY20 has been projected in the range 310,000 to 335,000 ounces from Gwalia and Simberi, with All?In Sustaining Cost in the range of $1,250 per ounce to $1,350 per ounce. Sustaining capital expenditure is likely to be in the range of $59 Mn to $70 Mn. Growth capital at Gwalia has been estimated in the range of $30 Mn to $35 Mn. Exploration expenditure has been estimated in the range of $20 Mn and $28 Mn.
Moreover, the exploration program in 2020 aims to focus on deep drilling at Gwalia, exploration in the Greater Gwalia area and in the Leonora region, continued exploration at Pinjin in Western Australia and Back Creek in New South Wales, and to drill targets on the Tatau and Big Tabar islands in Papua New Guinea.
Key Valuation Metrics (Source: Thomson Reuters)
Valuation Methodology 1: Price to Cash Flow based Valuation
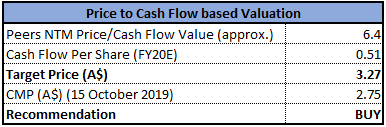
Price to Cash Flow Multiple Approach (Source: Thomson Reuters), *NTM-Next Twelve Months
Valuation Methodology 2: EV to Sales Multiple Approach (NTM):
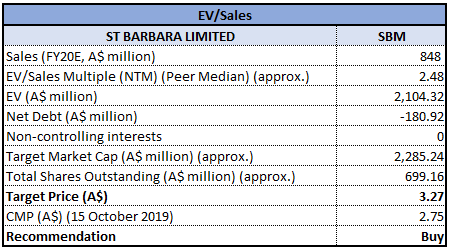
EV/Sales Multiple Approach (Source: Thomson Reuters), *NTM-Next Twelve Months
Note: All forecasted figures and peers have been taken from Thomson Reuters, *NTM-Next Twelve Months
Stock Recommendation: SBM’s stock generated a negative YTD return of 39.73%, while in the span of one year, it has generated a negative return of 30.65%. Currently, the stock is trading close to its 52-week low level of $2.480. Company’s production in September quarter improved over previous quarter and its FY19 top-line and bottom-line stood positive with decent profitability margins. It has sufficient cash balance to funds its operations. Moreover, encouraging results at Horn island Project along with its production guidance for FY20 are expected to boost the company’s earnings in the coming times. Looking at the business prospects over the long-term, we have valued the stock using two relative valuation methods, i.e., Price to Cash Flow and Enterprise Value to Sales multiples, and arrived at a target price of double-digit growth (in % term). Hence, we give a “Buy” recommendation on the stock at the current market price of A$2.750, up 1.103% as on 15 October 2019.
(1).jpg)
SBM Daily Technical Chart (Source: Thomson Reuters)
Disclaimer
The advice given by Kalkine Pty Ltd and provided on this website is general information only and it does not take into account your investment objectives, financial situation or needs. You should therefore consider whether the advice is appropriate to your investment objectives, financial situation and needs before acting upon it. You should seek advice from a financial adviser, stockbroker or other professional (including taxation and legal advice) as necessary before acting on any advice. Not all investments are appropriate for all people. Kalkine.com.au and associated pages are published by Kalkine Pty Ltd ABN 34 154 808 312 (Australian Financial Services License Number 425376). The information on this website has been prepared from a wide variety of sources, which Kalkine Pty Ltd, to the best of its knowledge and belief, considers accurate. You should make your own enquiries about any investments and we strongly suggest you seek advice before acting upon any recommendation. Kalkine Pty Ltd has made every effort to ensure the reliability of information contained in its newsletters and websites. All information represents our views at the date of publication and may change without notice. To the extent permitted by law, Kalkine Pty Ltd excludes all liability for any loss or damage arising from the use of this website and any information published (including any indirect or consequential loss, any data loss or data corruption). If the law prohibits this exclusion, Kalkine Pty Ltd hereby limits its liability, to the extent permitted by law to the resupply of services. There may be a product disclosure statement or other offer document for the securities and financial products we write about in Kalkine Reports. You should obtain a copy of the product disclosure statement or offer document before making any decision about whether to acquire the security or product. The link to our Terms & Conditions has been provided please go through them and also have a read of the Financial Services Guide. On the date of publishing this report (mentioned on the website), employees and/or associates of Kalkine Pty Ltd do not hold positions in any of the stocks covered on the website. These stocks can change any time and readers of the reports should not consider these stocks as personalised advice.
 Please wait processing your request...