Kalkine has a fully transformed New Avatar.

Company Overview: St Barbara Limited (ASX: SBM) is a gold producer and explorer which is primarily involved in the mining and the sale of gold, mineral exploration and development. The company has a diversified portfolio of gold operations including Leonora Operations in Western Australia, the Simberi operations in Papua New Guinea, and the Atlantic Gold Operations in Nova Scotia, Canada. Leonora Operations comprise the Gwalia underground mine which is St Barbara’s cornerstone asset. The Gwalia deposit has an average Ore Reserve grade of 6.4 g/t Au down to 2,140 metres below surface..png)
SBM Details
(1).png)
Strong production and Cost performance in FY19: St Barbara Limited (ASX: SBM), a gold producer and explorer, has a diversified portfolio of gold operations. The company is focused on adding and managing assets in all phases of the ‘growth pipeline’ from exploration through feasibility and construction to production. St Barbara continues to invest to improve infrastructure, mining fleets and capability to ensure consistent and reliable production at its operations and to maintain operating costs at levels that protect profit margins and ensure an adequate return on capital invested. From 2015 to 2019, the company’s top-line grew at a CAGR of 4.16% while its bottom-line grew at a CAGR of 35.56%. The company’s past five-year performance is depicted in below image-.png)
Past Performance During 2015 – 2019 (Source: Thomson Reuters)
The company entered FY20 with a diversified portfolio of gold operations, a number of near mine prospective targets at each operation and a strong balance sheet sufficient to finance the company’s strategy and with the flexibility to adapt to different gold price environments. With three operations, the company has a solid platform and is well-positioned to augur future growth in the coming months.
Key Highlights of FY19 Performance: During the last financial year, i.e., FY19, the company’s operations achieved strong production and cost performance. St Barbara’s total production in FY19 was 362,346 ounces of gold with gold sales of 368,444 ounces at an average gold price of $1,762 per ounce. During the year, the company made a new production record at Simberi of 142,177 ounces. In FY19, the total sales revenue from the Leonora operations was $392.67 million, generated from gold sales of 222,625 ounces at an average achieved gold price of $1,762 per ounce. In FY19, the company reported a statutory net profit after tax of $144.16 million with net cash contribution of $213.209 million..png)
FY19 Performance Highlights (Source: Company Reports)
Half-year FY20 Performance Highlights: In the first half of FY20, the company reported statutory profit after tax of $39 million with underlying profit after tax of $35 million. Further, the company reported revenue from ordinary activities of $361.9 million, up 9% on the previous corresponding period. Over the half-year period, the company reported gold production of 181,728 ounces at a Group All-in Sustaining Cost of $1,391 per ounce. If compared to the previous corresponding period, the results were softer, due to the lower production previously reported at Gwalia and Simberi. However, Atlantic Gold has made a significant contribution over the period, on the back of its record gold production for the half. During the half-year period, the company’s exploration activities were focused on investigating highly prospective near mine targets at Simberi and targets on the surrounding islands. The company expensed around $26.722 million on exploration. The total net assets and total equity of the company increased during the period by $38.346 million to $1.295 billion due to the operating result achieved for the period. Over the period, the current liabilities decreased to $85.622 million as a result of the reduction in the tax liability. The company had paid $0.04, a fully franked interim dividend for the half-year to December 2019.
Top 10 Shareholders: The top 10 shareholders have been highlighted in the below table, which together forms around 38.19%. Van Eck Associates Corporation and The Vanguard Group, Inc. hold the maximum interest in the company at 12.16% and 5.0%, respectively..png)
Top 10 Shareholders (Source: Thomson Reuters)
Resilient Performance Amid Covid-19 Pandemic: On 31 March 2020, St Barbara provided an update on COVID-19, wherein it informed that the company is able to maintain its operations, production and gold shipments in Australia, Canada and PNG. At each of its sites across Australia, Papua New Guinea and Canada, the company is implementing and adapting business continuity measures to mitigate and minimise any potential impacts of the global outbreak that might affect its operations, supply chain or commercial activities. As a precautionary measure, the company has drawn down $ 200 million from its existing syndicated debt facility, to bolster cash reserves which will be prudently conserved during this uncertain time.
Precautionary measures taken to reduce Covid-19 Risks: On 20 March 2020, St Barbara MD & CEO Craig Jetson released a message in which it advised that in order to reduce risk from Covid-19 impacts, the company has implemented various measures, in-line with the relevant government advice including cancelling all non-essential travel, working from home where practicable, enforcing self-isolation policies when appropriate and encouraging good hygiene practices and social distancing across its workplaces and at home.
A Quick look at Key Metrics: For H1FY20, the company witnessed a gross margin of 47.4%, higher than the industry median of 45.6%. EBITDA margin came in at 39.50%, higher than the Industry median of 36.2%. The company has a current ratio of 2.25x which is higher than the industry median of 1.70x, demonstrating that the company is well placed to pay its short-term obligations.
.png)
Key Metrics (Source: Company Reports)
Expanding Ore Reserves at Simberi gold mine: On 2nd March 2020, the company released Ore Reserves and Mineral Resources statements for Simberi gold mine, as per which, as at 31 December 2019 Simberi Island had Ore Reserves of 33.7 Mt @ 2.0 g/t Au containing 2.2 Moz of gold with Mineral Resources of 93.5 Mt @ 1.4 g/t Au containing 4.4 Moz of gold.
If compared to the previous publicly reported Proved and Probable Ore Reserve Estimate, Simberi Oxide and Sulphide Ore Reserve has increased by 486,000 ounces of gold to 34,321,000 t @ 2.0 g/t Au containing 2,173,000 ounces of gold, primarily due to increased drill density in Sorowar, a higher gold price (US$1,300/oz at 31 December 2019 compared with US$1,250/oz at 30 June 2019) and revised pit designs. Moreover, a substantial increase in tonnes has resulted in an additional 452,000 gold of gold to the sulphide reserve, largely driven by the increased drilling in Sorowar and cut-off grade changes.
Simberi’s Mineral Resources and Ore Reserves position as at 31 December 2019 is summarised and compared with the 30 June 2019 statement below:.png)
Simberi’s Mineral Resources and Ore Reserves position (Source: Company Reports)
What to expect: In the upcoming months, the company is expecting to complete the Gwalia Extension Project and provide an update on the sulphide study work at Simberi. In FY20, the company expects its consolidated production to be between 370 to 400 koz with AISC of A$1,330 to 1,420/oz. For the year, the production expected from the Gwalia mine is in the range of 170 – 180 koz and from Simberi, the expected production is between 105 – 115 koz..png)
Production and cost profile (Source: Company Profile)
From Atlantic gold operations, the company expects its production to be between 95-105 koz. Atlantic Gold has 21 exploration projects in Nova Scotia, with >1,900km2 of exploration tenements. The company has approved $10-$12 million in Q2 FY20 to study development projects. At Gwalia, the development and production are anticipated to improve during the second half of FY20, as Gwalia Extension Project (GEP) construction concludes and ventilation increases. The company’s exploration guidance for FY20 is set at $31 to $41 million. This includes $7 – $9 million spend at Leonora Region to shift focus from Gwalia Deep Drilling to Greater Gwalia and region; and $5 – $7 million at Pinjin, Lake Wells and Back Creek for geophysics/aircore drilling of identified targets. In the next five years, the company intends to actively add, manage and progress its assets in all phases of the pipelines. .png)
Key Valuation Metrics (Source: Thomson Reuters)
Valuation Methodology: EV/EBITDA Multiple Based Relative Valuation.png)
EV/EBITDA Multiple Approach (Source: Thomson Reuters)
Note: All the forecasted figures are taken from Thomson Reuters, NTM: Next Twelve Months
Stock Recommendation: In the past three months, the stock has corrected by 16.24%. The stock is currently trading near to its 52-week low of $1.615, offering a decent opportunity to investors for accumulation. We have valued the stock using EV/EBITDA multiple based relative valuation and arrived at a target upside of lower double-digit (in percentage terms). For the said purpose, we have taken peers like OceanaGold Corp (ASX: OGC), Regis Resources Ltd (ASX: RRL), Resolute Mining Ltd (ASX: RSG), etc. Considering the company’s resilient performance amid Covid-19 pandemic, its decent production and expenditure guidance and current trading levels, we give a “Buy” recommendation on the stock at the current market price of $2.130, down by 6.167% on 31 March 2020.
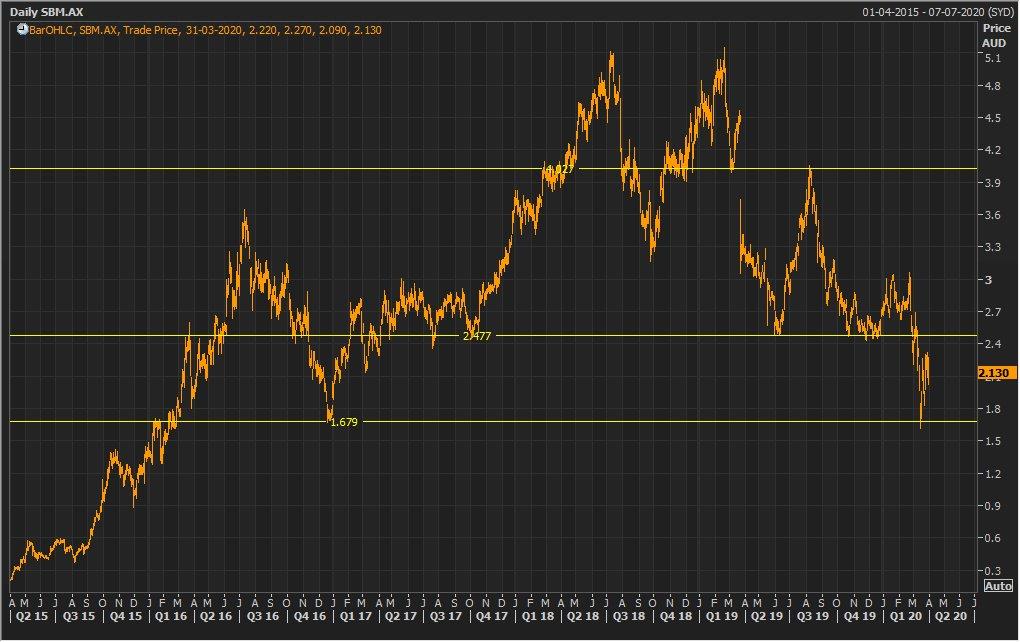
SBM Daily Technical Chart (Source: Thomson Reuters)
Disclaimer
The advice given by Kalkine Pty Ltd and provided on this website is general information only and it does not take into account your investment objectives, financial situation or needs. You should therefore consider whether the advice is appropriate to your investment objectives, financial situation and needs before acting upon it. You should seek advice from a financial adviser, stockbroker or other professional (including taxation and legal advice) as necessary before acting on any advice. Not all investments are appropriate for all people. Kalkine.com.au and associated pages are published by Kalkine Pty Ltd ABN 34 154 808 312 (Australian Financial Services License Number 425376). The information on this website has been prepared from a wide variety of sources, which Kalkine Pty Ltd, to the best of its knowledge and belief, considers accurate. You should make your own enquiries about any investments and we strongly suggest you seek advice before acting upon any recommendation. Kalkine Pty Ltd has made every effort to ensure the reliability of information contained in its newsletters and websites. All information represents our views at the date of publication and may change without notice. To the extent permitted by law, Kalkine Pty Ltd excludes all liability for any loss or damage arising from the use of this website and any information published (including any indirect or consequential loss, any data loss or data corruption). If the law prohibits this exclusion, Kalkine Pty Ltd hereby limits its liability, to the extent permitted by law to the resupply of services. There may be a product disclosure statement or other offer document for the securities and financial products we write about in Kalkine Reports. You should obtain a copy of the product disclosure statement or offer document before making any decision about whether to acquire the security or product. The link to our Terms & Conditions has been provided please go through them and also have a read of the Financial Services Guide. On the date of publishing this report (mentioned on the website), employees and/or associates of Kalkine Pty Ltd do not hold positions in any of the stocks covered on the website. These stocks can change any time and readers of the reports should not consider these stocks as personalised advice.
 Please wait processing your request...