
Company Overview: Smartgroup Corporation Ltd is an Australia-based company, which is engaged in outsourced administration, including salary packaging, novated leasing, software, distribution and services, and fleet management services. The Company's segments include Outsourced administration, Vehicle services, and Software, distribution and group services (SDGS). The Outsourced administration provides outsourced salary packaging services, which includes salary packaging administration, novated leasing and share plan administration. The Vehicle services segment is engaged in end-to-end fleet management services. The SDGS segment provides salary packaging software solutions, distribution of vehicle insurances and information technology services. Its employee benefits brands include Smartsalary, Smartleasing, Smartfleet, PBI Solutions, Advantage, Health-e Workforce Solutions, Smartequity, Autopia and Selectus. The Company serves the corporate, health and government sectors.
.png)
SIQ Details
Robust Financial Performance and Client Growth Witnessed: Smartgroup Corporation Ltd (ASX: SIQ) is engaged in the business of salary packaging, administration, and fleet management services. As on July 18, 2019, the market capitalisation of Smartgroup Corporation Ltd stood at ~$1.21 billion. The company witnessed robust financial performance which is evident from the revenues of $241.8 million and NPATA amounting to $78.0 million in CY18, reflecting an increase of 18% and 22%, respectively on YoY basis. The company also grew its core packaging and leasing business organically and continued its ongoing integration of the acquired businesses. The company added that its salary packages and novated leases under management witnessed growth, which, coupled with the decreased FTE numbers, reflects around a 10% efficiency saving. The company’s salary packages and novated leases under management increased because of organic activities.
Additionally, the company witnessed a growth in the fleet management footprint because of organic and acquisitive activities. The Fleet West product offering has been performing well and it has been an important contributor when it comes to cross-selling initiatives. It can be said that the respectable growth in the company’s key metrics in CY18 had led to the declaration of final dividend amounting to 21.0 cents per share. As a result, the company’s total dividend stood at 41.5 cents per share (fully franked) in CY18, which reflects the rise of 19% on YoY basis. It is worth noting that the company had even paid a special dividend amounting to 20.0 cents per share on May 6, 2019. The growth in the key metrics was not only witnessed in CY18 but also in other years. The company’s top line had witnessed a CAGR growth of 34.79% in the time frame from CY14- CY18, which reflects that SIQ is possessing strong capabilities to generate revenues. The strong operational capabilities coupled with the revenue-generation capabilities, further strengthen the confidence in SIQ’s long-term growth prospects.
The company’s capabilities to generate revenues and its diversified client base might act as the tailwinds for growth moving forward. The company’s annual dividend yield of 4.52% is higher than the broader industry average of 4%, which might attract the attention of market players moving forward. Moreover, the company has recorded an average RoE of 22.77% in the past 3 years and has now improved it to 23.90% in CY18. At CMP of A$9.150, SIQ is trading at a PE of 13.66x CY20E earnings. Keeping the view of growth potential in the long run, we have valued the stock using Relative valuation approach, P/E and Price/Cash flow multiple and 4-year average P/E multiple to CY20E consensus EPS of $0.67 and have arrived at the target price upside of lower double-digit growth (in %).
.png)
Key Financial Metrics (Source: Company Reports, Thomson Reuters), NA- Not Available, *Represents dividend declared only for H2 2014
Decent Footing from Key Margins’ Perspective: Smartgroup Corporation Ltd witnessed improvement in its key margins in CY18 as compared to CY17. The company’s net margin, in CY18, stood at 24.5%, which reflects an increase of 4.4% on YoY basis, depicting its improved capability to convert top-line into the bottom-line. EBITDA margin stood at 47.8% in CY18, reflecting a rise of 2.5% on a YoY basis. Additionally, the company’s current ratio stood at 1.15x, reflecting a rise of 9.4% on a YoY basis and, thus, it looks like that the company would be able to meet its short-term obligations. Also, respectable liquidity levels reflect that the company could make deployments toward strategic business objectives and operational capabilities, which might act as key growth catalysts.
Debt/Equity ratio stood at 0.23x in CY18, which is lower than the industry median of 0.29x and, therefore, it can be assumed that the company is having a lower dependency on debt as compared to the broader industry. Additionally, long-term debt as a percentage to total capital stood at 19% in CY18, which reflects a significant reduction from 40.8% in CY17. The respectable liquidity levels, capabilities to convert top-line into the bottom-line, and lower debt might support the company moving forward in achieving long-term objectives.
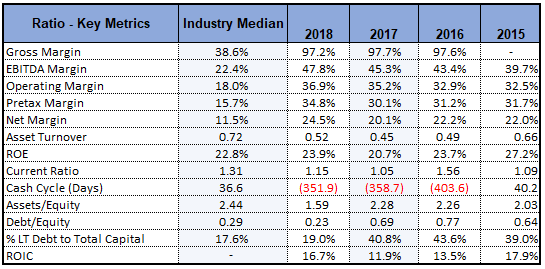
Key Ratio Metrics (Source: Thomson Reuters)
Contributions and Additional Synergies Supported SIQ’s EBITDA: The following picture gives the broader idea of how the contributions as well as additional synergies from CY17 acquisitions enabled the company to post an EBITDA amounting to around $112 million:
.png)
EBITDA (Source: Company Reports)
The company’s client base continued to grow, and the key end markets are PBIs, Hospitals, Government, and Education.
EML Signs Multi-Year Agreement: EML Payments Limited (ASX: EML) had earlier made an announcement that it entered into eight-year agreement with Smartgroup Corporation Limited to be their provider of the branded General Purpose Reloadable card programs for payout of Salary Packaging benefits. The release also mentions that EML has worked with SIQ since 2017 and currently manages around 50,000 benefit accounts.
Update on the Acquisitions: In the Wilsons Rapid Insights Conference Melbourne presentation, Smartgroup Corporation Ltd provided an update with respect to the acquisitions. The company stated that it acquired the novated leasing assets of Mylease from iNovation Pty Ltd for the consideration of $6.9 million in cash, including $1.0 million retained in escrow. Also, Smartgroup executed the Share Purchase Agreement with vendors of “Acquisition 2” on May 8, 2019. It was also mentioned that the vendors have requested that the identity of the acquired company should not be disclosed till the client and employee communications occur.
.png)
An Overview of Synergistic Acquisitions (Source: Company Reports)
Key Takeaways From CY18 Annual Report: Smartgroup Corporation Ltd stated that it had witnessed another year of growth as well as improved financial results, because of continued innovation, customer service, and ongoing integration of the past acquisitions. It was also mentioned that the company has over 700 staff throughout Australia, serving approximately 3,500 clients and more than 343,000 salary packaging customers. The company added that after several acquisitions over the past years, in 2018 it focused efforts towards integrating as well as streamlining the operations and processes. Considering the expanded client base and the range of services SIQ provide, it is well-positioned to help the clients reduce administration as well as the cost of doing business.
.png)
Key Metrics of Smartgroup (Source: Company Reports)
Dividend per share on the rise: Over the past four years, the company has consistently distributed dividends with decent payout ratios in the range of 66% to 70%. In CY18, Smartgroup Corporation Ltd declared the dividends amounting to 41.5 cents per share, which reflects a rise of 19% on a YoY basis. The following picture provides a broader idea of the dividends which have been declared by the company from the past few years:
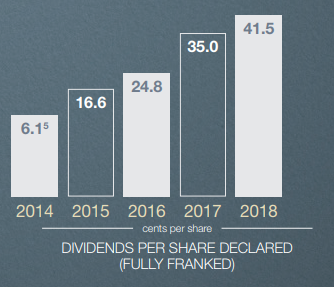
Dividends Per Share Declared (Source: Company Reports)
Since CY14, the company has been declaring dividends which are higher than the prior year that reflects that the company has been focusing on delivering returns to its shareholders. This strategy might attract the attention of dividend-seeking investors. Additionally, the company has paid special dividend amounting to 20.0 cents per share on May 6, 2019.
What to Expect From SIQ Moving Forward: The management of Smartgroup Corporation Ltd is optimistic about CY19. The company witnessed improvement throughout all the key financial as well as operational metrics, which might attract the attention of market players. Additionally, the company is possessing a growing and diversified client base, which might act as a tailwind for the company moving forward.
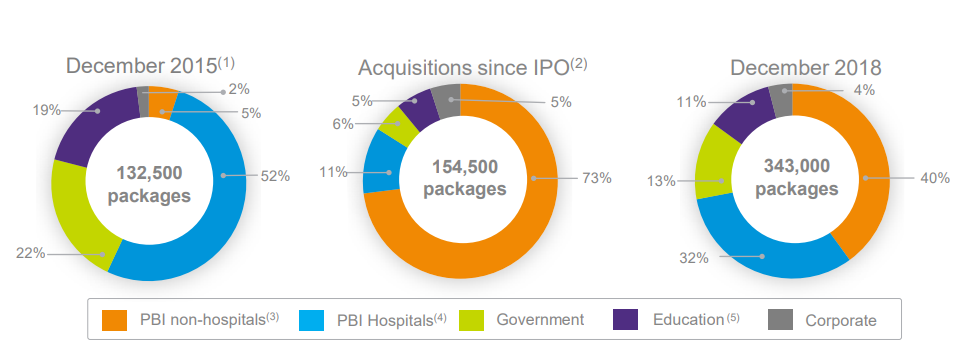
Growing and Diversified Client Base (Source: Company Reports)
The company’s objectives when managing capital are to safeguard its ability to continue as a going concern, so that it could provide returns for the shareholders as well as benefits for other stakeholders and to maintain an optimum capital structure in order to reduce cost of capital. The company’s total debt reduced in CY18 on a YoY basis, which might help in stabilizing its balance sheet and might prepare it to achieve respectable long-term growth.
Valuation Methodology 1: PE Multiple Approach (NTM):
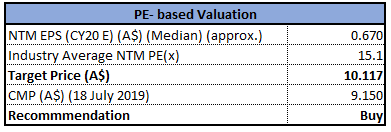
PE- Based Valuation (Source: Thomson Reuters), *NTM: Next Twelve Months
Valuation Methodology 2: Price/Cash Flow Multiple Approach (NTM):
.png)
Price/Cash Flow Multiple Approach (Source: Thomson Reuters), *NTM-Next Twelve Months
Note: All forecasted figures and peers have been taken from Thomson Reuters, *NTM-Next Twelve Months
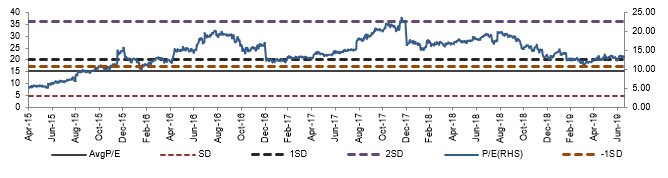
Historical P/E Band (Source: Company Reports)
Stock Recommendation: Smartgroup Corporation Ltd is having respectable balance sheet position as its cash and short-term investments increased in the time frame of CY14- CY18, which reflects that the company has decent capabilities to generate cash and make its liquidity levels even stronger. Between CY14- CY18, the company’s current asset base also witnessed an improvement. Coming to the debt position, the company’s total debt encountered a fall from CY17 to CY18 and, therefore, it can be said that the company focused on deleveraging its balance sheet. A deleveraged balance sheet might support its growth prospects moving forward.
From the analysis standpoint, the company seems to be quite attractive as its bottom line witnessed CAGR growth of 43.19% in the time span of CY15- CY18. The reduction in debt levels, strong capabilities to generate revenues and decent liquidity levels are expected to act as key growth catalysts for the company moving forward. The stock of Smartgroup Corporation Ltd has delivered the return of 14.04% in the span of previous three months while, in the time frame of past one month, the stock’s return stood at 3.03% which might be considered at respectable levels. Keeping the view of growth potential in the long run, we have valued the stock using Relative valuation approach, P/E and Price/Cash flow multiple and 4-year average P/E multiple to CY20E consensus EPS of $0.67 and have arrived at the target price upside of lower double-digit growth (in %). Currently, the stock is trading below the average of 52 week high and low prices of around $10.04 with a beta of 0.81x (5-Years, Monthly), depicting a decent opportunity for accumulation. Hence, in the view of aforesaid parameters, we give a “Buy” recommendation on the stock at the current market price of A$9.150 per share (down 0.327% on 18 July 2019).
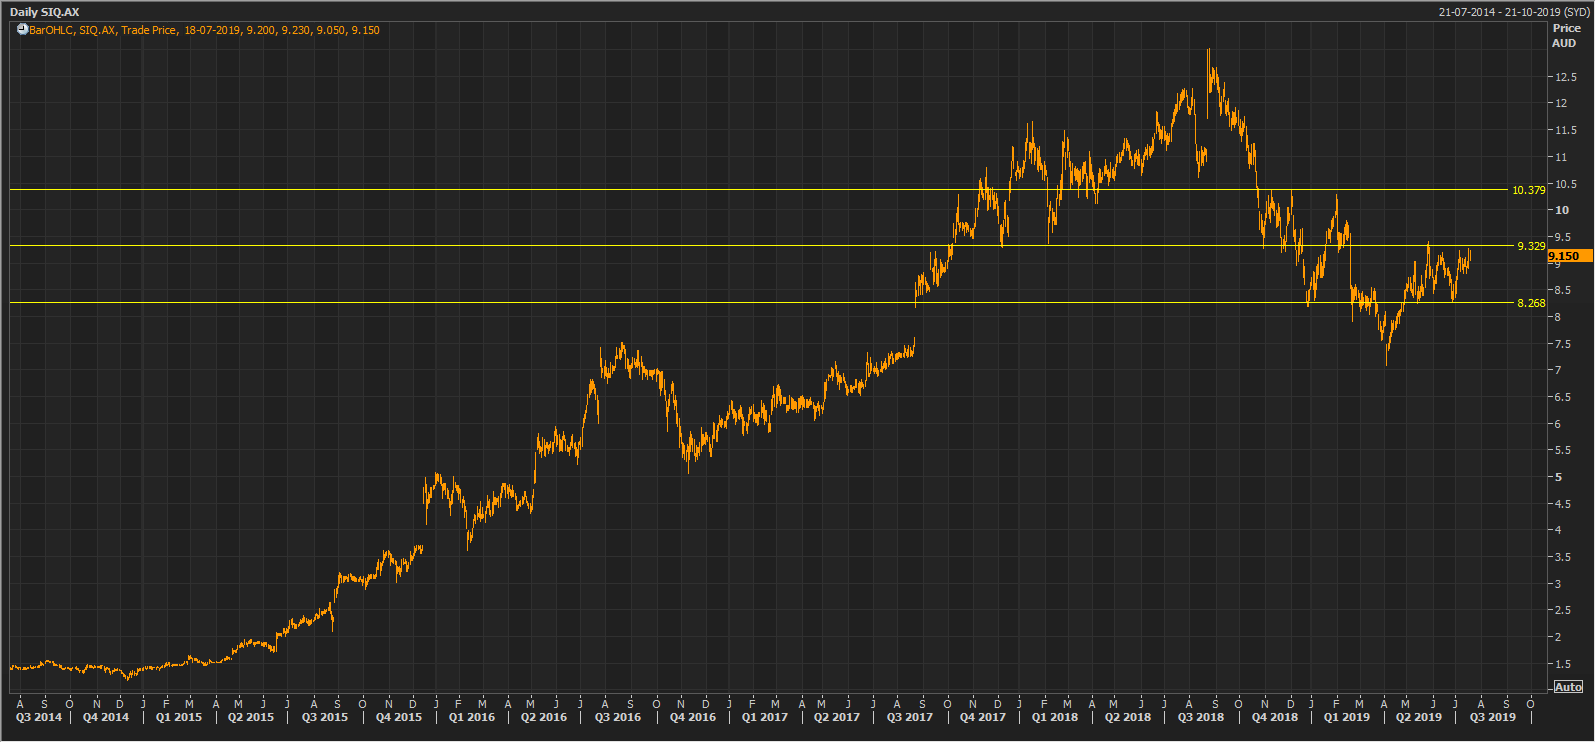
SIQ Daily Chart (Source: Thomson Reuters)
Disclaimer
The advice given by Kalkine Pty Ltd and provided on this website is general information only and it does not take into account your investment objectives, financial situation or needs. You should therefore consider whether the advice is appropriate to your investment objectives, financial situation and needs before acting upon it. You should seek advice from a financial adviser, stockbroker or other professional (including taxation and legal advice) as necessary before acting on any advice. Not all investments are appropriate for all people. Kalkine.com.au and associated pages are published by Kalkine Pty Ltd ABN 34 154 808 312 (Australian Financial Services License Number 425376). The information on this website has been prepared from a wide variety of sources, which Kalkine Pty Ltd, to the best of its knowledge and belief, considers accurate. You should make your own enquiries about any investments and we strongly suggest you seek advice before acting upon any recommendation. Kalkine Pty Ltd has made every effort to ensure the reliability of information contained in its newsletters and websites. All information represents our views at the date of publication and may change without notice. To the extent permitted by law, Kalkine Pty Ltd excludes all liability for any loss or damage arising from the use of this website and any information published (including any indirect or consequential loss, any data loss or data corruption). If the law prohibits this exclusion, Kalkine Pty Ltd hereby limits its liability, to the extent permitted by law to the resupply of services. There may be a product disclosure statement or other offer document for the securities and financial products we write about in Kalkine Reports. You should obtain a copy of the product disclosure statement or offer document before making any decision about whether to acquire the security or product. The link to our Terms & Conditions has been provided please go through them and also have a read of the Financial Services Guide. On the date of publishing this report (mentioned on the website), employees and/or associates of Kalkine Pty Ltd do not hold positions in any of the stocks covered on the website. These stocks can change any time and readers of the reports should not consider these stocks as personalised advice.
Past performance is not a reliable indicator of future performance.
 Please wait processing your request...