Kalkine has a fully transformed New Avatar.

Company Overview: Smartgroup Corporation Ltd is an Australia-based company, which is engaged in outsourced administration, including salary packaging, novated leasing, software, distribution and services, and fleet management services. The Company's segments include Outsourced administration, Vehicle services, and Software, distribution and group services (SDGS). The Outsourced administration provides outsourced salary packaging services, which includes salary packaging administration, novated leasing and share plan administration. The Vehicle services segment is engaged in end-to-end fleet management services. The SDGS segment provides salary packaging software solutions, distribution of vehicle insurances and information technology services. Its employee benefits brands include Smartsalary, Smartleasing, Smartfleet, PBI Solutions, Advantage, Health-e Workforce Solutions, Smartequity, Autopia and Selectus. The Company serves the corporate, health and government sectors.
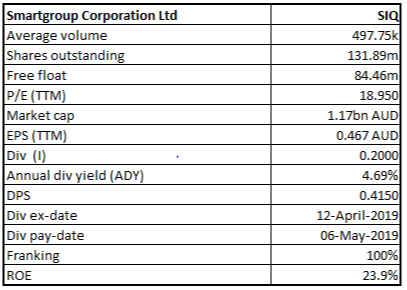
SIQ Details
Decent Fundamentals: Smartgroup Corporation Ltd (ASX: SIQ) is listed on ASX and its principal activities include outsourced administration, being primarily salary packaging, novated leasing, fleet management and software, distribution and group services. As on May 30, 2019, the market capitalisation of SIQ stood at ~$1.17 billion. It had released its financial results for the full year ended December 31, 2018 (or CY 2018) in which it witnessed revenue growth of 18% to $241.8 million while its Earnings, as measured by EBITDA, rose by 19% to $111.8 million. The company maintained the robust cash flow generation and its operating cash flow stood at $78.0 million, which reflected 100% of NPATA. The company possesses a healthy balance sheet which might help it in achieving the business objectives moving forward. Smartgroup happens to be conservatively geared and its net debt stood at $14.6 million as at 31 December 2018, which reflects a net debt / EBITDA of approximately 0.1x.
On the back of earnings profile and balance sheet, the Board of Directors of the company declared a fully franked final dividend of 21.0 cents per share which reflects a rise of 14% on final dividend of 2017. The total dividends for the CY 2018 stood at 41.5 cents per share (fully franked) which is 19% higher than the prior year. Also, EML Payments Limited had made an announcement that it has entered into an 8-year agreement with Smartgroup Corporation Limited to be their provider of branded General Purpose Reloadable card programs for a payout of the Salary Packaging benefits.
Valuation-wise, the stock looks in a decent position with a net margin of 24.5%, and ROE of 23.9% in CY18. Over the last four years (CY15-CY18), the company’s revenues and net profit have grown at a CAGR of 38.2 percent and 43.4 percent, respectively. At CMP of A$8.870, SIQ is trading at a PE multiple of 13.08x FY20E earnings. By looking at its decent fundamentals and diversified client base with strategic contracts wins, we have valued the stock using the two Relative valuation methods, EV/Sales and EV/EBITDA and the four-year average P/E of 17.9x for CY19E with the consensus EPS of $0.62 and arrived at the target price upside in the ambit of lower double-digit (in %). Key Risks related to rating: stiff competitions, liquidity risk, market risks such as changes in interest rates, foreign exchange rates, etc.
.png)
Key Financial Metrics (Source: Company Reports, Thomson Reuters), NA- Not Available, *Represents dividend declared only for H2 2014.
Top 10 Shareholders: The following table provides a broad picture of the top 10 shareholders of Smartgroup Corporation:
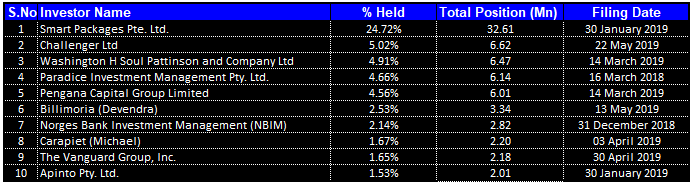
Top 10 Shareholders (Source: Thomson Reuters)
Key Metrics better than Industry Median: Smartgroup Corporation has witnessed a rise in its key financial ratios as its net margin stood at 24.5% in CY 2018, which implies a rise of 4.4% on the YoY basis, reflecting company’s capability to convert its top line into the bottom line. Gross margin and EBITDA margin stood at 97.2% and 47.8% in CY18 which are higher than the industry median of 38.6% and 22.14%, respectively. Moreover, current ratio stood at 1.15x which reflects a YoY improvement of 9.4%, showing that the company is in a decent position to meet its short-term obligations. Debt-to-equity ratio came in at 0.23x in CY18, which is lower than the industry median of 0.29x.
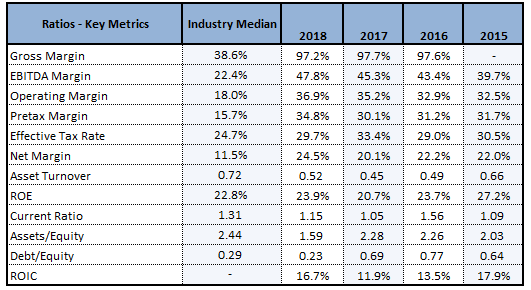
Key Metrics (Source: Thomson Reuters)
Signing of Multi-Year Agreement – Strengthening client base: EML Payments Limited had recently made an announcement that it had entered into an 8-year agreement with Smartgroup Corporation Limited to be their provider of branded General Purpose Reloadable card programs for payout of Salary Packaging benefits. EML had worked with SIQ since 2017 and has been managing around 50,000 benefit accounts. This strategic agreement with EML might strengthen its diversified client base.
Key Insights Into SIQ’s AGM: Smartgroup Corporation managed to post revenues amounting to $241.8 million in CY 2018 and its NPATA, during the same period, stood at $78.0 million. The company’s top-line and bottom-line numbers witnessed a rise in the prior year by 18% and 22%, respectively. Its core packaging and leasing business grew organically and also there was ongoing integration of the acquired businesses.
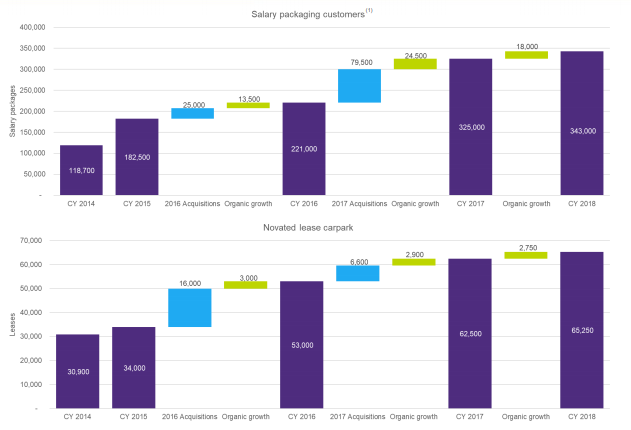
Salary Packaging Customers and Novated Lease Carpark (Source: Company Reports)
The company witnessed growth with respect to salary packages and novated leases under management, which, along with the decreased FTE numbers, reflects around 10% efficiency saving. The company had also released “Wilsons Rapid Insights Conference Melbourne” presentation in which it stated that the salary packages and novated leases under management are increasing due to organic activities. Also, there has been continued growth in the fleet management footprint because of the organic and acquisitive activities. The company stated that The Fleet West product offering has been performing well and acted as an important contributor to the cross-sell initiatives.
Client Base on Rise – Proffers Growth Visibility: The client base of Smartgroup Corporation has been growing and the key end markets are Public Benevolent Institutes (PBIs), Hospitals, Government and Education. The company has witnessed success in delivering multiple services, primarily to the PBI clients. There are 164 clients who are using two or more service offerings. Also, the company has continued to drive the operational efficiencies and enhance sales and IT capabilities, and it is witnessing organic growth in the salary packages and novated leases under management.
Smartgroup had executed the two small acquisitions in the early 2019 and the acquisitions further strengthen the presence in corporate and PBI sectors. The company had acquired the novated leasing assets of Mylease from iNovation Pty Ltd for the consideration of $6.9 million in cash, which includes $1.0 million retained in the escrow. Mylease administers approximately 1,000 novated leases across ~500 employer clients with FY 2018 revenue of around $2.7 million and EBITDA of ~$1.5 million.
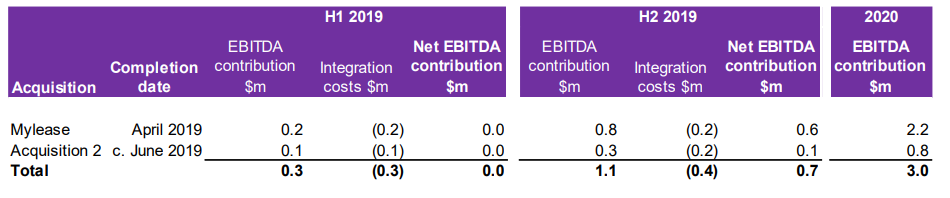
Broader View of Acquisitions (Source: Company Reports)
The company has also made another acquisition in which it acquired 100% of salary packaging and novated leasing business for the consideration of $2.2 million in cash which includes $0.7 million retained in escrow. Smartgroup had executed a Share Purchase Agreement with vendors of this acquisition on May 8, 2019. The vendors had requested that the identity of acquired company needs to be withheld until after client and employee communications occur.
Increase in Dividends Since 2014: In 2018, Smartgroup had declared dividends amounting to 41.5 cents per share, which reflects a rise of 19% on Y-o-Y basis. As can be seen from the chart below, its dividends have been increasing since 2014, which indicates that the company is focused towards providing respectable returns to its shareholders.
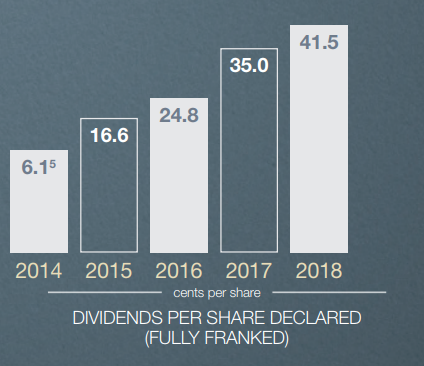
Dividends Per Share Declared (Source: Company Reports), 2014 figure is for H2 only
Apart from that, the company has paid a special dividend (fully franked) amounting to 20.0 cents per share on May 6, 2019. Over the past four years, the company has managed to maintain its decent dividend pay-out ratio in the range of 66% to 70% which can be considered at decent levels as compared to the concerned industry. Moreover, it has a decent track record of consistent dividend payment with a CAGR of 35.7% over the last four years. The annual dividend yield of the company is about 3.1% on a four-year average basis (CY15-18). As per ASX, the company is having an annual dividend yield of 4.69%, which is higher than the industry median (Professional & Commercial Services) of 3.8%. Hence, we believe that the company will continue to manage its increasing trend in relation to the payment of dividends along with respectable pay-out ratio in years to come which might attract the attention of market players moving forward.
What To Expect From SIQ: Smartgroup stated that numerous recent developments are being experienced or are anticipated as the company moves into CY 2019. With respect to Royal Banking Commission – Final Report, the company stated that recommendations which impact Smartgroup (i.e., Deferred sales model for add-on insurance, Cap on commissions) happen to be consistent with the previous recommendations made by ASIC, and there are expectations that the company is well positioned to accommodate them. Most of the major manufacturers have introduced 5-year extended warranties as standard, as compared to the previous time of 3 years, which impacts the company’s ability to sell extended warranties on new cars. There are expectations that this would be having a negative $2 million (approximately) NPATA impact in CY 2019.
With respect to salary packaging, the company is incumbent for around 40% of approximately 90k packages throughout NSW Health. For novated leasing, the company manages around 3,000 leases across NSW Health and would be 1 of 3 panellists, where previously there was a larger panel in place.
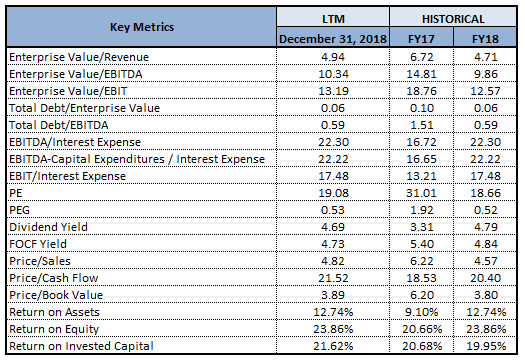
Key Valuation Metrics (Source: Thomson Reuters)
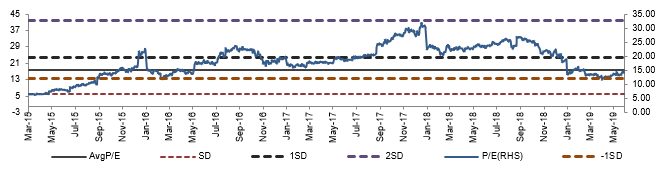
Historical P/E Band (Source: Company Reports)
Stock Recommendation: In the span of previous three months, the stock of Smartgroup has delivered the return of 8.96% and, in the time frame of past one month, the return stood at 5.48% which can be considered at respectable levels. Even though the market conditions were tighter, 2018 had witnessed improvement throughout key financial and operational metrics. The company is expected to be helped by a strong balance sheet as this might help it in meeting long-term business objectives.
The company’s balance sheet is conservatively geared which is evident from net debt / EBITDA ratio of 0.1x at 31 December 2018. This implies that the company is in the sound position to meet its net debt obligations through its EBITDA. Also, the company’s RoE stood at 23.9% in CY 2018, which reflects a rise of 3.2% on the YoY basis that implies improved returns to the shareholders. By looking at its decent fundamentals and diversified client base with strategic contracts wins, we have valued the stock using the two Relative valuation methods, EV/Sales and EV/EBITDA and the four-year average P/E of 17.9x for CY19E with the consensus EPS of $0.62 and arrived at the target price in the ambit of lower double-digit (in %). Hence, we give a “Buy” recommendation on the stock at the current market price of A$8.87 per share (up 0.226% on 30 May 2019).
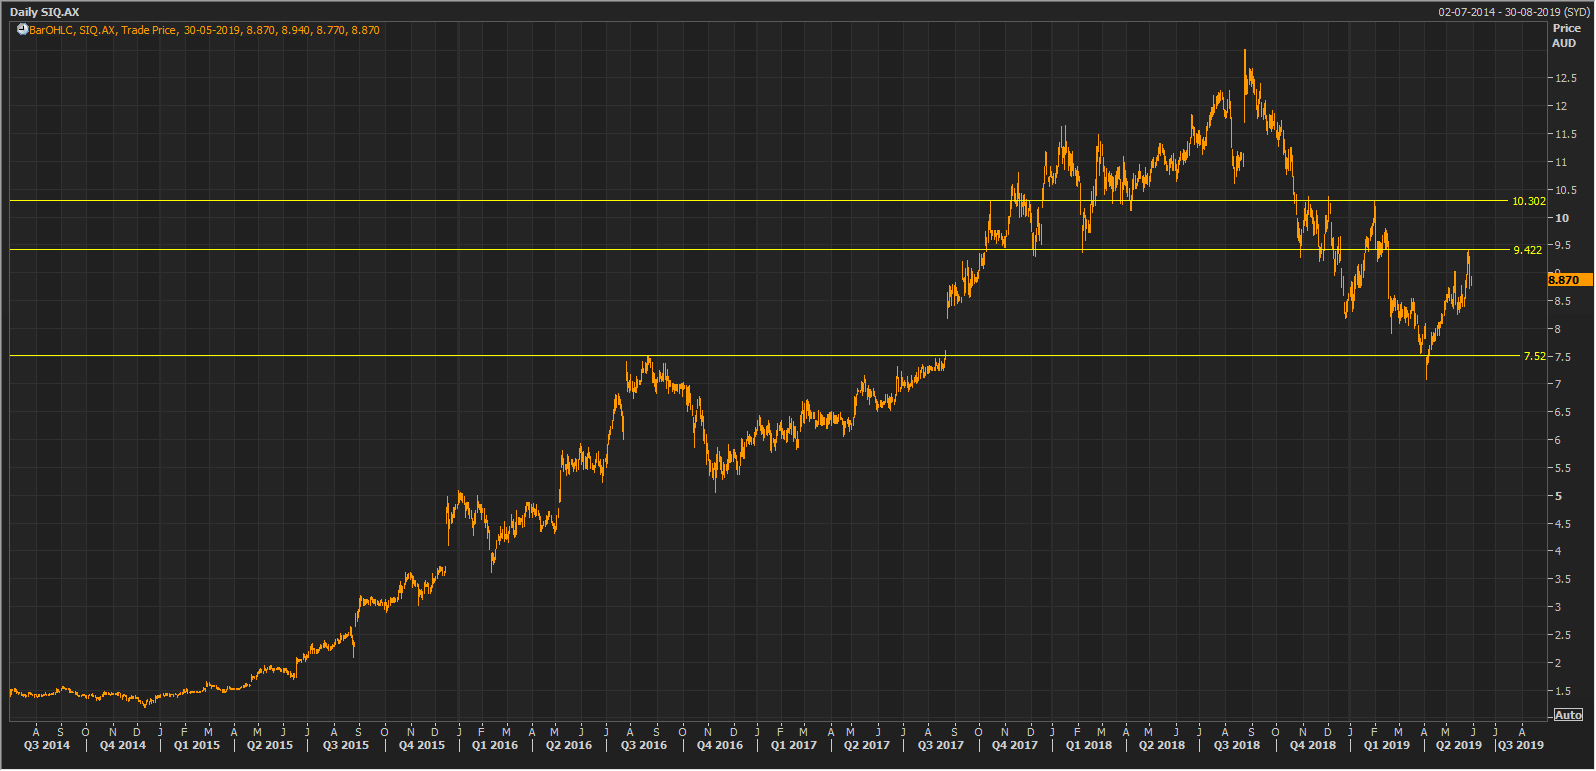
SIQ Daily Chart (Source: Thomson Reuters)
Disclaimer
The advice given by Kalkine Pty Ltd and provided on this website is general information only and it does not take into account your investment objectives, financial situation or needs. You should therefore consider whether the advice is appropriate to your investment objectives, financial situation and needs before acting upon it. You should seek advice from a financial adviser, stockbroker or other professional (including taxation and legal advice) as necessary before acting on any advice. Not all investments are appropriate for all people. Kalkine.com.au and associated pages are published by Kalkine Pty Ltd ABN 34 154 808 312 (Australian Financial Services License Number 425376). The information on this website has been prepared from a wide variety of sources, which Kalkine Pty Ltd, to the best of its knowledge and belief, considers accurate. You should make your own enquiries about any investments and we strongly suggest you seek advice before acting upon any recommendation. Kalkine Pty Ltd has made every effort to ensure the reliability of information contained in its newsletters and websites. All information represents our views at the date of publication and may change without notice. To the extent permitted by law, Kalkine Pty Ltd excludes all liability for any loss or damage arising from the use of this website and any information published (including any indirect or consequential loss, any data loss or data corruption). If the law prohibits this exclusion, Kalkine Pty Ltd hereby limits its liability, to the extent permitted by law to the resupply of services. There may be a product disclosure statement or other offer document for the securities and financial products we write about in Kalkine Reports. You should obtain a copy of the product disclosure statement or offer document before making any decision about whether to acquire the security or product. The link to our Terms & Conditions has been provided please go through them and also have a read of the Financial Services Guide. On the date of publishing this report (mentioned on the website), employees and/or associates of Kalkine Pty Ltd do not hold positions in any of the stocks covered on the website. These stocks can change any time and readers of the reports should not consider these stocks as personalised advice.
 Please wait processing your request...