Kalkine has a fully transformed New Avatar.

Company Overview: Service Stream Limited happens to be a public company which is listed on ASX (or Australian Securities Exchange) (ASX: SSM). It is a provider of essential network services to telecommunications and utility sectors. SSM operates throughout all the states and territories, and it has a workforce of more than 2,200 employees and access to the pool of more than 3,000 specialist contractors..png)
SSM Details
.png)
Decent Results for 1H FY 2020: Service Stream Limited (ASX: SSM) is a leading essential network services company which has a market capitalisation of ~$770.14 million as on 12th March 2020. The company recently released its half-yearly report ended December 31, 2019, wherein it delivered strong growth across all the key profitability metrics against the prior corresponding period. The company posted EBITDA from operations amounting to $58.1 million on the revenue of $497.8 million, which implies a rise of 50% on pcp. This was helped by the adoption of the new AASB 16 Leases, and it reinforces the importance of the company’s continued focus on business-basics of safety, service delivery, operating disciplines and sound financial management.
The company delivered adjusted NPAT amounting to $32.3 million, which was up 28% on YoY basis while its adjusted EPS amounted to 7.96 cents, reflecting an increase of 14% on pcp. The performance from each of the company’s business units was largely in line with the anticipation. The period also witnessed continued focus towards the integration of recently acquired Comdain Infrastructure business, and continuation of the structured and disciplined approach to evaluating the opportunities for expansion, which includes potential acquisitions. The company managed to generate $32.8 million of operating cashflow before interest and tax for 1H FY 2020 as compared to $26.4 million in pcp. Its EBITDA to operating cashflow before interest & tax (OCFBIT) conversion ratio stood at 58%, which was in line with the expectation of management. SSM’s operating cashflow amounted to $10.2 million, after the net financing costs of $2.0 million and tax payments, which were $20.6 million. Considering the robust cashflow performance and consistent with its conservative approach to leverage, SSM declared increased interim dividend (fully-franked) amounting to 4.0 cents per share. Notably, this dividend is payable on March 19, 2020.
Considering the decent fundamentals, long-term growth opportunity and decent dividend policy, we have valued the stock using a relative valuation method, i.e., EV/EBITDA multiple and 5-year average P/E market multiple of 12.10x to FY20 consensus EPS of $0.159 and arrived at a target price of lower double-digit growth (in percentage terms). At CMP of $1.720, the stock of the company is trading at P/E multiple ~10.82x of FY20E EPS..png)
Key Financial Highlights (Source: Company Reports, *Dividend Payout Ratio (Based on Statutory EPS)
Top 10 Shareholders: The following table provides a broader overview of the top 10 shareholders in Service Stream Limited:.png)
Top 10 Shareholders (Source: Thomson Reuters)
Overview of Key Margins: The company’s gross margins stood at 94.1% in 1H FY 2020, which is higher than the industry median of 12.5%. During the same period, it posted a net margin of 5.5% and industry figure stood at 3.1% and, therefore, it can be said that SSM is possessing better capabilities to convert its top-line into the bottom-line as compared to the broader industry. SSM’s RoE stood at 8.8% which is higher than the industry median of 4.5% and, thus, it looks like the company has delivered better returns to its shareholders as compared to the broader industry. There are expectations that better capabilities to convert its top-line into the bottom-line and decent RoE position might attract the attention of the market participants moving forward.
The company’s current ratio stood at 1.35x in 1H FY 2020, which is higher than the industry median of 1.12x and, therefore, it can be said that SSM is in a decent position to meet its short-term obligations when compared to the broader industry. Its Debt/Equity ratio stood at 0.30x, which is lower than the industry median figure of 0.59x. Generally, lower debt on the balance sheet is considered positive as it helps the company in focusing on its long-term growth objectives.
.png)
Key Metrics (Source: Thomson Reuters)
Appointment of New Chief Financial Officer: SSM has made an announcement about the appointment of Ms. Linda Kow to the post of Chief Financial Officer. She would be joining the company in the month of May 2020, replacing Mr. Bob Grant. Ms. Linda is possessing extensive finance and commercial career, and she has a diverse background of experience throughout listed and privately-owned companies.
Analysing Performance of Telecommunications and Utilities Business: The company’s reportable segments posted improved performance for 1H FY 2020. SSM’s Telecommunications business made the EBITDA contribution amounting to $45.3 million on the revenue of $297.9 million. The revenue of this business was marginally lower as compared to pcp by $0.2 million and increased revenue from higher nbn OMMA activation, and service assurance volumes as well as favourable technology mix was compensated by the lesser revenue from lower wireless volumes and wind-up of nbn MIMA & DCMA programs.
The utilities business of the company has made an EBITDA contribution amounting to $15.5 million on the revenue of $199.2 million. The revenue of this business was higher as compared to pcp by $147.8 million mainly because of the inclusion of revenue from Comdain Infrastructure after its acquisition in the month of January 2019..png)
Segment Results (Source: Company Reports)
Rise in Dividend Pay-Out Ratio in 1H FY 2020 on YoY Basis: The Board of SSM managed to declare an interim dividend amounting to 4.0 cents per share (fully-franked) for the half-year as compared to 3.5 cps (fully-franked) in pcp. The dividend was having an ex-dividend date of 4th March 2020 and record date of 5th March 2020. The company has increased the dividends declared from 1H FY 2015 to 1H FY 2020 from 0.50 cents per share to 4 cents per share as can be seen from the below picture:.png)
Dividends Declared (Source: Thomson Reuters)
Moreover, the company posted the dividend-payout ratio (based on statutory EPS) of 59% in 1H FY 2020, which reflects an increase from 1H FY 2019 figure of 52%.
What to Expect from SSM Moving Forward: With respect to Comdain Infrastructure integration, the company stated that the integration program has been progressing well under the direction of Integration Steering Committee and small integration team. The focus during the recent 6 months was towards the identification of the organisational alignment and physical co-location opportunities. The company stated that the replacement of Comdain Infrastructure’s systems with SSM’s core ERP system happens to be on-track for go-live at FY 2020 end. Moreover, strategies are being developed in order to target new business opportunities throughout the expanded geographies in 2H FY 2020.
For FY 2020, the company is expecting EBITDA from operations for 2H FY 2020 to be in line with the figure which was reported in 1H FY 2020. SSM is anticipating the stronger revenue contribution in 2H FY 2020 from Wireless, Comdain Infrastructure and nbn maintenance activities because of increased customer volumes. However, at the same time, SSM expects negligible revenue contribution in 2H FY 2020 from nbn D&C operations as MIMA & DCMA programs conclude..png)
Key Valuation Metrics (Source: Thomson Reuters)
Valuation Methodologies:
Method 1: EV to EBITDA Based Relative Valuation.png)
EV to EBITDA Based Relative Valuation (Source: Thomson Reuters)
Method 2:Price to Earnings Market Multiple Approach.png)
Price to Earnings Market Multiple Based Approach (Source: Thomson Reuters)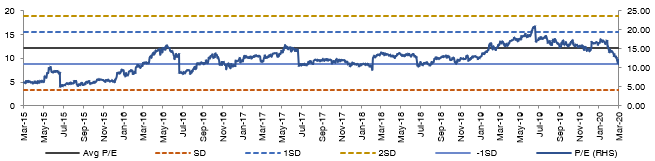
Historical Price Band (Source: Thomson Reuters)
Stock Recommendation: The company’s top-line has witnessed a CAGR of 19.99% between FY 2015- FY 2019 and, therefore, it can be said that SSM is possessing decent capabilities to garner revenues which could help the broader company in further strengthening its financial footing. Between the same time span, its net income has witnessed a CAGR of 43.71%. The company witnessed a growth of 14% on the YoY basis in dividends declared in 1H FY 2020, which could attract the attention of market players moving forward. Considering the decent fundamentals, long-term growth opportunity and decent dividend policy, we have valued the stock using a relative valuation method, i.e., EV/EBITDA multiple and 5-year average P/E market multiple of 12.10x to FY20 consensus EPS of $0.159 and arrived at a target price of lower double-digit growth (in percentage terms). Thus, we give a “Buy” rating on the stock at the current market price of A$1.720 per share, down by 8.995% on March 12, 2020.
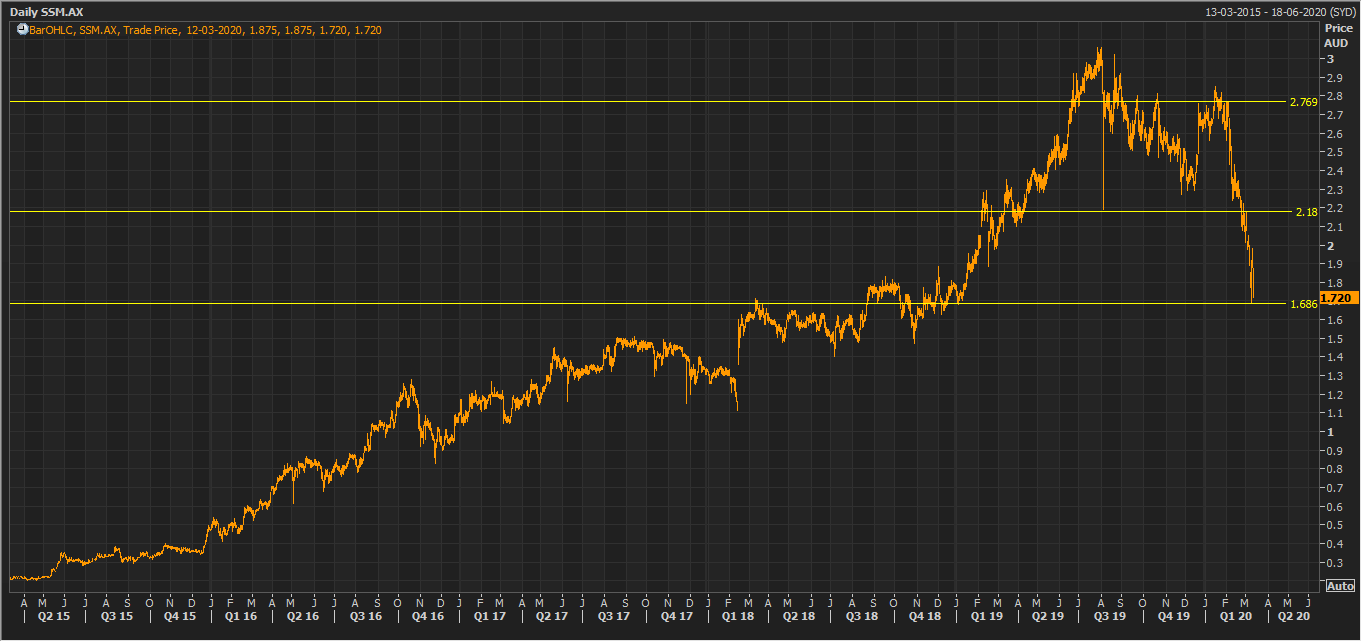
SSM Daily Technical Chart (Source: Thomson Reuters)
Disclaimer
The advice given by Kalkine Pty Ltd and provided on this website is general information only and it does not take into account your investment objectives, financial situation or needs. You should therefore consider whether the advice is appropriate to your investment objectives, financial situation and needs before acting upon it. You should seek advice from a financial adviser, stockbroker or other professional (including taxation and legal advice) as necessary before acting on any advice. Not all investments are appropriate for all people. Kalkine.com.au and associated pages are published by Kalkine Pty Ltd ABN 34 154 808 312 (Australian Financial Services License Number 425376). The information on this website has been prepared from a wide variety of sources, which Kalkine Pty Ltd, to the best of its knowledge and belief, considers accurate. You should make your own enquiries about any investments and we strongly suggest you seek advice before acting upon any recommendation. Kalkine Pty Ltd has made every effort to ensure the reliability of information contained in its newsletters and websites. All information represents our views at the date of publication and may change without notice. To the extent permitted by law, Kalkine Pty Ltd excludes all liability for any loss or damage arising from the use of this website and any information published (including any indirect or consequential loss, any data loss or data corruption). If the law prohibits this exclusion, Kalkine Pty Ltd hereby limits its liability, to the extent permitted by law to the resupply of services. There may be a product disclosure statement or other offer document for the securities and financial products we write about in Kalkine Reports. You should obtain a copy of the product disclosure statement or offer document before making any decision about whether to acquire the security or product. The link to our Terms & Conditions has been provided please go through them and also have a read of the Financial Services Guide. On the date of publishing this report (mentioned on the website), employees and/or associates of Kalkine Pty Ltd do not hold positions in any of the stocks covered on the website. These stocks can change any time and readers of the reports should not consider these stocks as personalised advice.
 Please wait processing your request...