Company Overview: RMA Global Limited (ASX: RMY), listed on ASX in 2018, is an online real estate review, ratings and statistics provider. It works through three segments: Australia, the United States of America and New Zealand. The subscription revenue comes from monthly fees paid by agents and agencies for digital marketing products and services (includes mortgage brokers). On the contrary, promoter product allows the agents to promote themselves on search engines and social media platforms like Google, Facebook and Instagram.
.png)
RMY Details


Focus on New Market Entrance to Support Topline Growth: The Company uses a consistent approach to enter any geography or market, to grow the customer base and revenue generation. The fundamental approach applied at Australia market is replicated at the US market, which in turn is delivering good uptake and engagement.
1HFY22 Financial Highlights:
On a quarterly average, 10,500 agents (1H FY21: 9,300 – up 13%) collected 141,000 reviews in 1HFY21, while 1,740 agents (1H FY21: 870 – up 100%) collected 14,500 reviews in 1HFY22 in Australia and NZ, respectively.
- Improved Losses in 1HFY22: RMY reduced its net losses after tax from ~$4.17 million in 1HFY21 to ~$3.76 million in 1HFY22.
- Cash Position: With ~$3.77 million cash receipts from customers for 2QFY22, it closed its half-yearly accounts with the cash balance at the end of 31st December 2021 as ~$7.15 million versus ~$10.70 million at the end of 30th June 2021.
.png)
.png)
(Source: Analysis by Kalkine Group)
Top 10 Shareholders:
The top 10 shareholders together form around 77.54% of the total shareholding, while the top 4 constitute the maximum holding. Williams (David) and Armstrong (Mark) are holding a maximum stake in the company at 30.40% and 11.77%, respectively, as also highlighted in the chart below:
.png)
Top 10 Shareholders (Source: Analysis by Kalkine Group)
Key Metrics: RMY has higher Gross Margins as ~81.6% for 1HFY22 which is greater than industry median of ~53.9%. While on the other side, its debt-to-equity ratio also increased to ~0.43x in 1HFY22.
.png)
Profitability & Debt Profile (Source: Analysis by Kalkine Group)
Key Risks:
- Regulatory Risk: The company is exposed to a more complex regulatory environment; any failure in the same could lead the business to fines, penalties, etc.
- COVID-19: Travel restrictions and lockdowns due to COVID-19 might hold down its operations and thereby affecting its earnings, cash flow and financial position.
- Technology Risk: The business is quite dependent on the technology it applies, and hence, failure of regular upgradation and improvement might affect the shift in the usage and customer retention.
- Expansion Risk: As the company works in different geographical areas, it brings lots of challenges like different demands, currency fluctuations and regulatory differences.
Outlook: The company is expected to be cash flow positive on a monthly basis in FY22 through monetizing agents, including reviews, key MLS and brokerage networks in all the markets. The Launch of US 2022 Awards in January 2022 drives competition and review collection, and the company is focused on adding value to the paid subscriptions. The company would continue to build out its platform and products to offer greater value to agents with a key focus on revenue growth.
Valuation Methodology: EV/Revenue Multiple Based Relative Valuation (Illustrative)
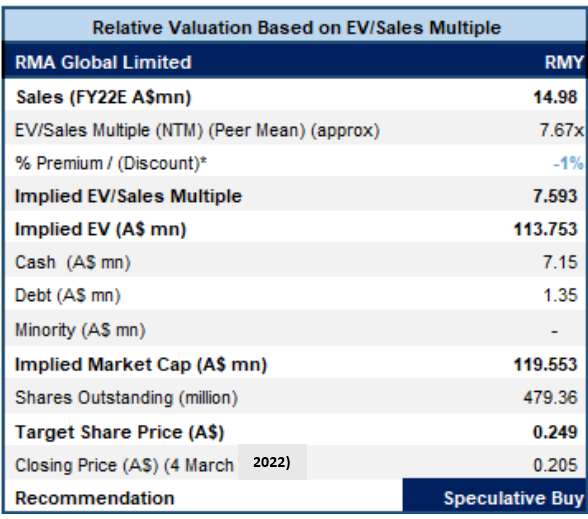
Source: Analysis by Kalkine Group
*% Premium/(Discount) is based on our assessment of the company’s NTM trading multiple after considering its key growth drivers, economic moat, stock's historical trading multiples versus peer average/median, and investment risks.
Stock Recommendation: As per ASX, the stock of RMY is trading slightly lower its 52-weeks’ average levels of $0.160 - $0.340. The stock gave a positive return of ~17.14% in the past three months and a negative return of ~6.82% in the past one month, proffering a decent opportunity for accumulation. The stock has been valued using EV/Revenue multiple-based illustrative relative valuation method and arrived at a target price of low double-digit (in percentage terms). The company might trade at some discount to its peers’ average multiple, because of negative ROE, increasing costs, constraints to be faced in global expansion, and headwinds related to the changing environment the business works in. For the purpose of valuation, few peers like Hipages Group Holdings Ltd (ASX: HPG), Domain Holdings Australia Ltd (ASX: DHG), Seek Ltd (ASX: SEK), and others have been considered. Considering the expected rise in recurring revenue, growing numbers of active agents in ANZ and US market, the upside potential in valuation, current trading levels, investment in technology for regular upgradation and better interface, optimistic long-term outlook, and the key risks associated with the business, we recommend a ‘Speculative Buy’ rating on the stock at the closing market price of $0.205, down by ~2.381%, as on 4th March 2022. Markets are trading in a highly volatile zone currently due to certain macro-economic issues and geopolitical tensions prevailing. Therefore, it is prudent to follow a cautious approach while investing.
.png)
.png)
RMY Daily Technical Chart, Data Source: REFINITIV
Note 1: The reference data in this report has been partly sourced from REFINITIV
Note 2: Investment decisions should be made depending on the investors’ appetite on upside potential, risks, holding duration, and any previous holdings. Investors can consider exiting from the stock if the Target Price mentioned as per the analysis has been achieved and subject to the factors discussed above alongside support levels provided.
Technical Indicators Defined: -
Support: A level where-in the stock prices tend to find support if they are falling, and downtrend may take a pause backed by demand or buying interest.
Resistance: A level where-in the stock prices tend to find resistance when they are rising, and uptrend may take a pause due to profit booking or selling interest.
Stop-loss: It is a level to protect further losses in case of unfavourable movement in the stock prices.
Disclaimer - This report has been issued by Kalkine Pty Limited (ABN 34 154 808 312) (Australian financial services licence number 425376) (“Kalkine”) and prepared by Kalkine and its related bodies corporate authorised to provide general financial product advice. Kalkine.com.au and associated pages are published by Kalkine.
Any advice provided in this report is general advice only and does not take into account your objectives, financial situation or needs. You should therefore consider whether the advice is appropriate to your objectives, financial situation and needs before acting upon it.
There may be a Product Disclosure Statement, Information Statement or other offer document for the securities or other financial products referred to in Kalkine reports. You should obtain a copy of the relevant Product Disclosure Statement, Information Statement or offer document and consider the statement or document before making any decision about whether to acquire the security or product.
You should also seek advice from a financial adviser, stockbroker or other professional (including taxation and legal advice) as necessary before acting on any advice in this report or on the Kalkine website. Not all investments are appropriate for all people.
The information in this report and on the Kalkine website has been prepared from a wide variety of sources, which Kalkine, to the best of its knowledge and belief, considers accurate. Kalkine has made every effort to ensure the reliability of information contained in its reports, newsletters and websites. All information represents our views at the date of publication and may change without notice.
Kalkine does not guarantee the performance of, or returns on, any investment. To the extent permitted by law, Kalkine excludes all liability for any loss or damage arising from the use of this report, the Kalkine website and any information published on the Kalkine website (including any indirect or consequential loss, any data loss or data corruption). If the law prohibits this exclusion, Kalkine hereby limits its liability, to the extent permitted by law, to the resupply of services.
Please also read our Terms & Conditions and Financial Services Guide for further information.
On the date of publishing this report (referred to on the Kalkine website), employees and/or associates of Kalkine and its related entities do not hold interests in any of the securities or other financial products covered on the Kalkine website unless those persons comply with certain safeguards, procedures, and disclosures.
Kalkine Media Pty Ltd, an affiliate of Kalkine Pty Ltd, may have received, or be entitled to receive, financial consideration in connection with providing information about certain entity(s) covered on its website.
Past performance is not a reliable indicator of future performance.
 AU
AU
 Please wait processing your request...