
Company Overview: Reliance Worldwide Corporation Limited is an Australia-based company that designs, manufactures and supplies water flow and control products and solutions for use in behind the wall plumbing. The Company manufactures brass push-to-connect plumbing fittings. Its products include fittings and pipe, control valves, thermostatic products, and other products. Fittings and pipe includes plumbing fittings, piping and related products for the installation and repair of water reticulation systems. Control valves includes temperature and pressure relief valves for domestic and commercial storage hot water systems, non-return isolating valves, backflow prevention devices and specialist water safety valves. Thermostatic products include thermostatic mixing valves, tempering valves and thermostatic cartridges. Other products includes under floor heating components and kit systems, water meters, water mains connection fittings and repair sleeves and fire safety system products.
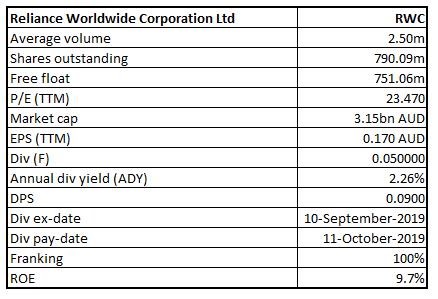
RWC Details
Decent Performance in FY19: Reliance Worldwide Corporation Limited (ASX: RWC) is a mid-cap industrial company with the market capitalisation of circa $3.15 Bn as of 30 September 2019. The principal activities of the company are the design, manufacture and supply of high quality, reliable and premium branded water flow, control and monitoring products and solutions for the plumbing and heating industry. Recently, the company released its results for the year ended June 30, 2019 in which its net sales amounted to $1,104.0 million, which reflects a rise of 43.5% on a YoY basis. During the same period, the company’s reported EBITDA amounted to $242.5 million, which implies an increase of 79.1% as compared to the previous year. These increases reflect the first full-year contribution from the John Guest. The company’s Managing Director, Heath Sharp reflected favourable views with respect to FY19 results and stated that there has been a record year for RWC when it comes to revenues and earnings. The growth was mainly because of the inclusion of John Guest for the full year and robust underlying growth which it recorded in Americas. It was added that John Guest acquisition was highly accretive, and the adjusted earnings per share rose by 23% on a YoY basis. The company has been able to increase its total dividends declared to 9 cents per share, which reflects a rise of 38%. The key achievement was the successful integration of John Guest with the RWC’s operations. The company has realised synergies in the year amounting to $14.2 million, ahead of $10 million targets and the company is expecting synergies to exceed $30 million per annum on a run rate basis by FY20 end. The company’s core RWC net sales (excluding John Guest) amounted to $782.9 million, which reflects a rise of 5.1% on YoY basis because of 8.6% growth in net sales in Americas segment. The net sales of John Guest products stood at $321.1 million, a rise of 8.2% on the prior year.
The operating cash flow generation, successful commercialisation of the key innovation/new product projects, and realisation of John Guest related synergies are key management priorities for FY20. Additionally, there are expectations that sound operational capabilities might act as a primary tailwind for long-term growth.
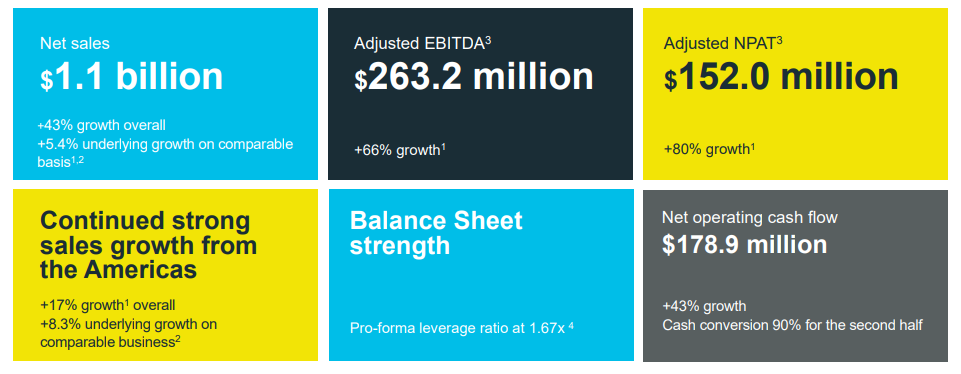
FY19 Financial Highlights (Source: Company Reports)
Improvement in Key Margins: The company’s net margin stood at 12% in FY19, which reflects a rise from FY18 figure of 8.8% and, thus, it can be said that the company’s capabilities to convert its top-line into the bottom-line have been improved. Notably, the company’s EBITDA margin stood at 22%, which is higher than the industry median figure of 17.6%. RWC’s RoE stood at 9.7% in FY19, which is higher than the FY18 figure of 8.8% and, therefore, it reflects that the company has delivered better returns to its shareholders which can help it in gaining the attention of the market participants. The company’s Debt/Equity ratio stood at 0.35x in FY19 as compared to 0.50x in FY18 and, therefore, it can be said that the company has deleveraged its balance sheet as compared to FY18. Generally, a deleveraged balance sheet is generally considered positive for the company as it reduces the long-term commitments. The percentage long-term debt to total capital stood at 26.1% in FY19, which is lower than the prior year figure of 33.2% and, therefore, it can be said that RWC has reduced its exposure towards the long-term debt component.
(17).png)
Key Metrics (Source: Thomson Reuters)
Top 10 Shareholders: The following table provides a brief overview of the top 10 shareholders in RWC:
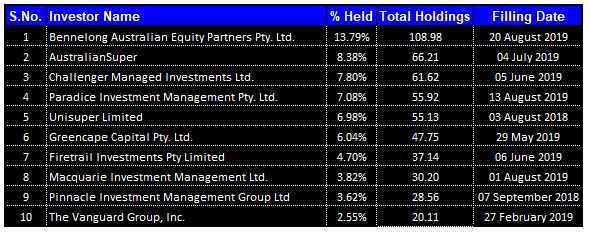
Top 10 Shareholders (Source: Thomson Reuters)
Enhancing shareholder returns: RWC has released an investor presentation in which it stated that the company is focused on enhancing the shareholder returns via sustainable and responsible practices. The company has also mentioned about the strategic priorities which revolve around enabling the specific initiatives to accelerate, expand as well as access and its growth plan focuses towards using the key levers throughout organization in order to drive the sustainable and impactful growth. Coming to the strategic priorities, the company plans to achieve profitable growth in the core, repair and maintenance markets in North America, UK and Australia and growing into adjacent plumbing, heating as well as Fluid Technology end markets. It also plans to enter the selected European, South American, and the Asian geographies. The company added that while PTC fittings happen to be a large part of its business, they are having growing, diverse range of the related solutions transforming productivity and the efficiency for end-users. The following picture provides an overview of the FY19 gross revenues by category:
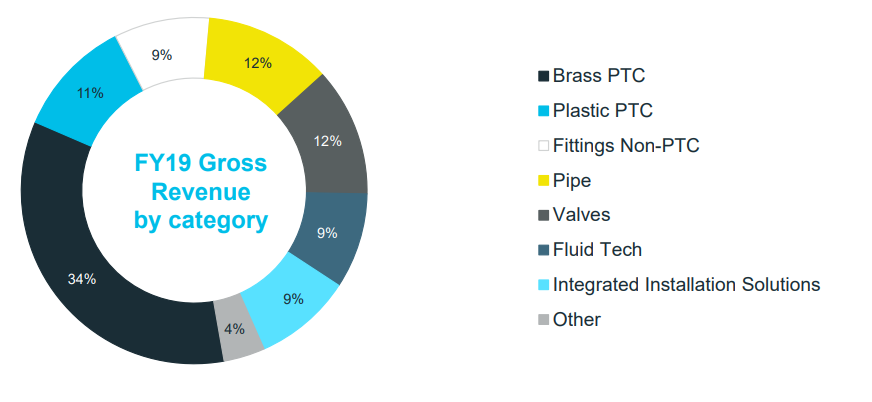
Revenue by Category (Source: Company Reports)
Focusing Towards Revenue and Earnings Growth: Currently, the company has strong core businesses in 2 most important sales markets of the USA and UK. It was added that SharkBite’s market strength, scale and the value proposition give long runway of above the market growth and distribution base can be leveraged for the volume growth from the new product development and acquisitions.
Understanding RWC’s Cash Flow Generation: The company’s cash flow from operations generated amounted to $178.9 million in FY19, which reflects an increase of 43% on a YoY basis and the cash flow conversion was 90% in 2H and 74% for a full year. RWC has a robust balance sheet which can help the overall company in achieving long-term growth objectives. The company’s pro forma net leverage stood at 1.67x as at June 30, 2019, and the following picture provides a broader overview of the balance sheet strength:
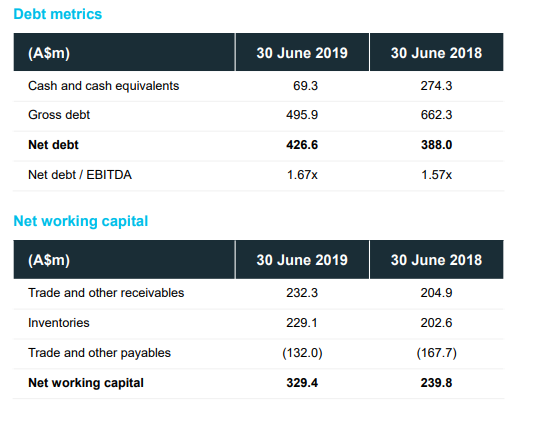
Balance Sheet Strength (Source: Company Reports)
The company has higher working capital as compared to June 30, 2018, in order to support the growing business. The increase in trade receivable reflects expiry of the one-off payment term incentives. Net debt figure as at June 30, 2019 amounted to $426.6 million as compared to June 30, 2018 figure of $388.0 million. The dollar increases over June 30, 2018 mainly implies net additional borrowings to finance the growth in business activities, including capital expenditure and the working capital changes.
What to Expect from RWC Moving Forward: With respect to the FY20 outlook, the company stated that it is expecting to achieve the sales growth above the broader markets in which the company operates. Coming to the outlook for FY20 Americas region, there are expectations of the positive conditions and modest growth in the residential new construction and continued growth in remodel activity. In the Asia Pacific region, the Australian new housing construction is anticipated to continue at the lower levels than in recent years with the risk of further decline.
In EMEA (Europe, Middle East and Africa), the Brexit uncertainty clouds short-term outlook for the UK and there were softer trading conditions at FY19 end, and these have continued in the first 2 months of FY20. The opportunities to lower the operating and manufacturing costs in order to ensure that the company remains cost-competitive would be an area of focus in FY20. It was further stated that realised margin expansion in FY20 would be partly offset by the deployment towards new product development as well as commercialisation.
The company is expecting its FY20 NPAT in the range of $150 million-$165 million, and this corresponds to the EBITDA range of $280 million-$305 million, inclusive of AASB16 effect. This depicts a growth on year on year basis between 12.78% to 24.06% in NPAT. It was added that the performance within this range would be contingent on several factors like no material deterioration in economic activity levels, stable input costs (average copper costs anticipated to be no higher than US$6,200 per tonne over a full year and no further increase in the tariffs or import duties in the USA. However, delivery of John Guest synergies and no significant changes to the foreign exchange rates are some of the other factors.
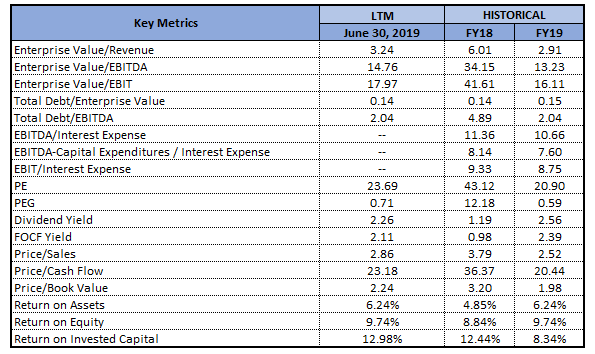
Key Valuation Metrics (Source: Thomson Reuters)
Valuation Methodologies-
Method 1: Price to Earnings Multiple Approach:
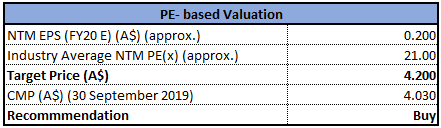
P/E Multiple Valuation (Source: Thomson Reuters)
Method 2: Price to Cash Flow Multiple Approach:
.png)
P/CF Multiple Valuation (Source: Thomson Reuters)
Note: All forecasted figures and peers have been taken from Thomson Reuters, *NTM-Next Twelve Months
Stock Recommendation: The company’s stock price has delivered the return of 14.33% in the span of previous one month, while in the time frame of past three months, the stock’s return stood at 13.68%. The company’s top line has witnessed a CAGR growth of 25.03% in the time frame of FY15- FY19, which reflects that the company is possessing decent capabilities to generate revenues. Also, between the same time frame, there has been a CAGR growth of 32.39% in the company’s net income.
Between the FY15- FY19, the company’s cash receipts and cash from operating activities have witnessed the CAGR growth of 20.54% and 26.21%, respectively. There are expectations that decent capabilities to generate revenues and build cash levels might support in achieving the long-term growth. The key management priorities for FY20 includes delivery of decent top-line growth in all key geographies, margin expansion with the help of continuous improvement initiatives and effective management of the key externalities (like Brexit, tariffs), prudent capital allocation and focus on reducing working capital. Based on the foregoing, we have valued the stock using two relative valuation methods, i.e., Price to Earnings and Price to Cash Flow multiples and arrived at the target price of single-digit growth (in percentage term). Hence, we recommend a “Buy” rating on the stock at the current market price of $4.03, up 1.003% on 30 September 2019.
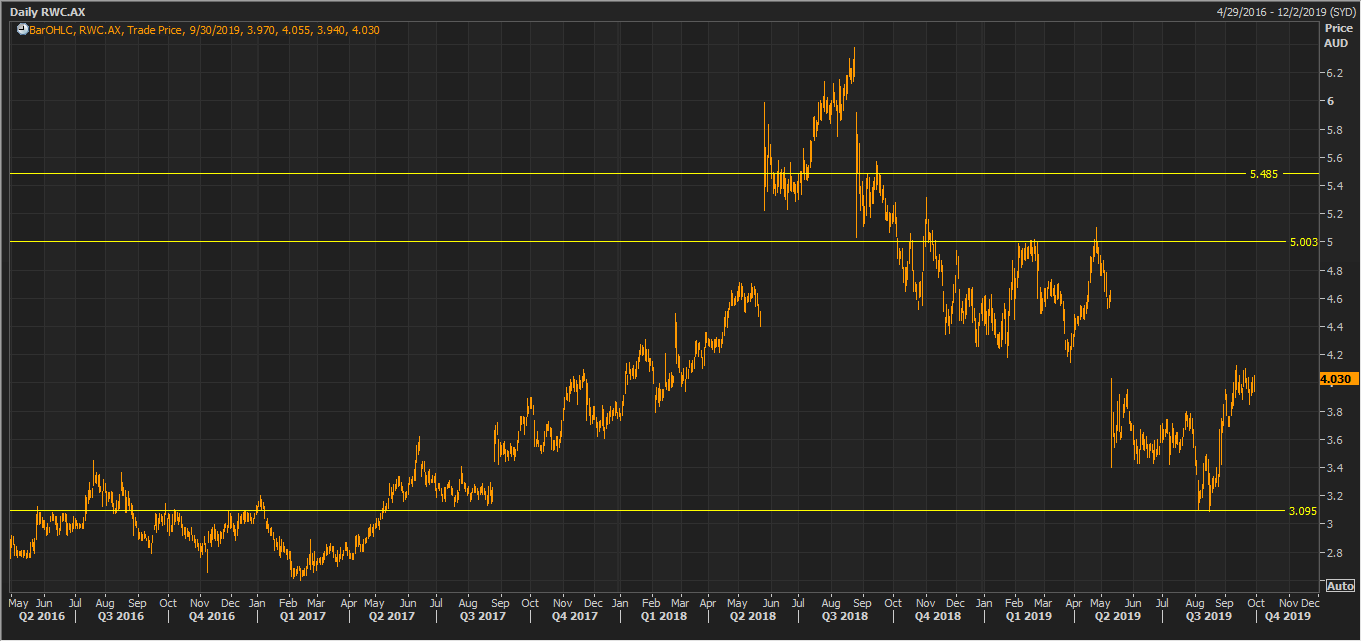
RWC Daily Technical Chart (Source: Thomson Reuters)
Disclaimer
The advice given by Kalkine Pty Ltd and provided on this website is general information only and it does not take into account your investment objectives, financial situation or needs. You should therefore consider whether the advice is appropriate to your investment objectives, financial situation and needs before acting upon it. You should seek advice from a financial adviser, stockbroker or other professional (including taxation and legal advice) as necessary before acting on any advice. Not all investments are appropriate for all people. Kalkine.com.au and associated pages are published by Kalkine Pty Ltd ABN 34 154 808 312 (Australian Financial Services License Number 425376). The information on this website has been prepared from a wide variety of sources, which Kalkine Pty Ltd, to the best of its knowledge and belief, considers accurate. You should make your own enquiries about any investments and we strongly suggest you seek advice before acting upon any recommendation. Kalkine Pty Ltd has made every effort to ensure the reliability of information contained in its newsletters and websites. All information represents our views at the date of publication and may change without notice. To the extent permitted by law, Kalkine Pty Ltd excludes all liability for any loss or damage arising from the use of this website and any information published (including any indirect or consequential loss, any data loss or data corruption). If the law prohibits this exclusion, Kalkine Pty Ltd hereby limits its liability, to the extent permitted by law to the resupply of services. There may be a product disclosure statement or other offer document for the securities and financial products we write about in Kalkine Reports. You should obtain a copy of the product disclosure statement or offer document before making any decision about whether to acquire the security or product. The link to our Terms & Conditions has been provided please go through them and also have a read of the Financial Services Guide. On the date of publishing this report (mentioned on the website), employees and/or associates of Kalkine Pty Ltd do not hold positions in any of the stocks covered on the website. These stocks can change any time and readers of the reports should not consider these stocks as personalised advice.
Past performance is not a reliable indicator of future performance.
 Please wait processing your request...