
Company Overview: ReadyTech Holdings Limited is an Australia-based company, which is focused on developing education software. Its segments include Education segment and Employment segment. It offers a range of products for Education, such as JR Plus, VETtrak, A2E and My Profiling. Its products for Employment includes HR3, Aussiepay and ePayroll. Its products for Pathways includes JR Live, JR Active, JR Gov and Esher House. JR Live platform for job active and DES programs enabling caseworkers to match job seekers with vacancies, manage work placements, provide post-placement support (PPS) and track job outcomes. JR Active platform is integrated with Government systems and helps support career advice, administer training contracts and incentives to employers, monitor apprentices and provide business intelligence tools to inform decision making. VETtrak software offers short message service (SMS) for small to medium-sized private VET providers.
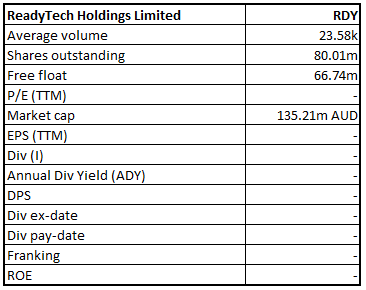
RDY Details
Growth Across Key Business Segments: ReadyTech Holdings Limited (ASX: RDY) is a leading software as a service (SaaS) provider of mission-critical people management systems to Australian educational institutions and employers. The company operates in two segments, namely Education and Employment. Core products under the education segment include cloud-based student management systems. In addition, the company also provides platforms for managing vocational education and training programs. The employment segments include provision of payroll software and outsources payroll services & human resource management software solutions to employers. In FY18, the education segment contributed 61% of the total group revenue and 58% of EBITDA before corporate costs. Majority of the revenue for this segment is derived from student management systems. Employment segment comprised of 39% of the revenue during the year and 42% of EBITDA before corporate costs. The company has two major sources of revenue including, Subscription and license revenues and implementation, training and other revenues, that comprised 88% and 12% of FY18 revenue, respectively. The total annual contract value of new business wins grew by more than 50% from FY17 to FY18. From FY16 to FY18, the company witnessed a 25% increase in average revenue per client (ARPC), which was partially driven by the company’s new business wins.
Going forward, the company is targeting growth through winning new and higher value customers and driving greater spend per customer with additional products and value-added services. The company’s revenue and profits exceeded the prospectus forecasts in FY19. The company is now looking forward to drive revenue growth with a solid new business pipeline for both of its business segments.
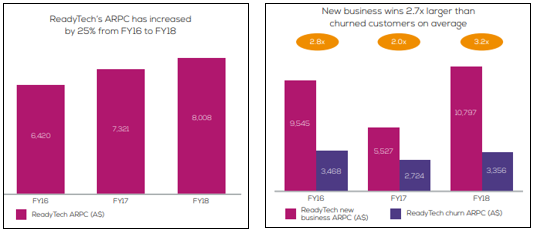
ARPC (Source: Company Reports)
Over the period covering FY16 to FY19, the company has reported continued growth in subscription and license revenue, with FY19 revenue growing at a rate of 90%. Subscription and license revenue for FY16 and FY19 stood at $20.1 million and $29.7 million, respectively. Over the same period, the company also saw continued growth in EBITDA and has built a strong EBITDA margin supported by its scalable platform. FY16 & FY19 EBITDA stood at $6.1 million and $12.8 million, respectively.
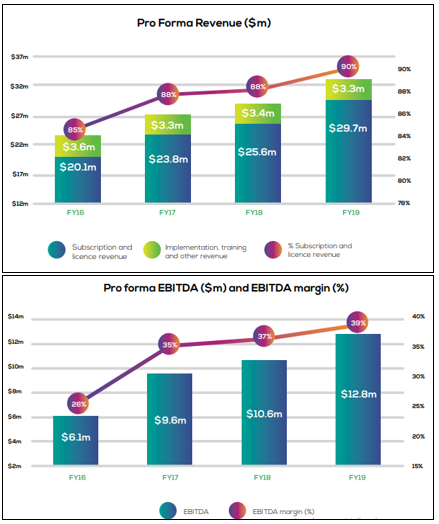
Pro Forma Revenue, EBITDA & EBITDA margin (Source: Company Reports)
FY19 Financial Highlights: During the year ended 30 June 2019, the company reported pro forma revenue amounting to $33.0 million, representing an increase of 13.5% on prior corresponding period. Pro forma EBITDA for the year stood at $12.8 million, increasing 20.8% on prior corresponding year. Average revenue per client for FY19 was reported at $8.9k, showing a growth of 12% on ARPC against the prior year. Subscription and license revenue represented 90% of the total revenue, up from 88% in the previous year. During the year, the company reported a statutory net loss after tax amounting to $1.5 million, that included costs related to IPO.
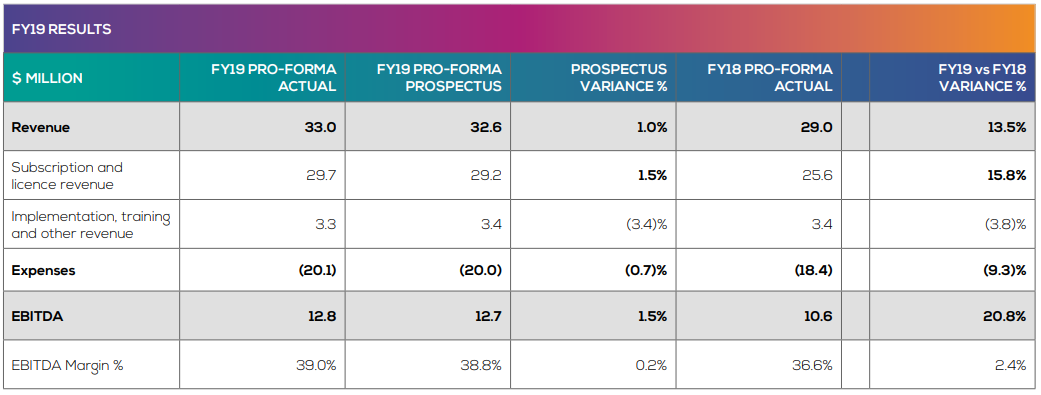
FY19 Results (Source: Company Reports)
Education Segment Results: Revenue from the education segment was reported at $20.0 million, increasing 12.0% in comparison to prior corresponding period. Revenue growth was backed by strong client wins and greater per client spend with existing customers. EBITDA from the segment was reported at $8.1 million, as compared to EBITDA of $7.1 million in the prior year. EBITDA margin for the segment improved from 40% in FY18 to 41% in FY19.
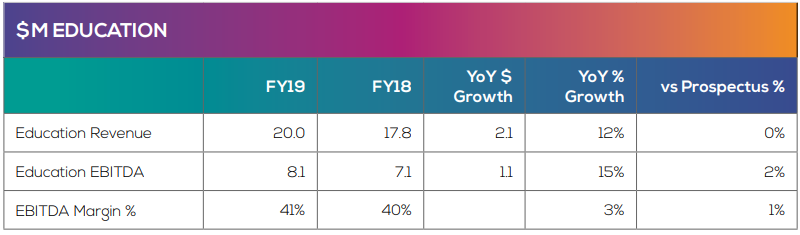
Education Segment Results (Source: Company Reports)
Employment Segment Results: This segment contributed revenue amounting to $13.0 million, up 15% on prior corresponding year, supported by strong new client growth over the course of the year. Employment segment EBITDA was reported at $6.2 million, as compared to $5.1 million in the prior corresponding year. This segment also witnessed an improvement in the EBITDA margin from 45% in FY18 to 48% in FY19.
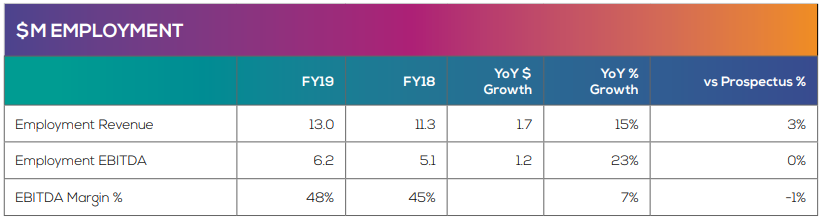
Employment Segment Results (Source: Company Reports)
Key Achievements in FY19:
(a) Client Growth: During the year, the company recorded over 400 client wins with strong progress in higher education sector and enterprise strategy demonstrating the success of dual-brand strategy.
(b) Growth in ARPC: The company witnessed 12% YoY growth in average revenue per client through additional modules and increase in user subscriptions. Growth in ARPC was also supported by cross sell value added services of My Profiling and Esher House.
(c) Investment in Research & Development: The company invested an amount of over $10 million for product improvements and new modules & customer value. New customer value in the education segment included enhanced dashboards, student services, online enrolment and student engagement tools. Development in the employment segment comprised of early compliance with Single Touch Payroll and introduction of new modules such as mobile app, Financial Controller portal and onboarding.
(d) Customer Success: During the year, the company maintained strong net client revenue retention of 96% and increased headcount investment in the customer success function, that resulted in strong customer satisfaction scores.
(e) Partner Network: With the increase footprint of its partner network, the company will attract new customer referrals. Moreover, the company also launched the ePayroll partner network to support customer growth through accountant and bookkeeper networks.
Growth Strategy: The company’s growth strategy is centred around winning new and higher value customers and drive greater spend per customer with additional products and value-added services. On the back of the above growth initiatives, the company is targeting a revenue increase of 14.4% in CY19 as compared to CY18. The company is increasing its focus on penetrating higher value customers as suggested by recent large education wins, including the University of Queensland. Moreover, the company is also investing in its HR administration and talent management capabilities to attract larger, higher value employers.
Moving forward, the company enjoys strong prospects of growth across its business segments. RDY possesses a strong customer pipeline that will support future growth. Through its growth initiative in place, the company seems well-positioned to attract higher value customers and expand the lifetime value to existing customers.
Top 10 Shareholders: The top 10 shareholders have been highlighted in the table, which together form around 58.70% of the total shareholding. Pemba Capital Partners Pty Ltd holds the maximum interest in the company at 43.17%, followed by Washbourne (Marc) holding 5.01% of the shares.
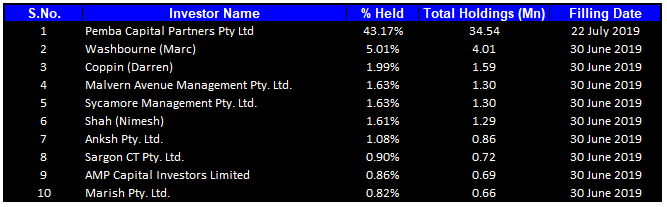
Top Ten Shareholders (Source: Thomson Reuters)
Key Metrics: During the six months ended 31 December 2018, the company has a gross margin of 91.5%, as compared to a gross margin of 88.1% in prior corresponding period and 90.6% for the six months ended 30 June 2018. EBITDA margin for the six months ended 31 December 2018 stood at 22.1%, as compared to 16.6% in the prior corresponding period.
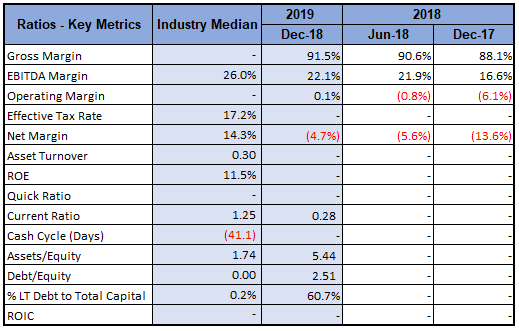
Key Metrics (Source: Thomson Reuters)
What to expect: The company is targeting a pro-forma revenue of $35.1 million for CY19, representing expected growth of 14% in comparison to CY18. Pro-forma EBITDA for the period is expected to be $14.6 million, with the growth of 28% in comparison to CY18. As per the recent financial results released by the company, the business has performed to forecast in the first 8 weeks of FY20 with a solid new business pipeline that will help to drive revenue growth for both Education and Employment segments.
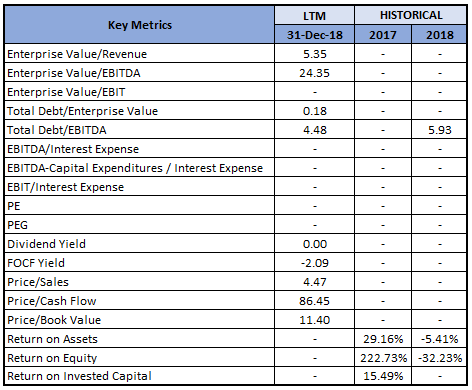
Key Valuation Metrics (Source: Thomson Reuters)
Valuation Methodologies:
Method 1: P/E Based Approach:
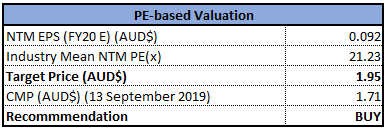
P/E Based Valuation(Source: Thomson Reuters)
Method 2: EV/Sales Multiple Approach:
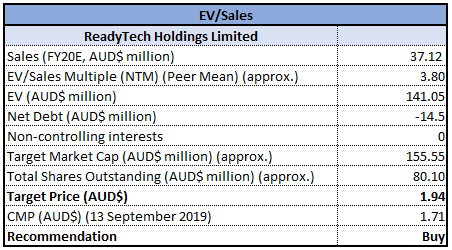
EV/Sales Multiple Approach (Source: Thomson Reuters)
Method 1: EV/EBITDA Multiple Approach:
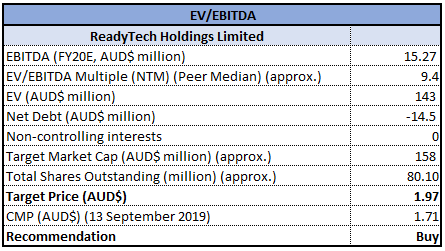
EV/EBITDA Multiple Valuation (Source: Thomson Reuters)
Stock Recommendation: The stock of the company generated returns of -3.15% and 2.42% over a period of 1 month and 3 months, respectively and has a market capitalisation of ~$135.21 million. During FY19, the company reported a strong set of financial results, exceeding the prospectus forecast. Revenue during the year exceeded the forecast by 1%, EBITDA by 1.5% and NPATA by 9.7%. During the year, operating cash flow conversion ratio stood at 98%. The company reported record new business volumes with over 400 client wins with average revenue per client growing at a rate of 12% in comparison to pcp. The year was highly cash generative with cashflow from operations increased by 40.4% to $12.5 million. In the Education segment, the company saw strong client growth with the average value of client wins being 3.6x greater than churned customers on average. Going forward, the company expects continued growth for the segment on the back of high value qualified leads, especially in pathways and higher education sectors. Growth in Employment segment was marked by an increase in existing client spend driven by employee growth and additional module uptake. Strategic alliances with partners and accounting firms during the year delivered new customer wins. Both segments witnessed an upward movement in revenue and EBITDA, that provided an uplift to the EBITDA margin. In the first 8 weeks of FY20, the company has performed in line with the expectations and is well-placed to drive future revenue growth for both its segments.
Considering the performance in FY19, growth trajectory of the business and a strong pipeline for further development, we have valued the stock using three relative valuation methods including, Price to Earnings multiple, EV/Sales multiple and EV/EBITDA multiple and have arrived at a target price of the stock in the range of $1.94 to $1.97 (lower double-digit growth (in %). Hence, we recommend a “Buy” rating on the stock at the current market price of $1.710, up 1.183% on 13 September 2019.
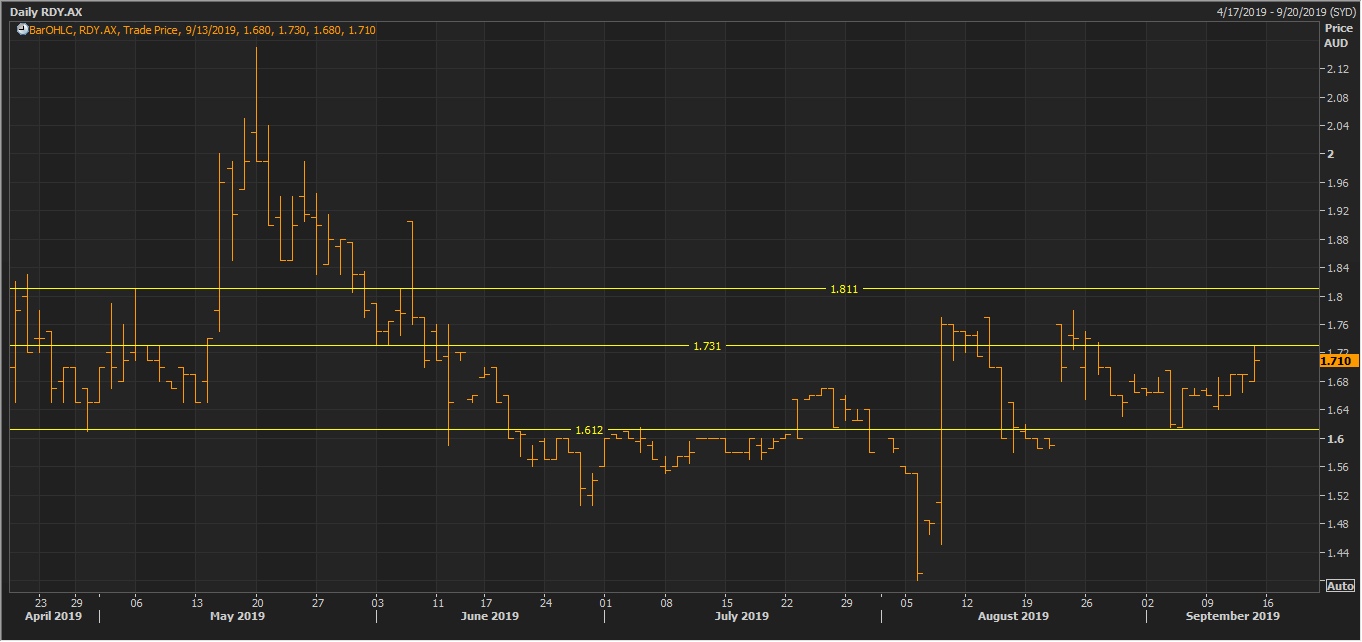
RDY Daily Technical Chart (Source: Thomson Reuters)
Disclaimer
The advice given by Kalkine Pty Ltd and provided on this website is general information only and it does not take into account your investment objectives, financial situation or needs. You should therefore consider whether the advice is appropriate to your investment objectives, financial situation and needs before acting upon it. You should seek advice from a financial adviser, stockbroker or other professional (including taxation and legal advice) as necessary before acting on any advice. Not all investments are appropriate for all people. Kalkine.com.au and associated pages are published by Kalkine Pty Ltd ABN 34 154 808 312 (Australian Financial Services License Number 425376). The information on this website has been prepared from a wide variety of sources, which Kalkine Pty Ltd, to the best of its knowledge and belief, considers accurate. You should make your own enquiries about any investments and we strongly suggest you seek advice before acting upon any recommendation. Kalkine Pty Ltd has made every effort to ensure the reliability of information contained in its newsletters and websites. All information represents our views at the date of publication and may change without notice. To the extent permitted by law, Kalkine Pty Ltd excludes all liability for any loss or damage arising from the use of this website and any information published (including any indirect or consequential loss, any data loss or data corruption). If the law prohibits this exclusion, Kalkine Pty Ltd hereby limits its liability, to the extent permitted by law to the resupply of services. There may be a product disclosure statement or other offer document for the securities and financial products we write about in Kalkine Reports. You should obtain a copy of the product disclosure statement or offer document before making any decision about whether to acquire the security or product. The link to our Terms & Conditions has been provided please go through them and also have a read of the Financial Services Guide. On the date of publishing this report (mentioned on the website), employees and/or associates of Kalkine Pty Ltd do not hold positions in any of the stocks covered on the website. These stocks can change any time and readers of the reports should not consider these stocks as personalised advice.
Past performance is not a reliable indicator of future performance.
 Please wait processing your request...