Company Overview: Qantas Airways Limited is an Australia-based company, which operates domestic and international airline. The Company is engaged in the operation of international and domestic air transportation services, the provision of freight services and the operation of a frequent flyer loyalty program. Its segments include Qantas Domestic, Qantas International, Jetstar Group, Qantas Freight, Qantas Loyalty and Corporate. The Qantas Domestic, Qantas International and Jetstar Group segments include passenger flying businesses. The Qantas Freight segment is engaged in the air cargo and express freight business. The Qantas Loyalty segment is engaged in the customer loyalty recognition programs. Its main business is the transportation of customers using two airline brands, which include Qantas and Jetstar. It also operates subsidiary businesses, including other airlines and businesses in specialist markets, such as Q Catering. Its airline brands operate regional, domestic and international services.
.PNG)
QAN Details
Managed to Generate Profit Amidst Increased Fuel Costs: Qantas Airways Limited (ASX: QAN) is a mid-cap airline company with the market capitalisation of circa $9.26 Bn as of 06 May 2019. The group posted its results for half year ended 31 December 2018 wherein revenue grew by 5.8% and amounted to $9,206 Mn. The YoY rise in the top-line was witnessed because of the increase in unit revenue and ancillary revenue. Moreover, the group recorded a robust profit in the first half despite the rise of $416 million with respect to its fuel bill. Underlying profit before tax stood at $780 Mn while its statutory profit before tax stood at $735 million in 1HFY19. On the analysis front, the group recorded bottom line growth of 29.2% on CAGR basis during 1HFY15-19 and the same is expected to rise in the future backed by its strategic approach towards top line growth and fuel transformation initiatives. The reduction in the gap between increased fuel bill and earnings decline reflects that the company had succeeded in significantly recovering much of the higher fuel cost with the help of a 5.7% rise in the unit revenue, which was supported by the disciplined capacity management strategy. Qantas Group has been deploying towards its customers and the people as three additional 787-9 Dreamliners have entered into the service. Additionally, the company’s financial framework has been supporting shareholder returns. Its net debt stood at $5.2 billion which happens to be at bottom of the target range and the company had made an announcement of 12 cents per share interim dividend (fully franked).
.png)
1H FY 2019 Underlying Income Statement (Source: Company Reports)
Top 10 Shareholders: The following chart gives the broader picture of the shareholding pattern of Qantas Airways Limited:
.png)
Top 10 Shareholders (Source: Thomson Reuters)
Decent Position in Key Margins Compared to Industry Median: Qantas Group Limited is having a decent position in its key margins in 1H FY 2019 as its net margin stood at 5.4% which is higher than the industry median of 4.9% reflecting that the company is able to convert its top line into bottom line in an effective way as compared to the broader industry. Its gross margin stood at 54.1% which is significantly higher than the industry median of 28.7% reflecting that the company is in a better position to cover its expenses when compared to the industry. Also, its EBITDA margin was 18.4% in 1H FY 2019 which is higher than the industry median of 13.3%.
The company’s top line has witnessed a respectable CAGR growth of 2.67% in the five years to FY 2018 (FY 2014-FY 2018) which reflects that the company is having sustainable revenue-generating capabilities and, we believe, that these would continue to support the company moving forward. Also, QAN’s cash receipts witnessed the CAGR growth of 1.92% in the span of five years till FY 2018 (i.e., FY 2014-FY 2018). During 1HFY19, the company reported a free cash flow of A$78.0 million with a decent RoE of 13.6% and ROIC of 4.6%.
.png)
Key Ratio Metrics (Source: Thomson Reuters)
Revenue Strength Aided Qantas Domestic: Qantas Domestic witnessed underlying EBIT amounting to $453 million in 1H FY 2019 which reflects a rise of 0.9 per cent from the first half of 2017/18 as strength in the revenues helped the recovery of higher fuel cost. The unit revenue witnessed the rise of 7.5% and led by disciplined capacity management, transformation, and resources sector revenue growth. Qantas Domestic managed to maintain the leadership position in the corporate market and it also grew its share of Small to Medium Enterprise (or SME) market. Its operating margins were strong and stood at 14.0%.
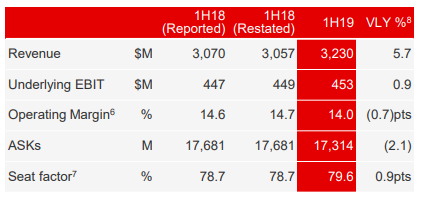
Qantas Domestic (Source: Company Reports)
With respect to domestic, the company stated that the dual brand combination of Qantas and Jetstar continues to have significant leadership with respect to market share and margins. It also added that, broadly, the domestic market happens to be well balanced.
Understanding Qantas International Performance in 1H FY 2019: The revenue of Qantas International witnessed a rise of around 7% and stood at $3.7 billion. However, its EBIT witnessed a fall of 60% and stood at $90 million, mainly because of a rapid increase in the fuel costs (up by $219 million for the half) which could not be fully recovered. Load factor increased by 1 percentage point to 85.5% and capacity growth rate moderated to 1.3 per cent in the market that grew by 3.8 per cent. Moreover, the company is positive about the Qantas International’s fundamentals. Qantas International has been witnessing the benefits from network changes that were made about a year ago on Singapore, London as well as the TransTasman.
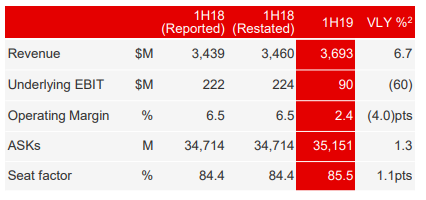
Qantas International (Source: Company Reports)
Jetstar Group’s Revenue Rose 5.1%: Jetstar Group witnessed robust earnings performance as its revenue rose by 5.1% because of the strong fundamentals. There was a strong domestic performance as a combination of unit revenue strength, higher load factors and 11% rise in ancillary revenue per passenger helped in offsetting increased fuel costs and foreign exchange impacts on the non-fuel expenses.
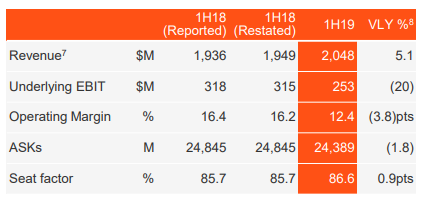
Jetstar Group (Source: Company Reports)
Frequent Flyer Program and Retail Partners Aided Qantas Loyalty: Qantas Loyalty witnessed decent results as its profits witnessed a rise of 4% and stood at $175 million and this was helped by Frequent Flyer program’s fundamental strength and its growing list of retail partners, and revenue growth from the new ventures which includes health insurance and financial services. Total revenue witnessed a rise of 8.3%.
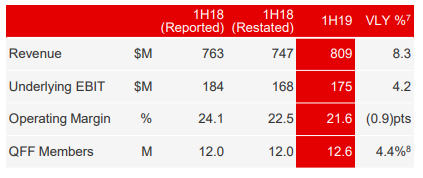
Qantas Loyalty (Source: Company Reports)
Understanding QAN’s Financial Framework: Qantas Group Limited had stated that its financial framework is aligned with the shareholder objectives. The company has been maintaining an optimal capital structure and its net debt stood at $5.2 billion which happens to be at the bottom of the target range. Throughout the cycle, the company has been delivering ROIC of more than 10% and its ROIC has increased from 16.2% in FY 2015 to 21.4% in FY 2018. There are expectations that operational flexibility might be helpful in mitigating the rising fuel costs in the medium to longer term. In 1H FY 2019, the company was able to achieve $206 million of the transformation benefits. There were cost benefits of $109 million, fuel efficiency benefits of $18 million while the net revenue benefits amounted to $79 million.
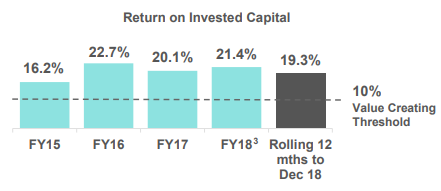
Return on Invested Capital (Source: Company Reports)
A Look at Disciplined Capital Allocation: Qantas Group Limited witnessed net capital expenditure amounting to $1.0 billion in 1H FY 2019 which excludes aircraft operating lease refinancing. The company witnessed the delivery of three new 787-9 Dreamliners and the reconfiguration and refresh programs for A321, A380, and Turboprop aircraft. However, there were upgradation of lounges and continued investment towards the transformation. We expect that the disciplined capital expenditure approach would help the company in witnessing positive momentum moving forward.
Disciplined Capital Allocation (Source: Company Reports)
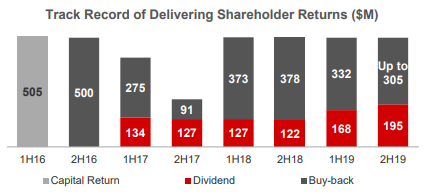
The company had wrapped up the on-market share buy-back amounting to $332 million in 1H FY 2019 and it also made an announcement of on-market share buy-back of up to $305 million. Since October 2015, the company had returned more than $3.6 billion of capital to the shareholders.
On 21 Feb 2019, QAN announced additional one-for-one on-market buyback of shares from the market of up to $305 Mn with unlimited duration which commenced from 13 March 2019. This additional buy-back is expected to bring the total reduction of shares on issue to 28% since 2015. Citigroup and Macquarie Bank are the brokers acting on behalf of the company. Up to 3 May 2019, the company bought back 2,89,62,393 shares from the market with the total consideration paid was $ 16,30,13,928.52 with the highest price paid on 3 April 2019 of $0.5.870 per share and the lowest price paid on 26 March 2019 of $5.260 per share. The remaining consideration to be paid for shares under the buy-back is up to $141,986,071.48. The purpose of the buyback program for the company is its long-standing capital management program. Coupled with the company’s focus on various strategic growth initiatives, the on-market buyback seems to be an appropriate capital management option.
Announcement on Leadership Changes: Qantas made an announcement about two key changes with respect to the leadership team. QAN's current Chief Financial Officer, Mr. Tino La Spina, would be moving to become the Chief Executive Officer of Qantas International following the recent resignation of previous CEO named Alison Webster. Also, Vanessa Hudson, who is currently the Group’s Chief Customer Officer, would be moving to the designation of Chief Financial Officer.
These changes would be taking effect from October 1, 2019, allowing Mr La Spina to close out the current fiscal year through to annual reporting.
What To Expect From QAN: Qantas Group seems to be well-positioned for robust second half and it also aims to completely recover the increased fuel cost by end of the financial year. For 2H FY 2019, the group capacity is expected to be flat and the group is expected to generate significant net free cash flow. There are expectations that the company’s FY 2019 fuel costs might be $3.90 billion and would be approximately $250 million higher in 2H FY 2019. However, in FY 2019, the company’s net depreciation and non-cancellable aircraft operating lease rentals are anticipated to be approximately $120 million higher as compared to FY 2018.
Qantas Group’s transformation benefits (cost, fuel efficiency and net revenue) are anticipated to be minimum $400 million in FY 2019 and the company is having significant flexibility in order to respond to the market conditions.There are expectations that the company is expected to be helped by robust operating cash flow generation and by the dual brand strategy.

Key Valuation Metrics (Source: Thomson Reuters)
Valuation Methodology:
Method 1: EV/EBITDA Multiple Approach (NTM)
.PNG)
*NTM- Next Twelve Months
Method 2: EV/Sales Multiple Approach (NTM)
.png)
(Note: All forecasted figures and peers' info have been taken from Thomson Reuters), *NTM- Next Twelve Months
Stock Recommendation: The stock of Qantas Airways Limited has delivered the return of 1.59% in the span of previous six months while, in the period of previous three months, the returns stood at 6.67%. The company’s annual dividend yield stood at 3.82% which can be considered at decent levels amidst challenging environment. Also, the dual brand strategy and fleet and network transition are some of the other factors which might support it moving forward. The maintenance of optimal capital structure might also attract the attention of market players. Based on the favourable outlook in the business backed by decent fundamentals and its strategy towards cost management, we have valued the stock using two Relative valuation methods, EV/Sales and EV/EBITDA multiple and arrived at a single digit upside growth (%) in the next 12 -24 months.
Hence, we give a “Buy” recommendation on the stock at the current market price of A$5.650 per share (down 2.08% on 6 May 2019).
(1).png)
QAN Daily Chart (Source: Thomson Reuters)
Disclaimer
The advice given by Kalkine Pty Ltd and provided on this website is general information only and it does not take into account your investment objectives, financial situation or needs. You should therefore consider whether the advice is appropriate to your investment objectives, financial situation and needs before acting upon it. You should seek advice from a financial adviser, stockbroker or other professional (including taxation and legal advice) as necessary before acting on any advice. Not all investments are appropriate for all people. Kalkine.com.au and associated pages are published by Kalkine Pty Ltd ABN 34 154 808 312 (Australian Financial Services License Number 425376). The information on this website has been prepared from a wide variety of sources, which Kalkine Pty Ltd, to the best of its knowledge and belief, considers accurate. You should make your own enquiries about any investments and we strongly suggest you seek advice before acting upon any recommendation. Kalkine Pty Ltd has made every effort to ensure the reliability of information contained in its newsletters and websites. All information represents our views at the date of publication and may change without notice. To the extent permitted by law, Kalkine Pty Ltd excludes all liability for any loss or damage arising from the use of this website and any information published (including any indirect or consequential loss, any data loss or data corruption). If the law prohibits this exclusion, Kalkine Pty Ltd hereby limits its liability, to the extent permitted by law to the resupply of services. There may be a product disclosure statement or other offer document for the securities and financial products we write about in Kalkine Reports. You should obtain a copy of the product disclosure statement or offer document before making any decision about whether to acquire the security or product. The link to our Terms & Conditions has been provided please go through them and also have a read of the Financial Services Guide. On the date of publishing this report (mentioned on the website), employees and/or associates of Kalkine Pty Ltd do not hold positions in any of the stocks covered on the website. These stocks can change any time and readers of the reports should not consider these stocks as personalised advice.
Past performance is not a reliable indicator of future performance.
 AU
AU

 Please wait processing your request...