
Company Overview - Platinum Investment Management Limited, trading as Platinum Asset Management (Platinum), operates a funds management business. The Company specializes in investing in international equities. Platinum manages approximately Australian dollar 22 billion with over 7% of this from investors in New Zealand, Europe, America and Asia. It offers regional and industry-specific funds in addition to global portfolios. It provides investment management services to its related party unit trusts - the Platinum Trust Funds and Platinum Global Fund; its offshore fund, Platinum World Portfolios Plc., and its two Australian Securities Exchange Limited (ASX)-listed investment companies (LICs), Platinum Capital Limited and Platinum Asia Investments Limited. Platinum's product range consists of global, regional and sector products for investment. Its Platinum Trust Funds include Platinum International Fund, Platinum Unhedged Fund, Platinum Asia Fund, Platinum Japan Fund and Platinum European Fund.
.JPG)
PTM Details
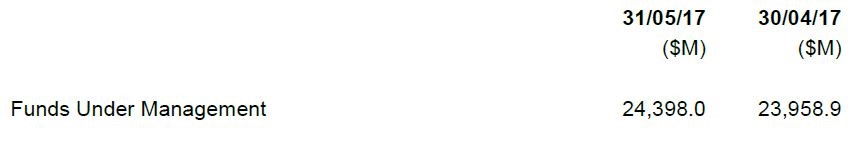
Launch of exchange traded versions of actively managed funds: During May 2017, Funds under Management grew by 1.8% month on month to $23.9 billion against 3.4% in April 2017. Recently, the company announced new Exchange Traded Managed Funds (“ETMFs”) and changes to product fees. The group will launch two Exchange Traded Managed Funds (ETMFs) in August 2017 as part of the strategy to help investors to access Platinum’s International and Asian equity strategies via the ASX. These new products will be structured as feeder funds into the existing unlisted Platinum International Fund and Platinum Asia Fund respectively, therefore they will have the same portfolio composition, portfolio managers and investment strategy as the underlying funds. The group has lowered the standard management costs on the Platinum Trust Funds and Platinum Global Fund from 1.5% to 1.35% pa to benefit clients with regards to channel choice and price options. However, the current fee and cost reductions will not have impact on 2017 revenues or profit as will not come into effect until on or about 3 July 2017, but are expected to lower PTM’s 2018 revenue.
As on 31 May 2017; (Source: Company reports)
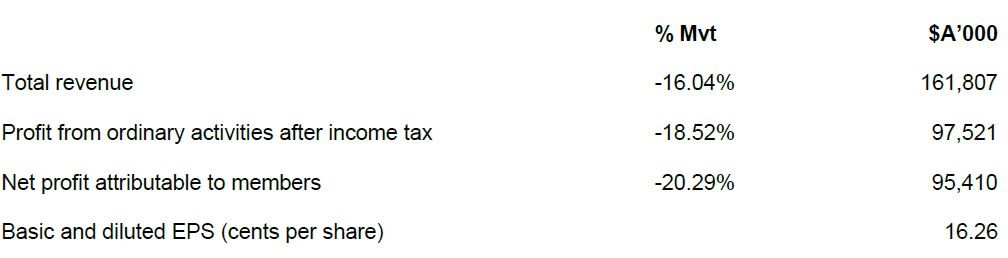
For the six months ended 31 December 2016, Platinum Asset Management Limited revenues decreased 16.0% to A$161.8M and Net income decreased 20.3% to A$95.4M. The decrease in average FUM from the previous corresponding period resulted in revenue of $155.2 million (2015: $178.1 million), which represents a decrease of 12.9%. Further, other investment income decreased to $6.6 million (2015: $14.6 million) largely due to the drop in foreign exchange gains on overseas bank accounts to $0.2 million from $7.5 million. This was due to the impact of the appreciation of US Dollar relative to Australian Dollar on foreign cash holdings in the previous corresponding period. Almost all PIML’s foreign currency cash exposure was removed in December 2016 with all significant US Dollar balances being repatriated and invested in Australian Dollar term deposits. Despite the decline in net flows and performance fee, the consolidated entity is in a strong financial position, with a robust balance sheet. The most significant driver of sustainable future growth is, and will always be, the delivery of superior, long-term, risk adjusted returns for clients.
H1FY17 Financial summary; (Source: Company reports)
Containment of Losses since inception: The Company has an outstanding record of delivering absolute returns largely because of containing losses during market downturns. Over all 5 year periods, commencing each month since inception, the Company has achieved positive returns far more frequently than the MSCI AC World Net Index and with approximately double the number of 5 year periods exceeding a return of 8% per annum compound. Moreover, the Company has recorded significantly fewer negative 5-year return periods and much smaller losses, when they have in fact occurred, compared to the benchmark. Since inception in 1994 to 31 December 2016, the Company has achieved a return of 12.23% per annum compound, after all fees and expenses, outperforming the MSCI over that time by around 5.65% per annum compound.
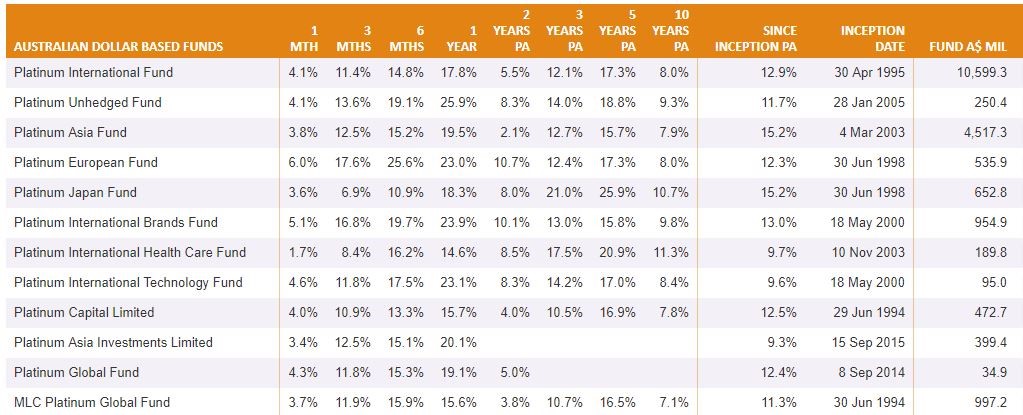
Funds’ performance as on 31 May 2017; (Source: Company reports)
Subdued growth in funds under management in H1FY17: FUM at 31 December 2016 was $23.2 billion and this was up 2.2% from the 30 June 2016 closing FUM of $22.7 billion. However, average FUM for the 6 months to 31 December 2016 decreased by 14.3% to $23.3 billion from an average FUM of $27.2 billion for the previous corresponding period. This fall in average FUM was due to the combined effect of positive markets, offset by negative net inflows. Whilst net fund flows have been negative over the last 6 months, the recent investment performance of the consolidated entity’s underlying Funds have been generally strong with 6 month returns ranging from 17.4% for the Platinum Japan Fund to 4.6% for the Platinum Asia Fund. There is a lag between strong investment performance translating into investment inflows, although since 31 December 2016, the signs from overseas clients have been encouraging, as the company received an inflow of A$129 million in the Irish offshore fund, Platinum World Portfolios Plc (PWP).
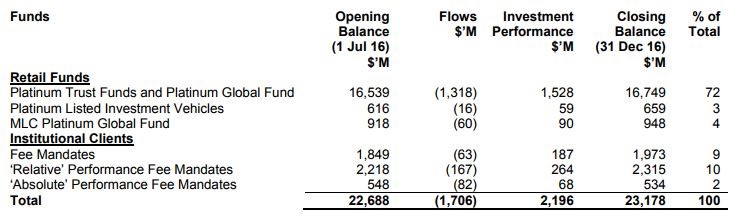
FUM at 31 Dec 2016; (Source: Company reports)
Continuously trying to beat the bench mark performance: Platinum Asset Management Limited have been generating stable long term returns against their indices even during volatile times. Platinum International Fund generated 12.5% per annum (pa) returns since inception (as at 31 January 2017) as compared to 6.3% returns of MSCI AC World Net Index in A$. Platinum Japan Fund delivered 15.0% pa returns against 9.6% returns at MSCI AC Asia ex Japan Net Index in A$. Platinum European Fund reported 11.5% pa returns as compared to 2.1% returns of MSCI AC Europe Net Index in A$. Platinum International Health Care Fund rewarded 8.9% returns from inception as compared to 8.1% pa returns of MSCI AC World Health Care Net Index in A$. Platinum Asia Fund generated 14.5% returns since inception as compared to 9.6% returns generated from MSCI AC Asia ex Japan Net Index in A$. Platinum International Technology Fund delivered 8.9% pa returns against negative returns of 1.4% generated by MSCI AC World IT Net Index in A$.
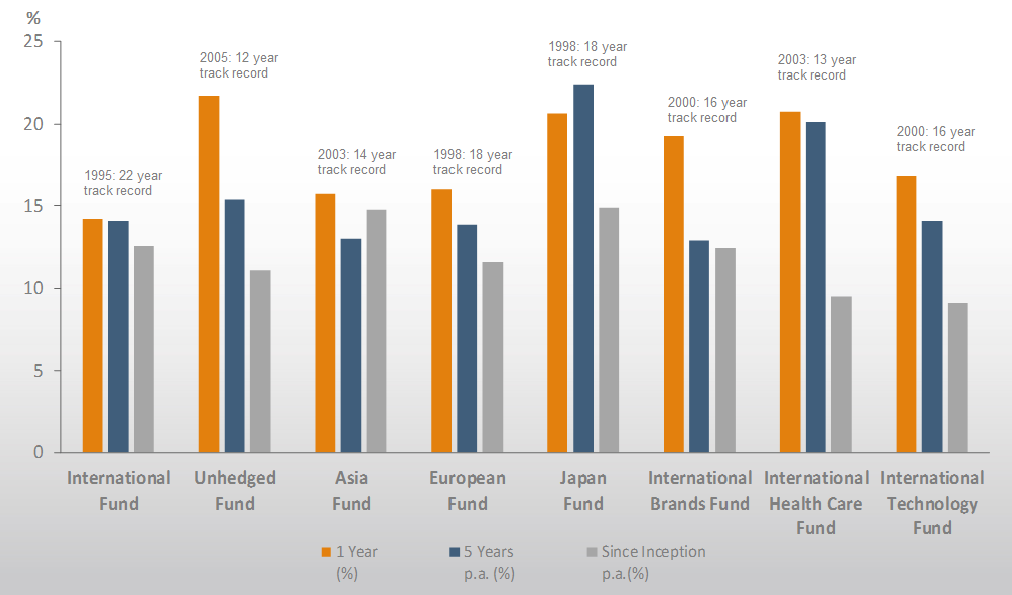
Performance as at Jan-2017; (Source: Company reports)
Firming up the core brand value: The group is constantly focusing on their core “Platinum” brand and accordingly undertook several initiatives to enhance and grow their business. The group launched two products in Australia and overseas, to diversify their investment portfolio into global shares. First product is Platinum Asia Investments Limited (ASX code: PAI), a new Listed Investment Company (LIC), which is a SMSF focused product that raised over $292.8 million and listed on the ASX on 21 September 2015.Second product is the three new Irish-domiciled UCITS (Undertaking for Collective Investment in Transferable Securities) funds under the umbrella of Platinum World Portfolios plc (PWP), which are designed to attract larger global institutional investors and extend the Platinum brand name into offshore markets.
FY16 performance impacted by decline in FUM and non-fee income: During FY16, Platinum Asset Management group’s fee revenue fell 0.9% to $337.9 million compared to $340.9 million in the prior corresponding year. This was mainly due to the softness in average Funds under Management performance which fell by 1.2% to $25.8 billion during the period as compared to $26.1 billion in 2015. Overall revenue fell by 4.4% or $15.7 million to $344.7 million from $360.4 million in 2015 impacted by declining non-fee income, including mark-to-market losses on investment in Platinum Asia Investments Limited which lost $1.5 million. Platinum World Portfolios fell $1.4 million due to falling Australian Dollar fluctuations and non-repeated investments during 2016. Further, the costs rose 6.1% or $3.6 million against the prior corresponding due to rising staff and business development costs. Profit before income tax expense was $282.2 million during the year as compared to $301.6 million in 2015, and the profit after tax also fell 6.4% during the year.
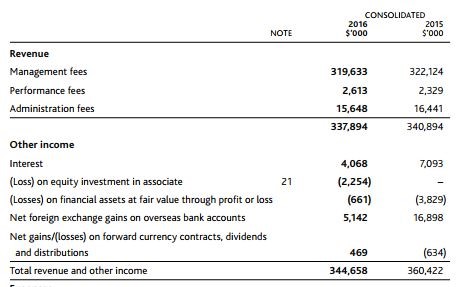
FY16 Revenue break-up; (Source: Company Reports)
Stock performance: The stock has fallen by 12.6% and 19.6% over the past six months and twelve months respectively owing to subdued growth in revenue in line with the FUM. Further, the volatile performance of the markets which led to some of the group’s products to underperform in the short term. However, we expect that the company to regain the momentum driven by improving operational efficiencies and long-term efforts to drive the overall funds’ performance. Hence, we give a “Buy” recommendation at the current price of $4.65
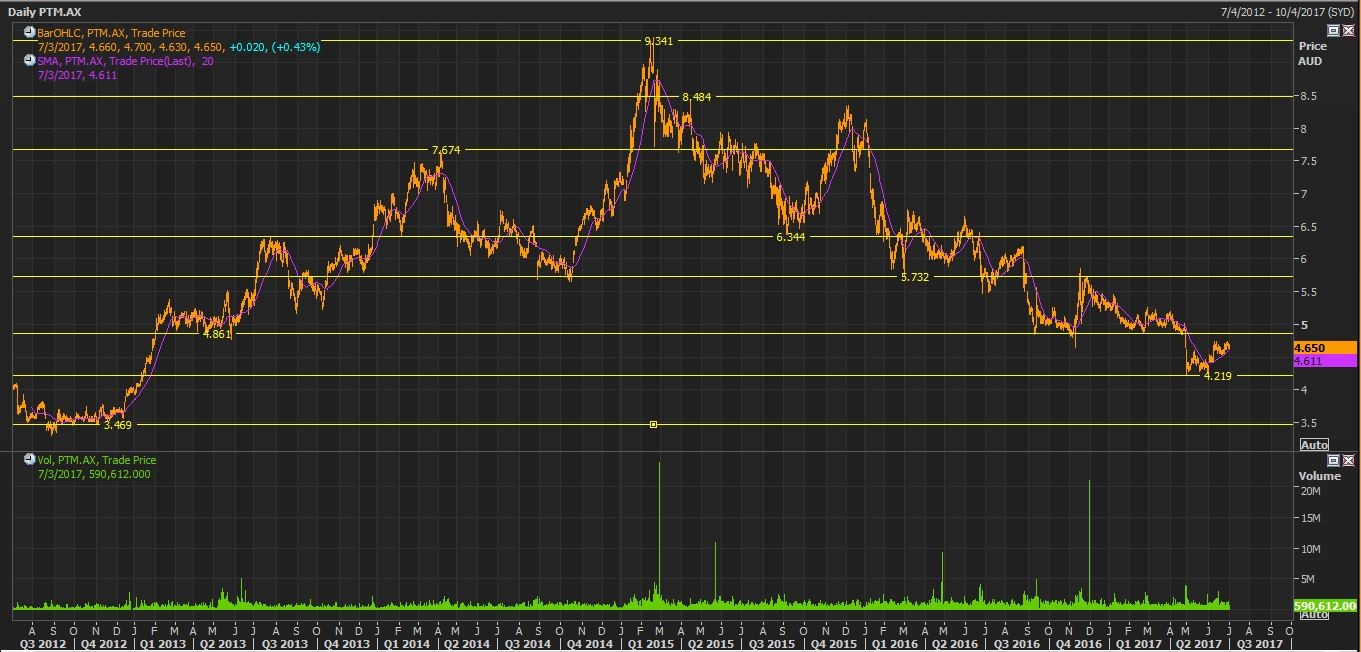
PTM Daily chart; Source: (Thomson Reuters)
Disclaimer
The advice given by Kalkine Pty Ltd and provided on this website is general information only and it does not take into account your investment objectives, financial situation or needs. You should therefore consider whether the advice is appropriate to your investment objectives, financial situation and needs before acting upon it. You should seek advice from a financial adviser, stockbroker or other professional (including taxation and legal advice) as necessary before acting on any advice. Not all investments are appropriate for all people. Kalkine.com.au and associated pages are published by Kalkine Pty Ltd ABN 34 154 808 312 (Australian Financial Services License Number 425376). The information on this website has been prepared from a wide variety of sources, which Kalkine Pty Ltd, to the best of its knowledge and belief, considers accurate. You should make your own enquiries about any investments and we strongly suggest you seek advice before acting upon any recommendation. Kalkine Pty Ltd has made every effort to ensure the reliability of information contained in its newsletters and websites. All information represents our views at the date of publication and may change without notice. To the extent permitted by law, Kalkine Pty Ltd excludes all liability for any loss or damage arising from the use of this website and any information published (including any indirect or consequential loss, any data loss or data corruption). If the law prohibits this exclusion, Kalkine Pty Ltd hereby limits its liability, to the extent permitted by law to the resupply of services. There may be a product disclosure statement or other offer document for the securities and financial products we write about in Kalkine Reports. You should obtain a copy of the product disclosure statement or offer document before making any decision about whether to acquire the security or product. The link to our Terms & Conditions has been provided please go through them and also have a read of the Financial Services Guide. On the date of publishing this report (mentioned on the website), employees and/or associates of Kalkine Pty Ltd do not hold positions in any of the stocks covered on the website. These stocks can change any time and readers of the reports should not consider these stocks as advice or recommendations.
Past performance is not a reliable indicator of future performance.
 Please wait processing your request...