Kalkine has a fully transformed New Avatar.

Company Overview: Pendal Group Limited, formerly BT Investment Management Limited, is engaged in the provision of investment management services. The Company operates through two segments: investment management business in Australia (BTIM Australia) and investment management business outside of Australia (BTIM UK). The Company operates in the funds management markets in the world, including the United States, the United Kingdom, Asia, Europe and Australia. The Company offers investment services in Australian equities, global equities, property, ethical, income and fixed interest and diversified strategies. Its Australian equities include a range of funds, such as BT Core Australian Share Fund, BT Focus Australian Share Fund, BT MicroCap Opportunities Fund, BT Smaller Companies Fund and BT MidCaps Fund. J O Hambro Capital Management (JOHCM), which operates as a boutique investment management business with offices in London, Singapore, New York and Boston specializing in the active management of equities.
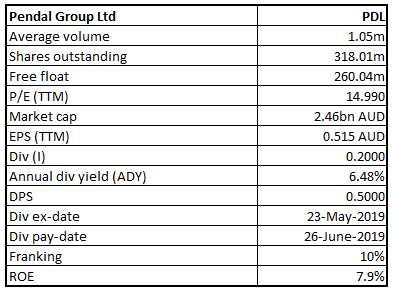
PDL Details
Healthy Balance Sheet Position: Pendal Group Limited (ASX: PDL) is an independent, global investment management company that is focused on generating returns for its clients through active management. As on July 25, 2019, the market capitalisation of Pendal Group Limited stood at ~$2.46 billion. The company earlier released its results for the six months ended March 31, 2019 (or 1H FY19) in which its cash NPAT (or Net Profit After Tax) amounted to $84.5 million which reflects a fall of 26% on pcp basis because of the significant decrease in the performance fees as well as lower base management fee revenue. The company’s cash operating expenses amounted to $140.0 million, which implies a fall of 13%, mainly led by lower variable staff costs given lower fee revenue. The company’s operating profit margin for 1H FY19 stood at 42% as compared to 45% in the pcp. Pendal Group Limited stated that its 1H FY19 results got supported by the stronger foreign currencies which witnessed the average levels of the US Dollar, Japanese Yen, British Pound, and the Euro all higher as compared to the average levels in 1H FY18.
Pendal Group Limited’s FUM witnessed robust net inflows with respect to the Australian business during 1H FY19, while the Brexit uncertainty impacted the flows in the UK/European open-ended investment companies (OEICs). The company’s closing FUM as at March 31, 2019 stood at $100.9 billion, that represents 1% fall on $101.6 billion as at September 30, 2018, which was affected by the significant negative market movements witnessed in the quarter ended December. The company has a strong balance sheet position with no debt and good cash flows. Resultantly, the Board of Directors declared a 10% franked interim dividend of 20.0 cents per share, equating a payout ratio of 75%, which can be considered at the decent levels. The Board happens to have a dividend policy of shelling out 80-90% of its full-year Cash NPAT. Moreover, the company has recorded an average RoE of 19.78% in the past 5 years and has now improved it to 22.60% in FY18. At CMP of A$7.840, PDL is trading at a PE multiple of 13.59x FY20E EPS. Moving forward, global macro-economic conditions, geopolitical factors and the overall health of the global economy are the factors which could influence the performance of the company. Considering strong balance sheet position, decent margins, and return ratios, we have valued the stock using two Relative valuation method, P/E and P/BV multiple and 5-year average P/E multiple to FY20E consensus EPS of ~$0.58 and have arrived at the target price upside of lower double-digit growth (in %).
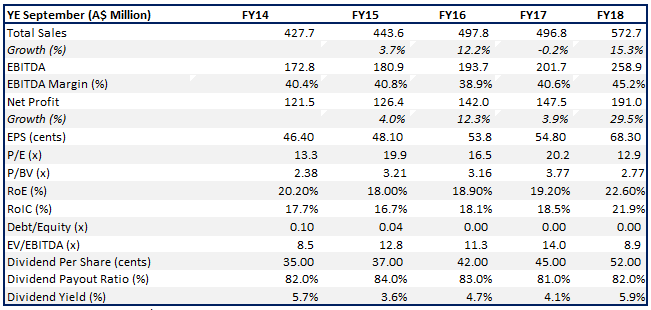
Key Financial Highlights (Source: Company Reports, Thomson Reuters)
Top 10 Shareholders: The following table provides a brief overview of top 10 shareholders in Pendal Group Limited:
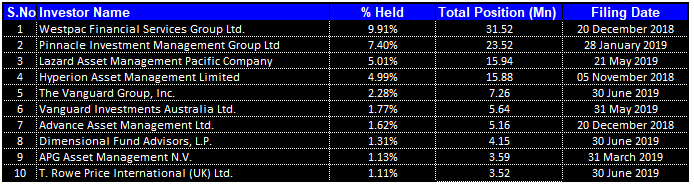
Top 10 Shareholders (Source: Thomson Reuters)
Decent Key Margins: Pendal Group Limited is having decent footing when it comes to its key margins as its 1H FY19 net margin stood at 28.6%, which is higher than the broader industry median of 20.4% and, thus, it can be said that the company is possessing better capabilities to convert its top-line into bottom-line as compared to the broader industry. However, the company’s EBITDA margin stood at 39.1% in 1H FY19. Further, the returns generated for the shareholders are above the industry as the ROE is reported at 7.9% in 1HFY19 as compared to the industry median of 2.5%. The company is possessing respectable liquidity levels as its current ratio stood at 1.53x in 1H FY19 as compared to the industry median of 1.50x and, thus, it looks like that the company would be able to meet its short-term obligations. Also, it can be said that the company could make necessary deployments towards the strategic objectives which can help it in achieving long-term growth.
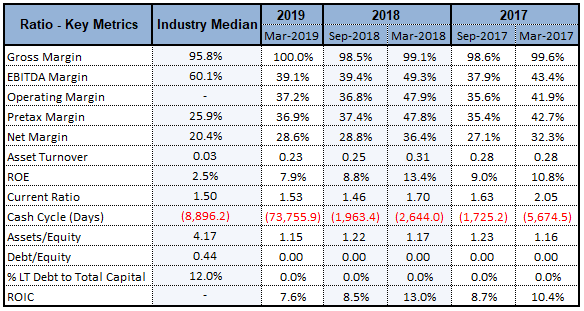
Key Ratios (Source: Thomson Reuters)
Marginal Rise in FUM Amidst Global Challenges: Pendal Group Limited has recently released its FUM figure as at June 30, 2019 wherein Funds Management FUM stood at $101.3 Bn at the end of the quarter with a marginal rise of 0.40%. During the quarter, Pendal Australia witnessed net outflows amounting to -$2.0 billion mainly because of the previously announced Westpac redemption amounting to $1.5bn which consisted of $2.1 billion redeemed from the legacy book that got partially offset by $0.6 billion coming into Westpac Other book.
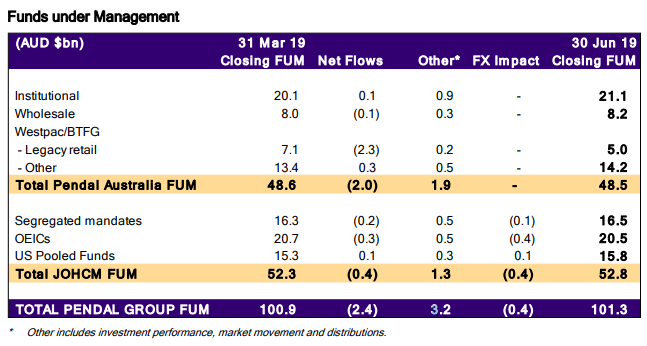
Funds Under Management (Source: Company Reports)
JOHCM (or J O Hambro Capital Management) witnessed net outflows amounting to -$0.4 billion for the June 2019 quarter largely because of the net outflows of European OEICs, which were of -$0.5 billion, and emerging markets strategies, which were of -$0.4 billion, in the institutional channel. These outflows were offset by the robust inflows into global strategies of +$0.4bn via the institutional channel and the US pooled funds, and UK equities of +$0.2bn in the OEICs.
Appointment of JOHCM CEO: Pendal Group Limited made an announcement of the appointment of Alexandra Altinger as the CEO (or Chief Executive Officer) of J O Hambro Capital Management (or JOHCM) operations in the UK, Europe and Asia. Mr Emilio Gonzalez, who is the Group Chief Executive Officer of Pendal Group, stated that Ms Altinger’s leadership roles, cross-border experience as well as her expertise in the wealth and asset management were the primary reasons for the decision made.
Understanding PDL’s FUM and Flows: In 1H FY19, Pendal Group Limited witnessed robust inflows into cash, fixed income, as well as Australian equities and the following picture would provide a brief overview of FUM and flows by the asset class:
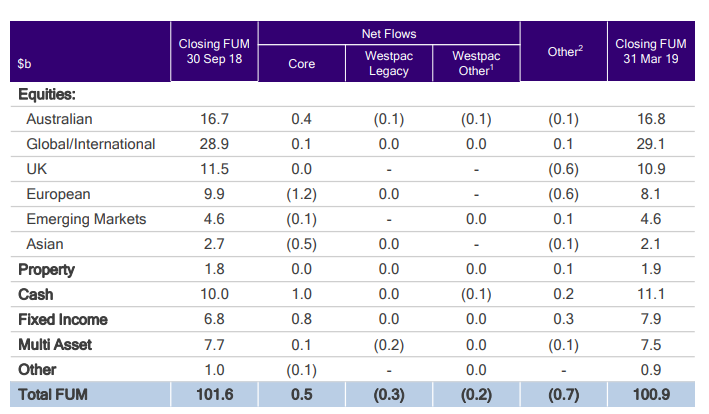
FUM and Flows by Asset Class (Source: Company Reports)
The company also added that the European equity flows were impacted by the clients, decreasing the exposure to Europe. The company stated that its FUM stood at $100.9 billion at the end of March 31, 2019, which reflects a fall of $0.7 billion for the half mainly because of lower market levels and was partially offset by lower Australian Dollar while the net flows were flat for the period. The company added that they witnessed outflows throughout the European and Asian equity strategies. However, there were good institutional inflows into the Australian equities, cash, and fixed income strategies.
Strategic Highlights Related to 1H FY19: During 1H FY19, Pendal Group Limited stated that it expanded its US distribution footprint by establishing a presence on the West Coast, launching the Concentrated Global Share strategy through UCITS vehicle in Europe, as well as moving to the full ownership of Regnan. The company stated that 1H FY19 was challenging for the markets as well as investors. It added that the market returns in the quarter ended December were worst on record since September 2011 quarter before rebounding again in the quarter ended March. The volatility, together with the Brexit uncertainty led to cautious investor sentiment, particularly in Europe as well as subdued industry flows in the region.
Dividend Yield Higher Than Industry Median: The Directors of Pendal Group Limited decided to pay the partly franked interim dividend amounting to 20.0 cents per share (10% franked) on the ordinary shares. The company stated that the current dividend policy revolves around achieving the pay-out ratio in the range of 80% to 90% of Cash NPAT for FY19. Additionally, it was stated that the capital which is retained in the business to grow PDL is mainly used towards providing the seed capital for the new funds and investment strategies. The annual dividend yield of the company is about 4.8% on a five-year average basis (FY14-18). Additionally, at CMP of $7.840, the company happens to possess annual dividend yield of 6.48%, which is higher than the industry median of 5.0% and, thus, it looks like that the company has been delivering better returns to the shareholders as compared to the broader industry and this might attract the attention of market players. As can be seen from the below picture, between 1H FY15- 1H FY19, the company’s interim dividends witnessed CAGR growth of 4%, which can be considered at respectable levels.
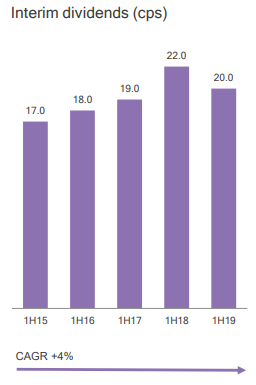
Interim dividends (cps) (Source: Company Reports)
What To Expect From PDL Moving Forward: There are expectations that any sort of resolution to the trade talks between the US and China might help to improve investor confidence. The company’s key personnel stated that even though there are more difficult trading conditions, PDL’s robust balance sheet as well as no debt and good cash flow means that it is in a firm position to take advantage of the opportunities to expand capabilities and global presence. The company is focused on expanding the investment and distribution capabilities, maintaining the disciplined approach to managing capacity and providing the ongoing support to investment talent via investment-led culture and business model.
Additionally, it can also be said that the performance of the company would be sensitive to the overall health of the global economy and to the macro-economic factors. The settlement of the trade battle between the US and China can provide stability to the broader stock markets, which might help the company’s performance.
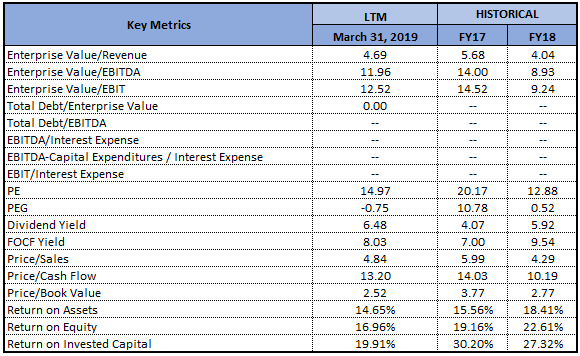
Key Valuation Metrics (Source: Thomson Reuters)
Valuation Methodologies:
Method 1: Price to Book Value based Valuation
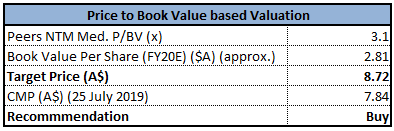
Price to Book Value based Valuation (Source: Thomson Reuters), *NTM: Next Twelve Months
Method 2: PE- based Valuation
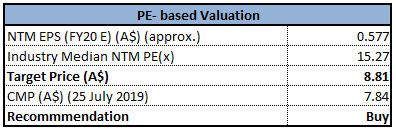
PE- based Valuation (Source: Thomson Reuters), *NTM: Next Twelve Months
Note: All forecasted figures and peers have been taken from Thomson Reuters, *NTM-Next Twelve Months
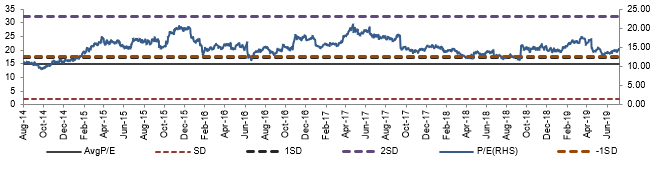
Historical P/E Band (Source: Company Reports, Thomson Reuters)
Stock Recommendation: Fundamentally, PDL seems quite attractive as its top-line has witnessed a CAGR growth of 7.57% between FY14- FY18, which reflects that the company is possessing respectable capabilities to generate revenues. During the same period, the company’s bottom line witnessed a CAGR growth of 11.97%. Also, the company is possessing decent operational capabilities as its cash from operating activities witnessed a CAGR growth of 4.57% in the time frame of FY 2014- FY 2018. It can be said that its operational capabilities, together with revenue-generation capabilities, might help the company in achieving long-term growth.
The company’s stock has delivered a return of 0.52% on the YTD basis while, in the span of the previous one month, the stock delivered 8.43%, which can be considered at decent levels. Additionally, the company’s annual dividend yield is higher than the broader industry median, which might attract the attention of the dividend-seeking investors. Considering strong balance sheet position, decent margins and return ratios, we have valued the stock using two Relative valuation method, P/E and P/BV multiple and 5-year average P/E multiple to FY20E consensus EPS of ~$0.58 and have arrived at the target price upside of lower double-digit growth (in %). Hence, in view of aforesaid parameters, we give a “Buy” recommendation on the stock at the current market price of A$7.840 per share (up 1.554% on 25 July 2019).
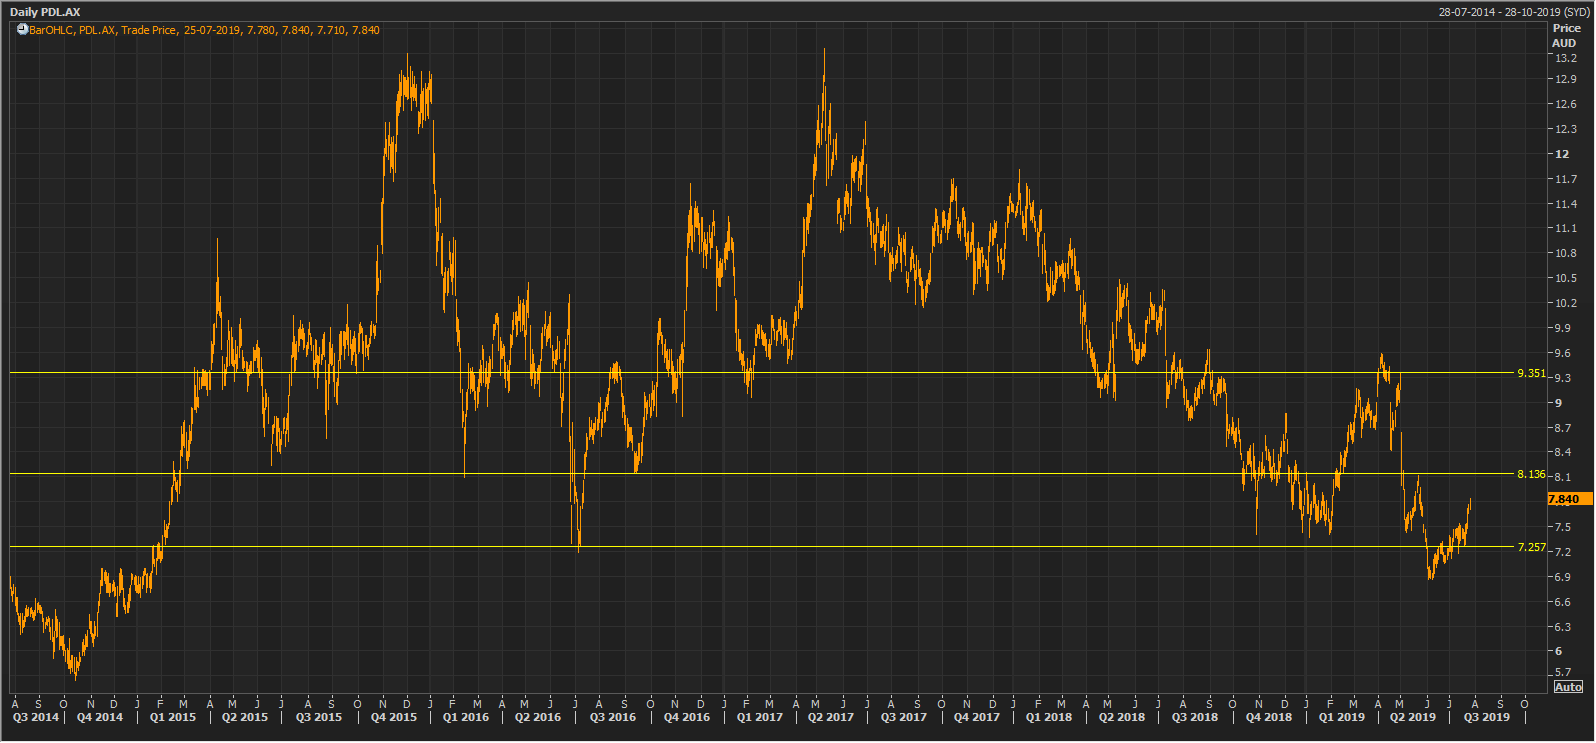
PDL Daily Chart (Source: Thomson Reuters)
Disclaimer
The advice given by Kalkine Pty Ltd and provided on this website is general information only and it does not take into account your investment objectives, financial situation or needs. You should therefore consider whether the advice is appropriate to your investment objectives, financial situation and needs before acting upon it. You should seek advice from a financial adviser, stockbroker or other professional (including taxation and legal advice) as necessary before acting on any advice. Not all investments are appropriate for all people. Kalkine.com.au and associated pages are published by Kalkine Pty Ltd ABN 34 154 808 312 (Australian Financial Services License Number 425376). The information on this website has been prepared from a wide variety of sources, which Kalkine Pty Ltd, to the best of its knowledge and belief, considers accurate. You should make your own enquiries about any investments and we strongly suggest you seek advice before acting upon any recommendation. Kalkine Pty Ltd has made every effort to ensure the reliability of information contained in its newsletters and websites. All information represents our views at the date of publication and may change without notice. To the extent permitted by law, Kalkine Pty Ltd excludes all liability for any loss or damage arising from the use of this website and any information published (including any indirect or consequential loss, any data loss or data corruption). If the law prohibits this exclusion, Kalkine Pty Ltd hereby limits its liability, to the extent permitted by law to the resupply of services. There may be a product disclosure statement or other offer document for the securities and financial products we write about in Kalkine Reports. You should obtain a copy of the product disclosure statement or offer document before making any decision about whether to acquire the security or product. The link to our Terms & Conditions has been provided please go through them and also have a read of the Financial Services Guide. On the date of publishing this report (mentioned on the website), employees and/or associates of Kalkine Pty Ltd do not hold positions in any of the stocks covered on the website. These stocks can change any time and readers of the reports should not consider these stocks as personalised advice.
 Please wait processing your request...