
Kalkine’s Global Travel & Leisure Report offers a comprehensive view of the key companies and evolving trends across the travel value chain covering countries including US, Canada, Australia, UK, and New Zealand. This includes airlines, hospitality chains, digital travel platforms, as well as the rapidly growing leisure, entertainment, and gaming segments that are redefining the way people engage with travel experiences.

Global Hotel and Resorts Market: A Dynamic Growth Trajectory:

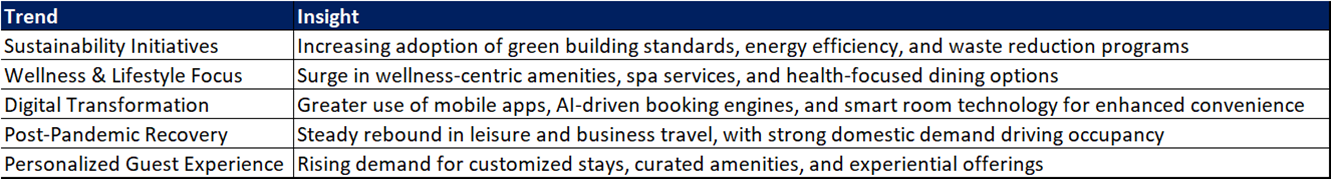

Between 2020 and 2024, the global hotel industry demonstrated a remarkable trajectory of recovery and growth:
Kalkine’s Global Travel & Leisure Report covers the Investment Highlights, Key Financial Metrics, Risks, Technical Analysis along with the Valuation, Target Price, and Recommendation on Park Hotels & Resorts Inc (NYSE: PK).
Section 1: Company Overview and Fundamentals Insights
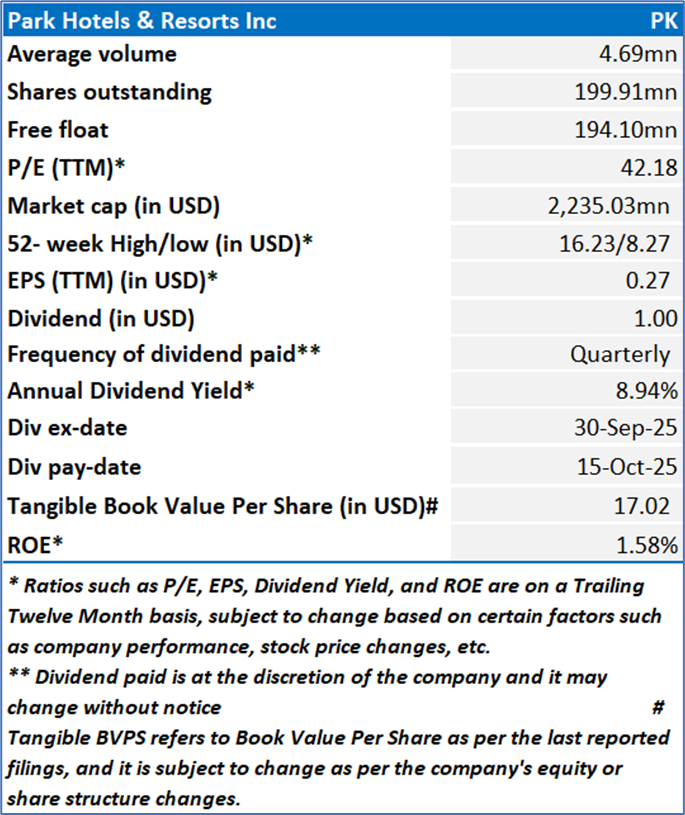
Company Overview: Park Hotels & Resorts Inc (NYSE: PK) operates as a lodging-focused real estate investment trust (REIT), managing a broad portfolio of hotels and resorts that hold substantial real estate value.
Kalkine’s Global Travel and Leisure Report covers the Investment Highlights, Key Financial Metrics, Risks, and Technical Analysis along with the Valuation, Target Price, and Recommendation on the stock.
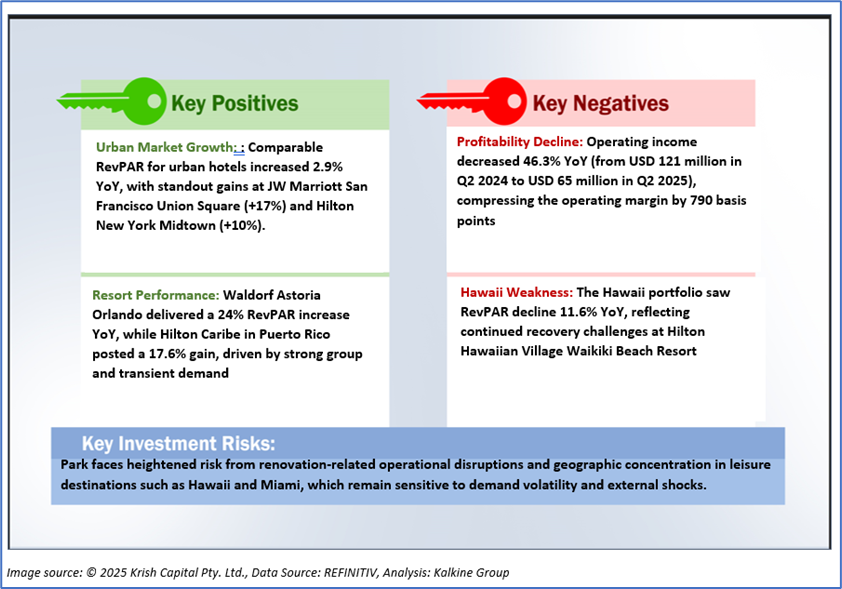
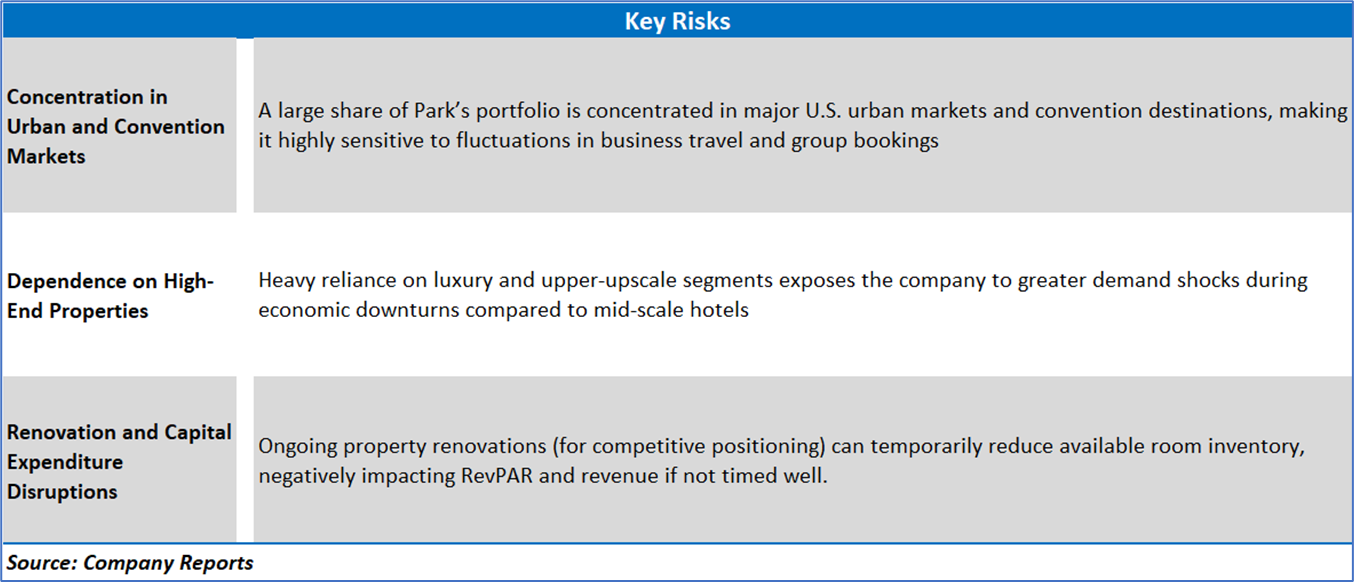
1.2 The Key Positives, Negatives, Investment Highlights, and Risks
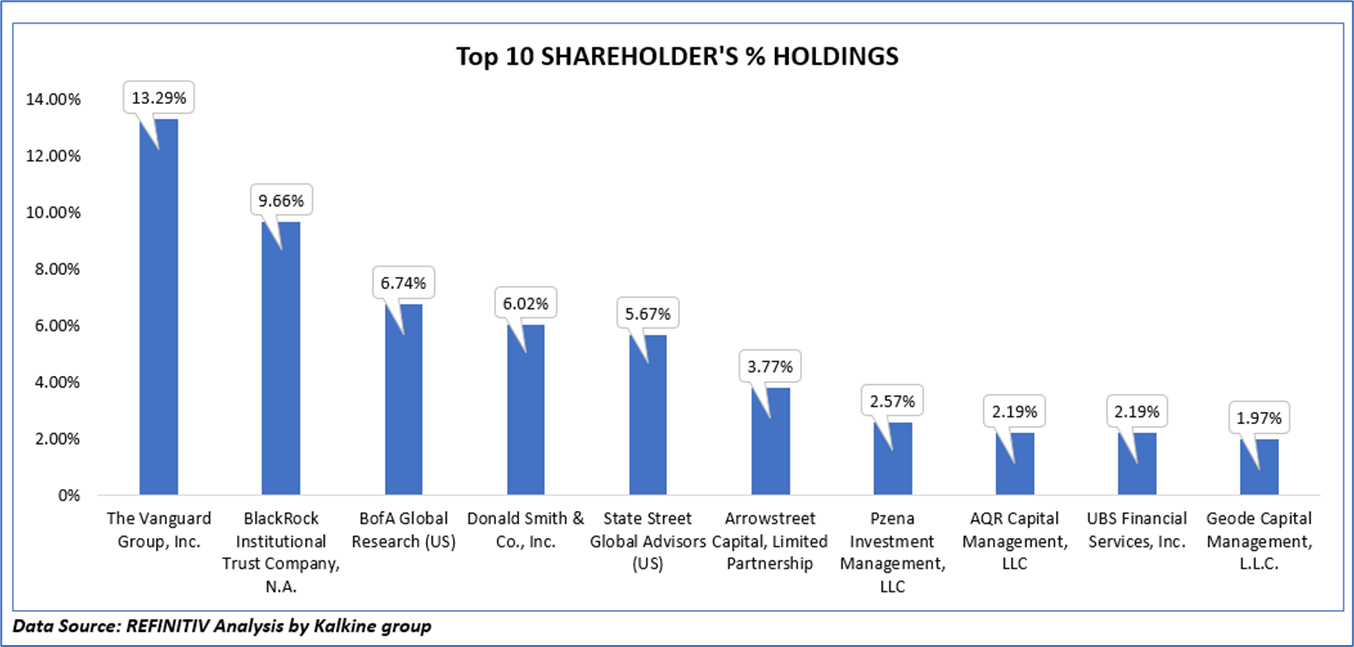
1.3 Top 10 Shareholders:
The top 10 shareholders together form ~54.08% of the total shareholding. The Vanguard Group, Inc. and BlackRock Institutional Trust Company, N.A. hold maximum stakes of 13.29% and 9.66%, respectively.
1.4 Key Metrics:
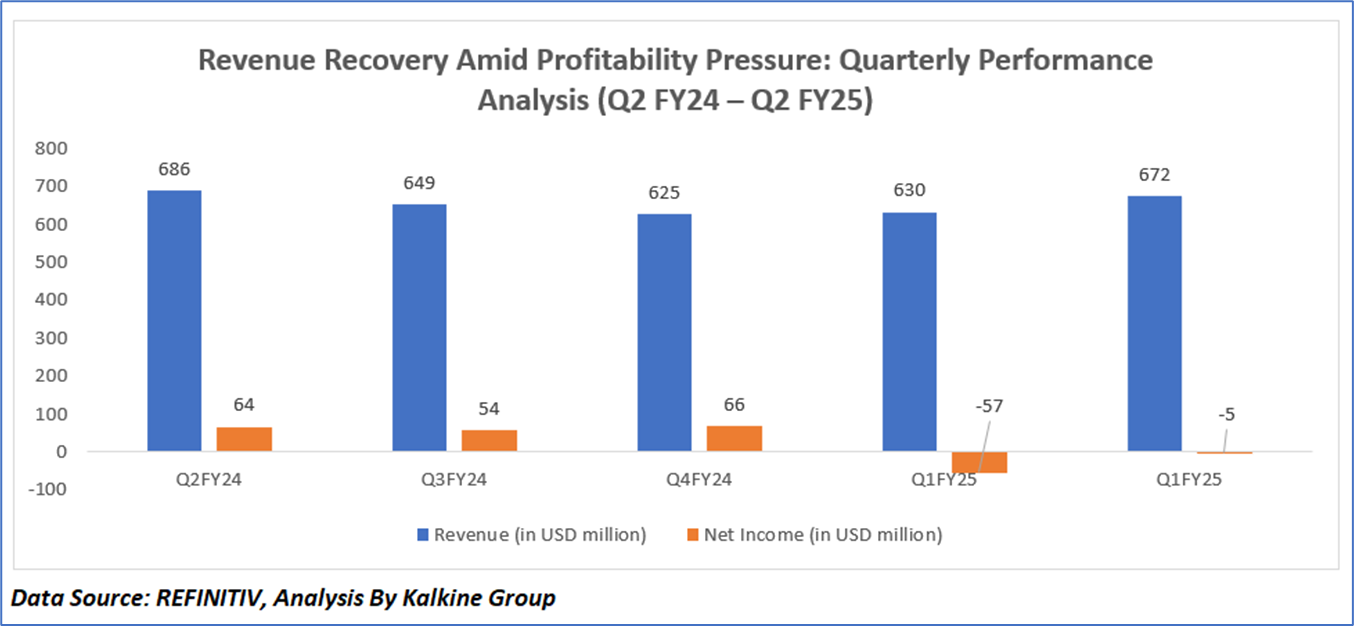
Park Hotels & Resorts experienced a sequential revenue decline from Q2 FY24 (USD 686 million) to Q4 FY24 (USD 625 million), largely due to softer leisure demand, modest ADR pressure, and renovation-related disruptions in key properties. Q1 FY25 remained relatively stable at USD 630 million, while Q2 FY25 showed a strong rebound to USD 672 million, supported by improved group bookings and seasonal demand recovery. Net income, which remained positive through FY24 (USD 54 million–USD 66 million), turned negative in FY25 with a sharp drop to negative USD 57 million in Q1, primarily driven by higher operating costs, interest expenses, and the timing of asset sales. However, Q2 FY25 witnessed a significant improvement, narrowing the loss to negative USD 5 million, reflecting operational efficiencies and RevPAR recovery. Looking ahead, sustained demand in business travel and continued cost discipline could help restore profitability, while the company’s high-quality real estate portfolio positions it well to capture upside as macroeconomic conditions stabilize.
Section 2: Business Updates, Financial and Operational Highlights
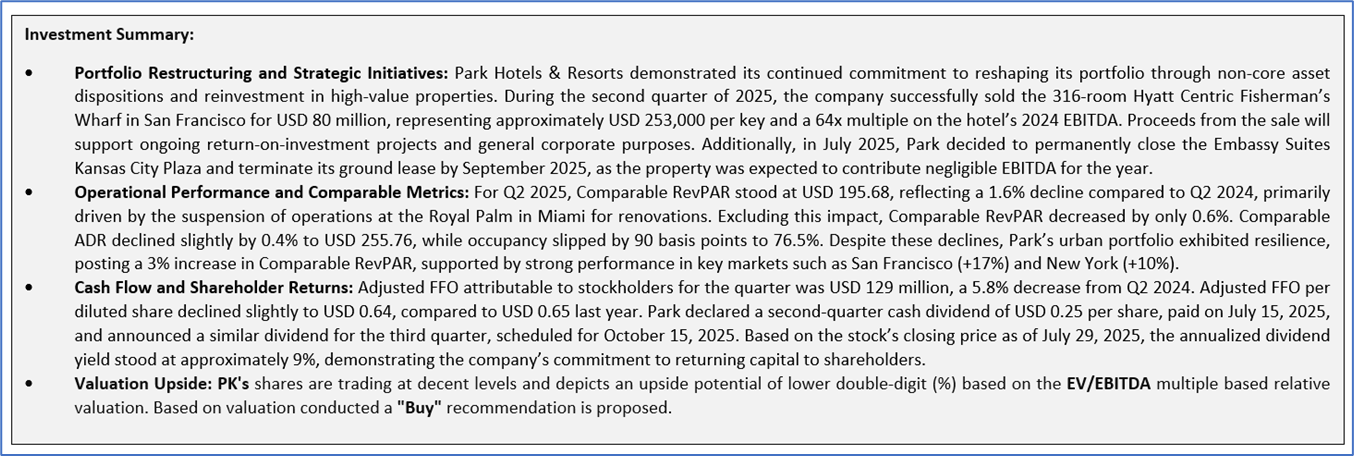
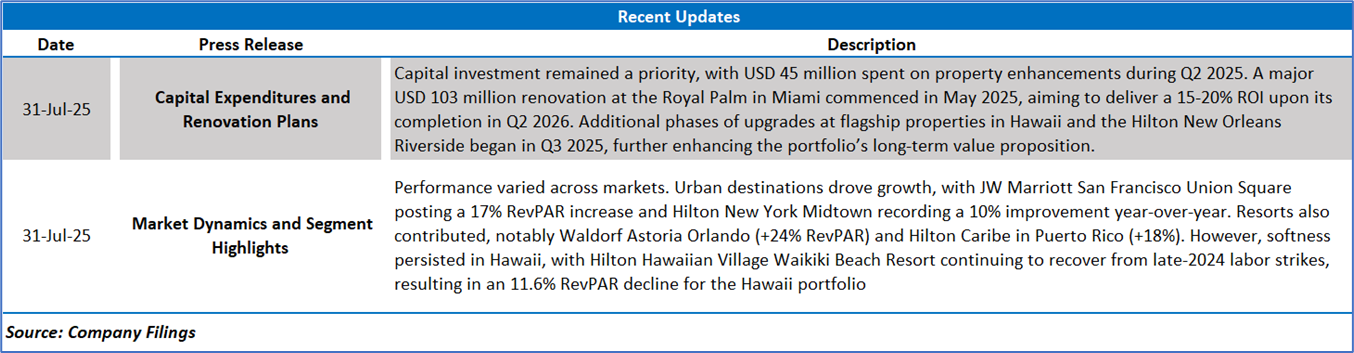
2.1 Recent Business Updates:
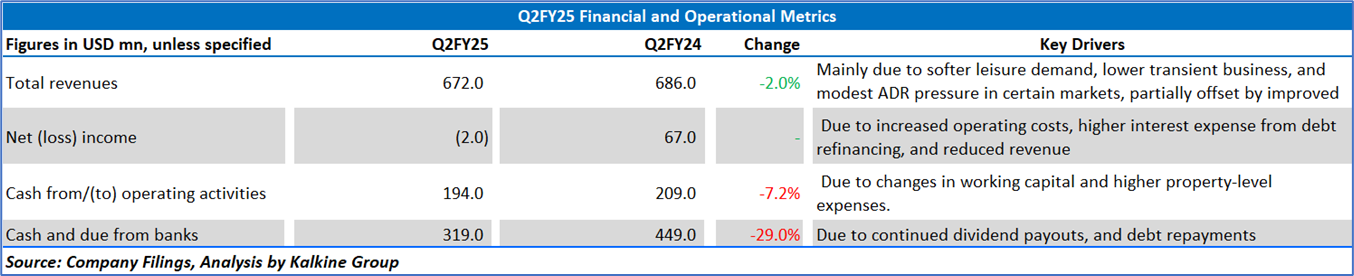
2.2 Q2FY25 Results Highlights (for the 03 months ended June 30, 2025): Below are some key financial highlights:
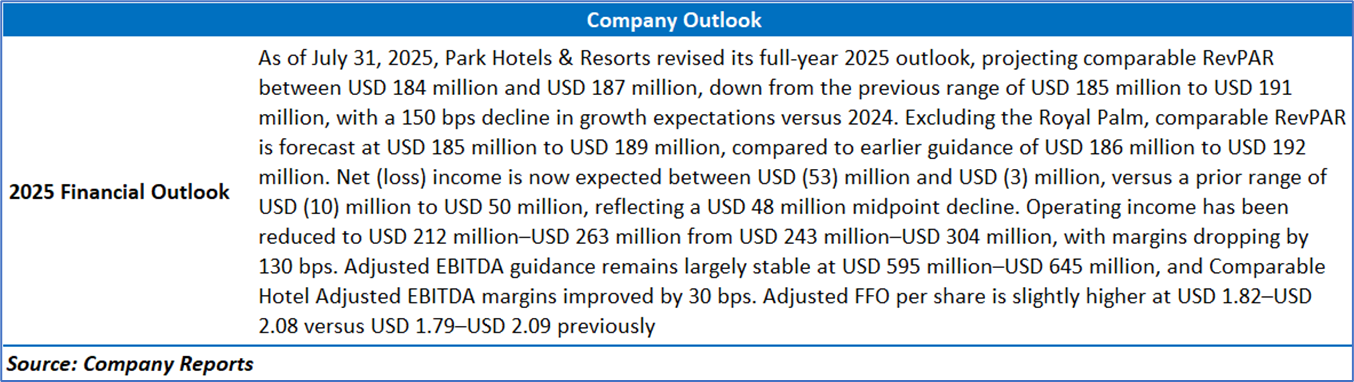
Section 3: Key Risks and Outlook:
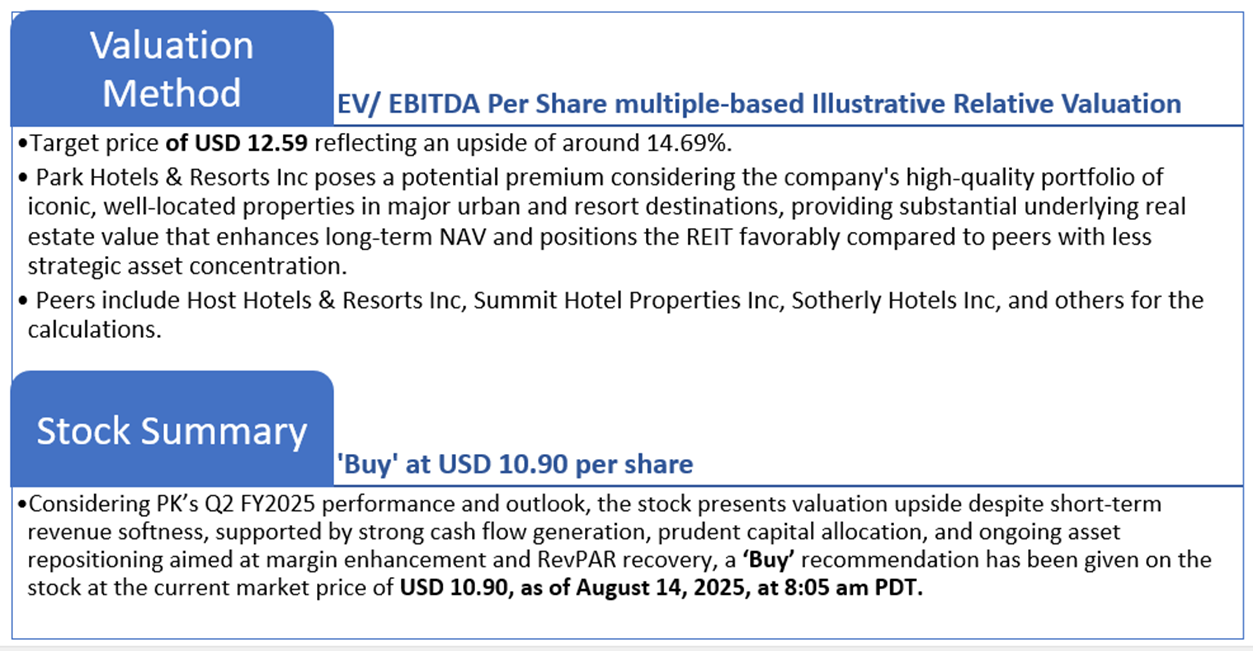
Section 4: Stock Recommendation Summary
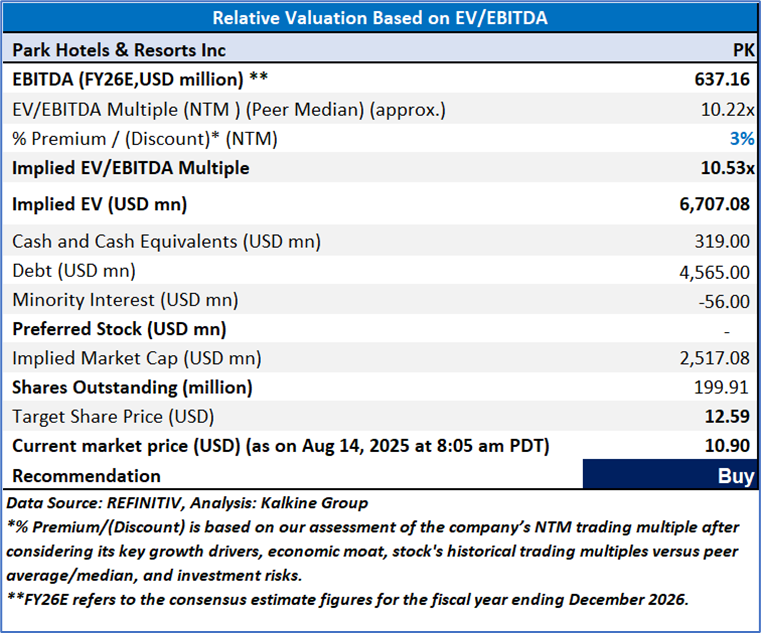
4.2 Fundamental Valuation
Valuation Methodology: EV/EBITDA Multiple Based Relative Valuation (Illustrative)
Markets are trading in a highly volatile zone currently due to certain macro-economic issues and geopolitical tensions prevailing. Therefore, it is prudent to follow a cautious approach while investing.
Note 1: Past performance is neither an indicator nor a guarantee of future performance.
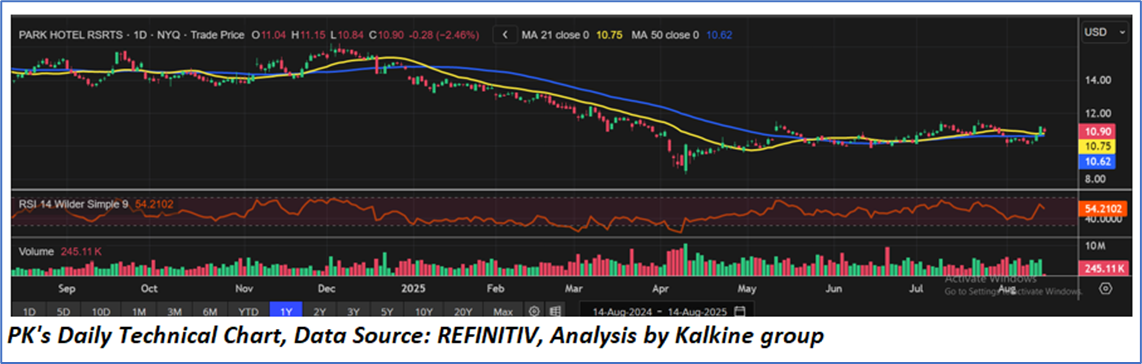
Note 2: The reference date for all price data, currency, technical indicators, support, and resistance levels is 14 August 2025. The reference data in this report has been partly sourced from REFINITIV.
Note 3: Investment decisions should be made depending on an individual's appetite for upside potential, risks, holding duration, and any previous holdings. An 'Exit' from the stock can be considered if the Target Price mentioned as per the Valuation and or the technical levels provided has been achieved and is subject to the factors discussed above.
Note 4: Dividend Yield may vary as per the stock price movement.
Note 5: Kalkine reports are prepared based on the stock prices captured either from REFINITIV or Trading View. Typically, REFINITIV or Trading View may reflect stock prices with a delay which could be a lag of 25-30 minutes. There can be no assurance that future results or events will be consistent with the information provided in the report. The information is subject to change without any prior notice.
Technical Indicators Defined: -
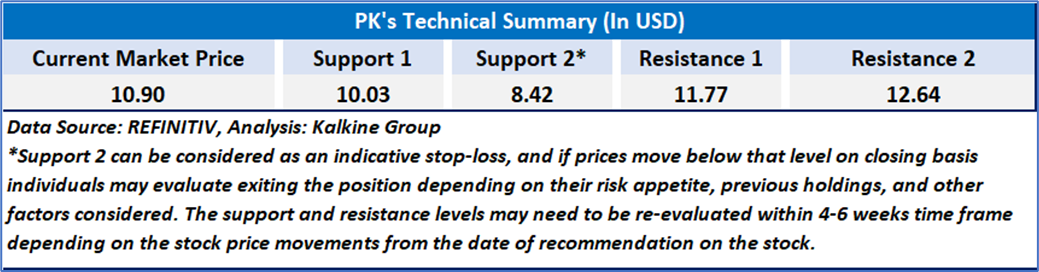
Support: A level at which the stock prices tend to find support if they are falling, and a downtrend may take a pause backed by demand or buying interest. Support 1 refers to the nearby support level for the stock and if the price breaches the level, then Support 2 may act as the crucial support level for the stock.
Resistance: A level at which the stock prices tend to find resistance when they are rising, and an uptrend may take a pause due to profit booking or selling interest. Resistance 1 refers to the nearby resistance level for the stock and if the price surpasses the level, then Resistance 2 may act as the crucial resistance level for the stock.
Stop-loss: It is a level to protect further losses in case of unfavourable movement in the stock prices.
This report (“Report”) has been issued by Kalkine Pty Limited (ABN 34 154 808 312) (Australian financial services licence number 425376) (“Kalkine”) and prepared by Kalkine and its related bodies corporate who are authorised to provide general financial product advice. Kalkine.com.au and its associated pages are published by Kalkine.
Any advice provided in this Report is general advice only and does not take into account your objectives, financial situation or needs. You should therefore consider whether the advice is appropriate for your objectives, financial situation and needs before acting upon it.
There may be a Product Disclosure Statement, Information Memorandum or other offer document (“Offer Document”) for the securities or other financial products referred in this Report. You should obtain a copy of the relevant Offer Document and consider it before making any decision about whether to acquire the security or financial product.
Kalkine strongly recommends that you seek advice from a financial adviser, stockbroker or other professional (including taxation and legal advice) before acting on any of the general advice in this Report or on the Kalkine website. Not all investments are appropriate for all people.
The information in this Report and on the Kalkine website has been prepared from a wide variety of sources, which Kalkine, to the best of its knowledge and belief, considers accurate. Kalkine has made every effort to ensure the reliability of the information contained in its reports (including this Report), newsletters and websites. All information represents our views at the date of publication and may change without notice.
The information in this Report does not constitute an offer to sell securities or other financial products or a solicitation of an offer to buy securities or other financial products. Our reports contain general recommendations to invest in securities and other financial products. Kalkine is not responsible for, and does not guarantee, the performance of, or returns on, any investments mentioned in this Report.
Kalkine does not issue, sell or deal in any financial products.
This Report may contain information on past performance of particular investments. Past performance is not a reliable indicator of future performance. Returns stated do not take into account transaction costs and taxes. To the extent permitted by law, and excluding any dishonesty or gross negligence by Kalkine, Kalkine disclaims and excludes all liability for any direct, indirect, implied, punitive, special, incidental or other consequential loss or damage arising from the use of or reliance on this Report, the Kalkine website and any information published on the Kalkine website without any warranties or representations by Kalkine to you. To the extent the law prohibits or limits this exclusion, Kalkine limits its liability to the resupply of services.
Please also read our Terms & Conditions and Financial Services Guide for further information. Employees and/or associates of Kalkine and its related entities may hold interests in the securities or other financial products covered in this Report or on the Kalkine website. Any such employees and associates are required to comply with certain, procedures and disclosures as required by law.
Kalkine Media Pty Ltd, an affiliate of Kalkine Pty Ltd, may have received, or be entitled to receive, financial consideration in connection with providing information about certain entity(s) covered on its website including entities covered in this Report.
Copyright 2025 Krish Capital Pty. Ltd. (ABN 61629651510). All Rights Reserved. No part of this report, or its content, may be reproduced in any form without our prior consent.
Past performance is not a reliable indicator of future performance.
 Please wait processing your request...