
Kalkine’s Global Tariff Report delivers objective, data-driven insights into key global sectors impacted by tariff fluctuations. It assesses how these changes influence equity valuations across affected industries, with a focus on trade-sensitive sectors that often attract increased investor attention during times of tariff-related uncertainty. The report also highlights defensive and countercyclical segments that tend to show resilience—or even outperformance—amid disruptions in global trade dynamics.
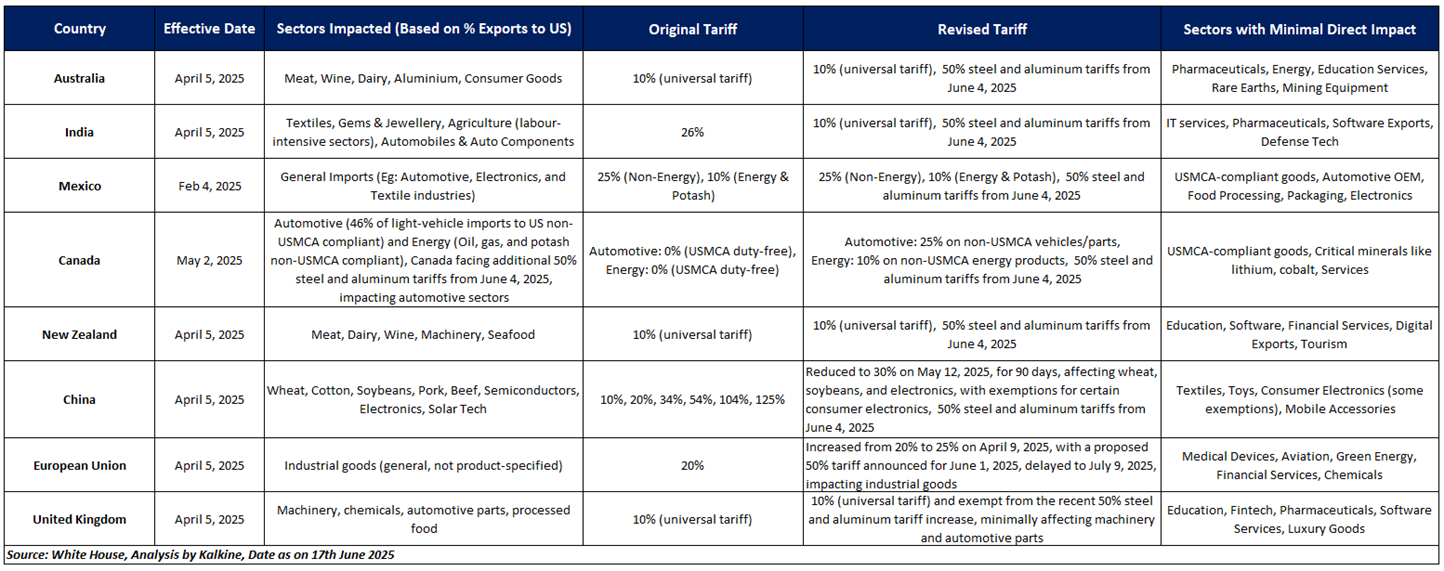
As illustrated in the table below, several key sectors in different countries are directly impacted by the recent tariff announcement from President Trump.

Key Highlights


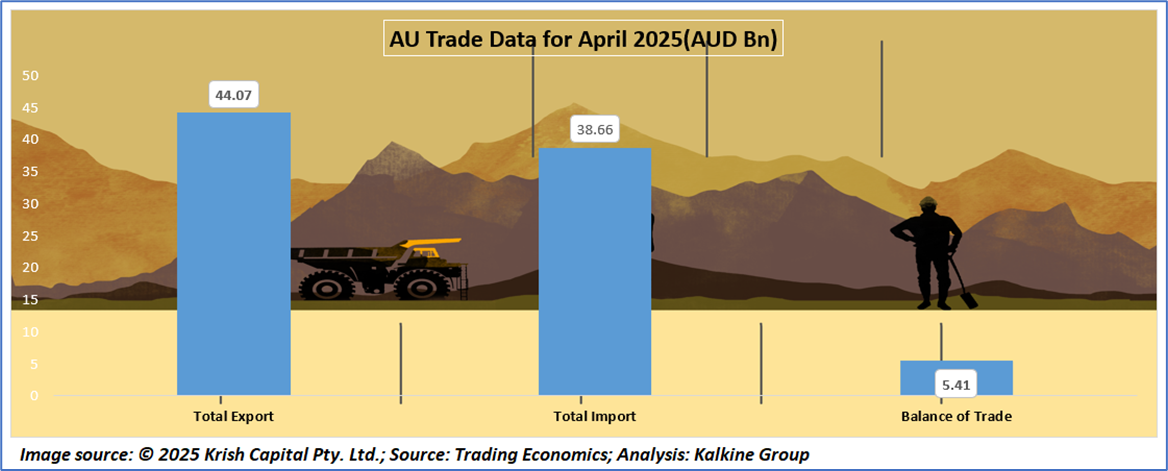
As of April 2025, Australia’s trade balance stood at AUD 5.4 billion, down from AUD 6.9 billion in the previous month. Exports reached AUD 44.1 billion, while imports slightly increased to AUD 38.7 billion. The current account deficit narrowed to AUD 14.7 billion in March, with the current account-to-GDP ratio improving to -2.1%. External debt hit a record AUD 2.68 trillion, and terms of trade slightly declined to 119 points. Tourist arrivals dropped to 641,150 in April, and crude oil production hit a low of 235,000 barrels per day.

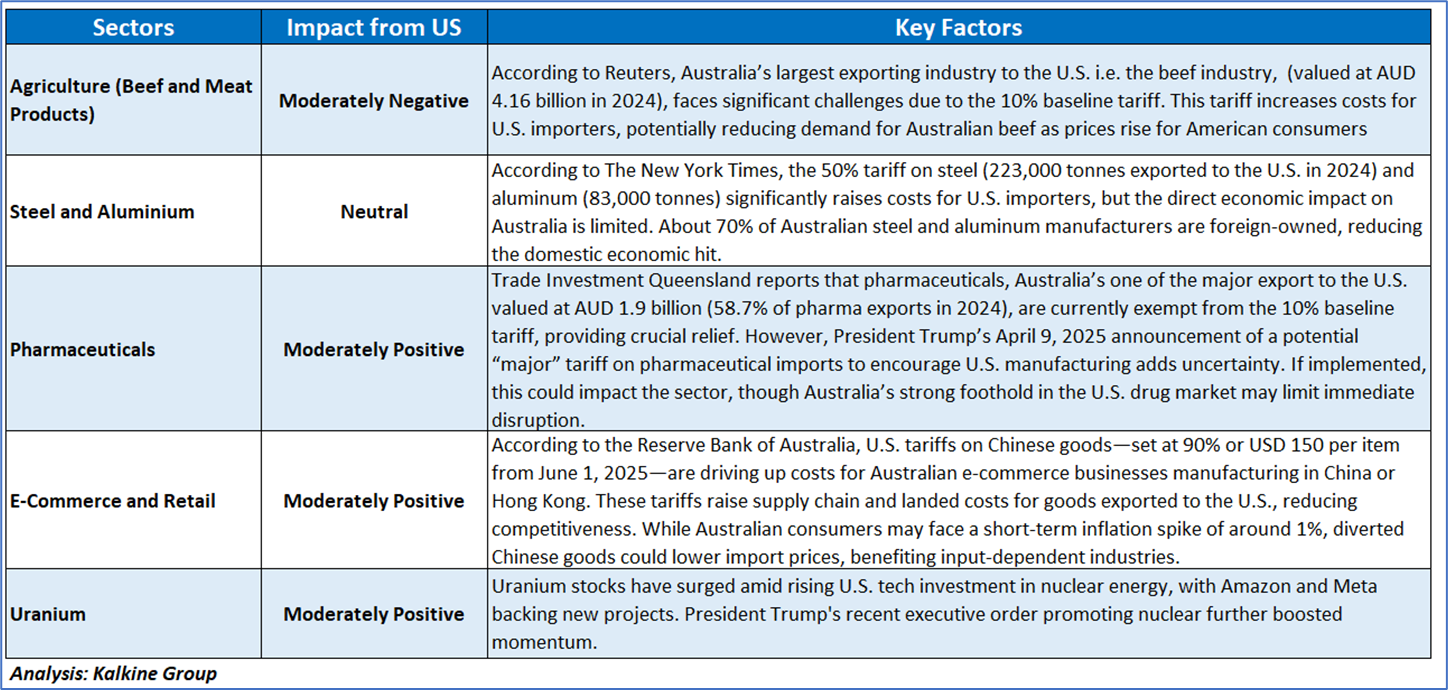
While U.S. tariffs present challenges, Australia's limited export exposure and key exemptions—such as pharmaceuticals—help contain direct impacts. Pressure is greatest on beef and mining, but government support and diversified markets provide resilience. The bigger concern lies in indirect risks, including a global trade war or a slowdown in China, which could weaken commodity prices and demand. Despite broader trade tensions, Australia's uranium sector is seeing sturdy upside. Surging U.S. tech investment in nuclear energy—driven by major players like Amazon and Meta—has boosted market confidence. President Trump’s executive order prioritizing nuclear power added further momentum. Amazon’s backing of U.S.-based X-energy sparked rally in ASX-listed uranium miners, highlighting renewed investor optimism and global demand for clean energy.

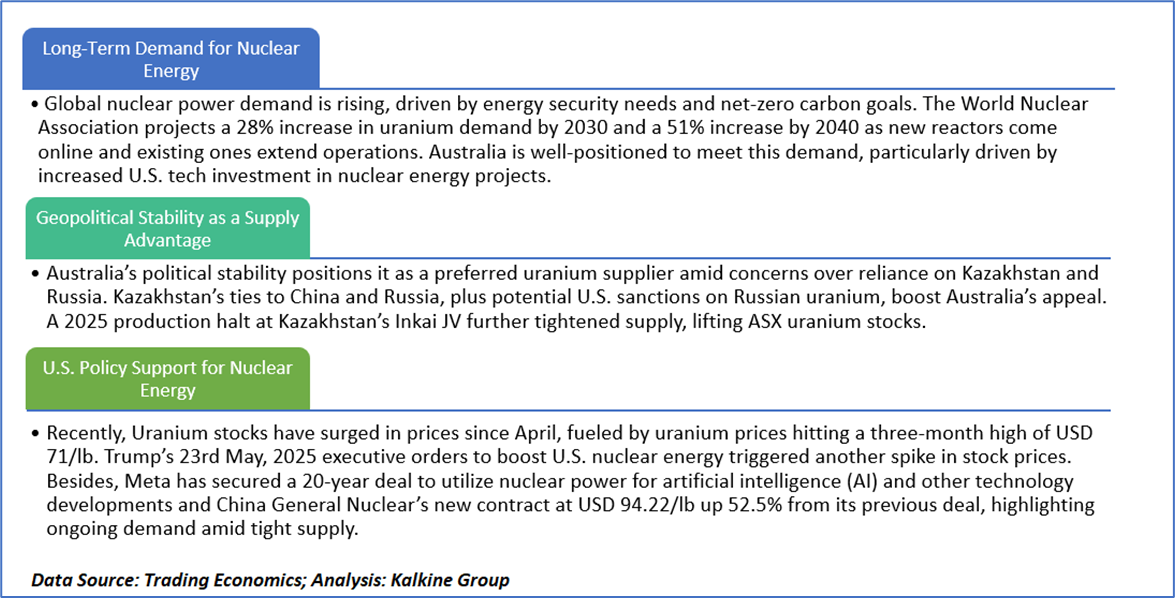
Australia’s uranium sector stands out for its rising global demand, tightening supply, and geopolitical stability. While tariff-related volatility may create short-term noise, the long-term outlook remains on track. Rising global nuclear energy needs—driven by energy security and net-zero goals—alongside growing U.S. tech investment, position Australia as a reliable supplier. Disruptions like Kazakhstan’s 2025 Inkai JV halt have only strengthened investor interest, lifting ASX uranium stocks.
Amid elevated Market Volatility and Tariff pressures, Paladin Energy Limited (ASX: PDN) stands out as a defensive pick within the Uranium sector, supported by rigorous fundamental and technical research
Kalkine’s Global Tariff Report covers the Investment Highlights, Key Financial Metrics, Risks, Technical Analysis along with the Valuation, Target Price, and Recommendation on the Paladin Energy Limited (ASX: PDN).
Section 1: Company Overview and Fundamentals Insights
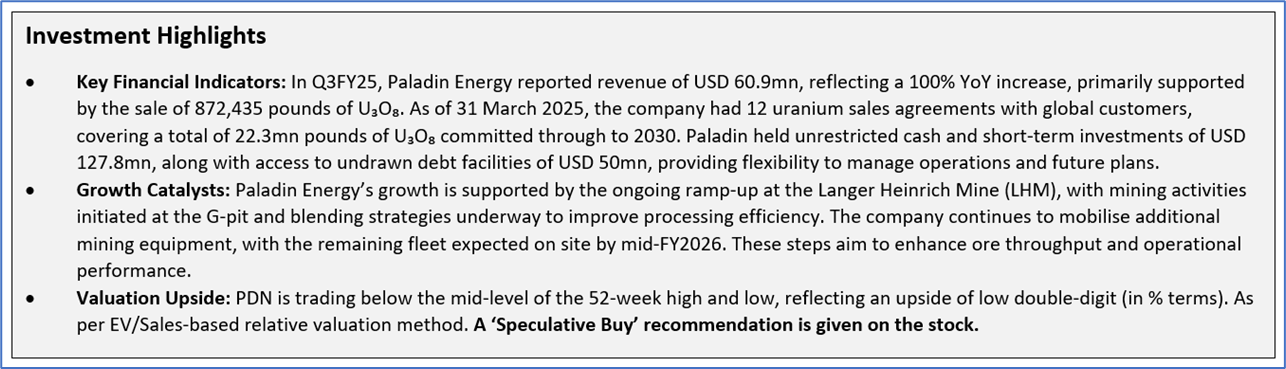
Company Overview: Paladin Energy Limited (ASX: PDN) is engaged in the development, exploration, evaluation, and operation of uranium mining projects across Australia, Canada, and Namibia. The company focuses on advancing its uranium portfolio to support the growing global demand for clean energy solutions. Kalkine’s Global Tariff Report covers the Investment Highlights, Key Financial Metrics, Risks, and Technical Analysis along with the Valuation, Target Price, and Recommendation on the stock.
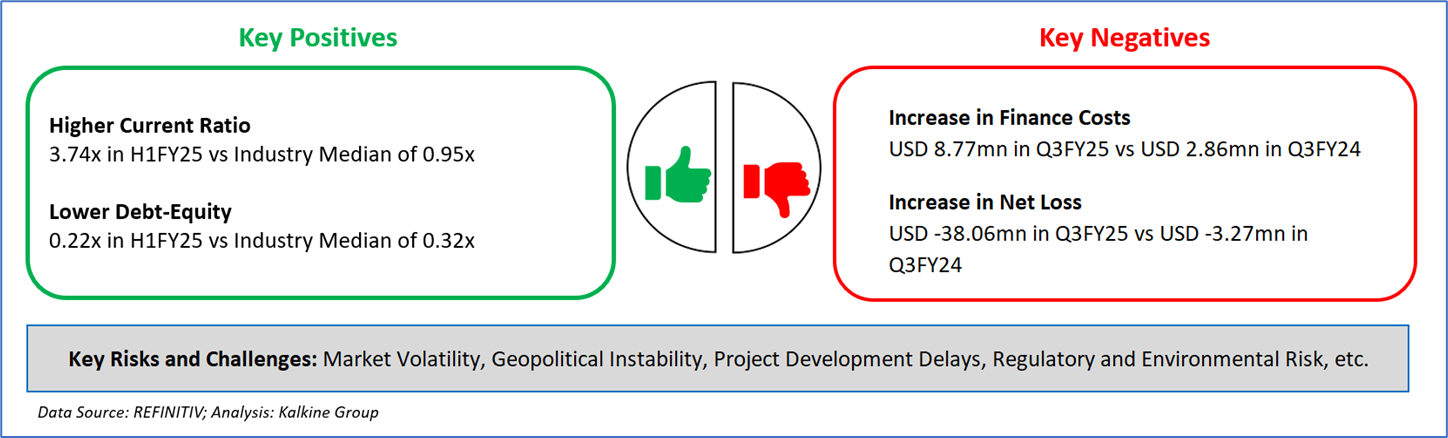
1.2 The Key Positives, Negatives, Investment Highlights, and Risks
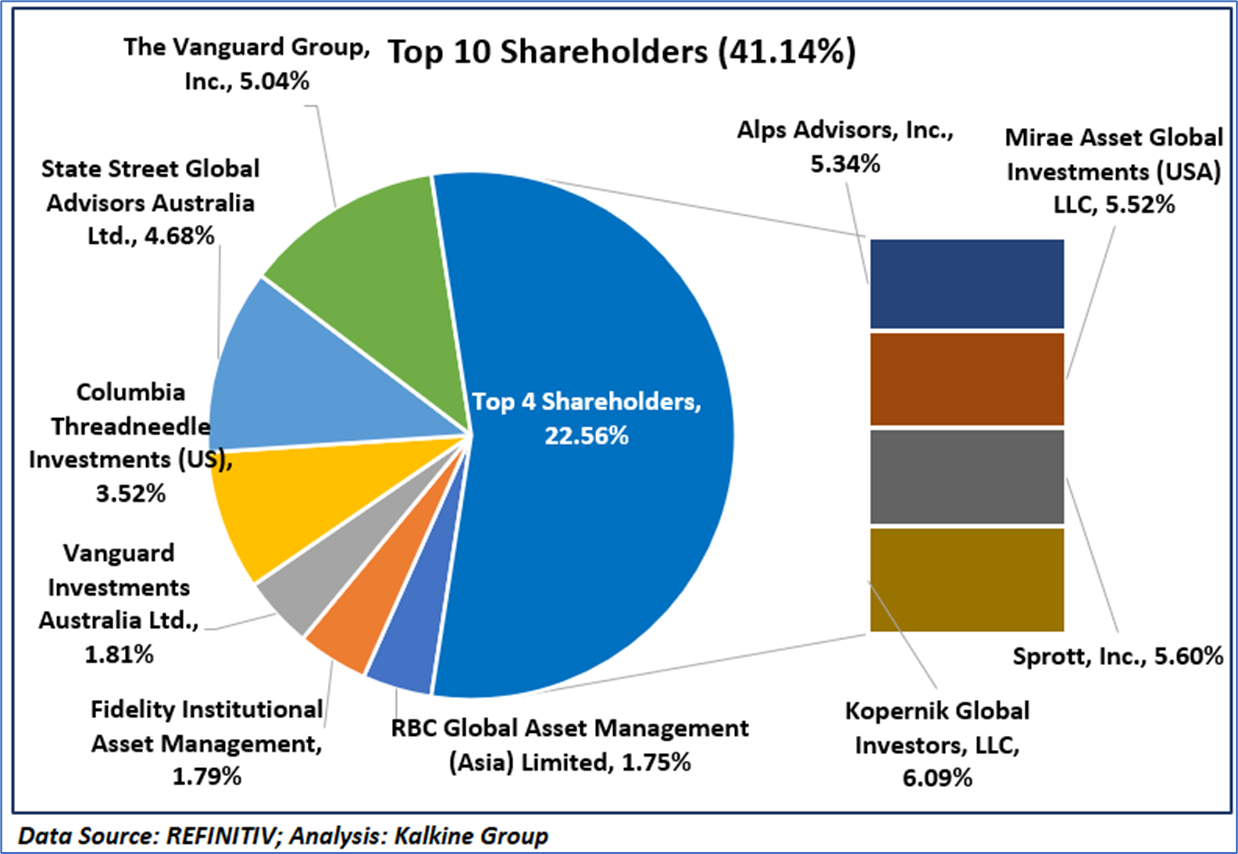
1.3 Top 10 Shareholders:
The top 10 shareholders together form ~41.14% of the total shareholding. Kopernik Global Investors, LLC and Sprott, Inc. hold maximum stakes of 6.09% and 5.60%, respectively.
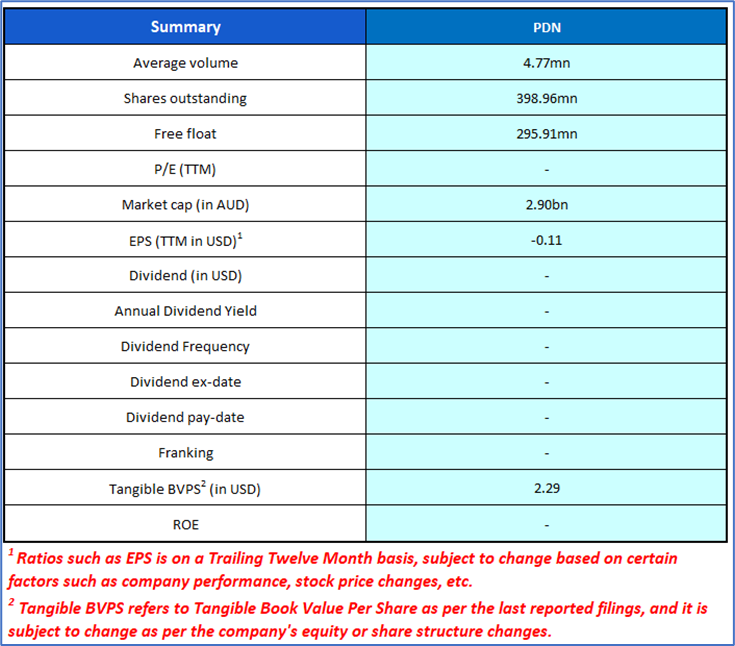
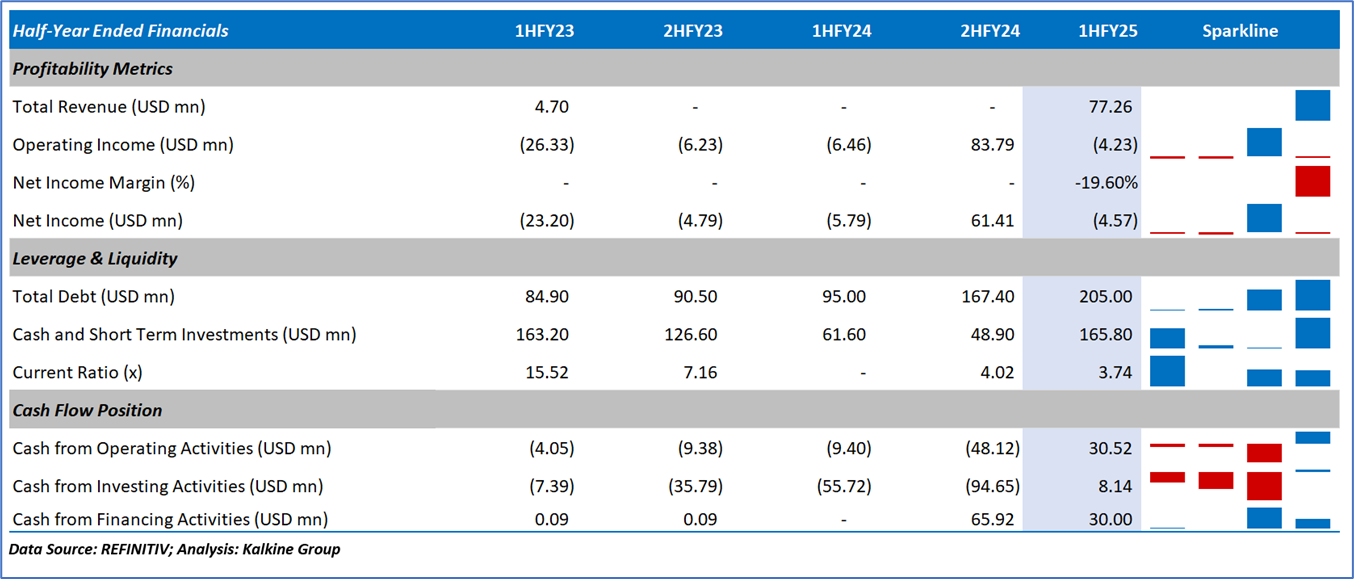
1.4 Key Metrics: PDN’s current ratio stood at 3.74x in 1HFY25, as compared to 0.95x of Industry Median. Below is captured other metrics:
Section 2: Business Updates, Financial and Operational Highlights
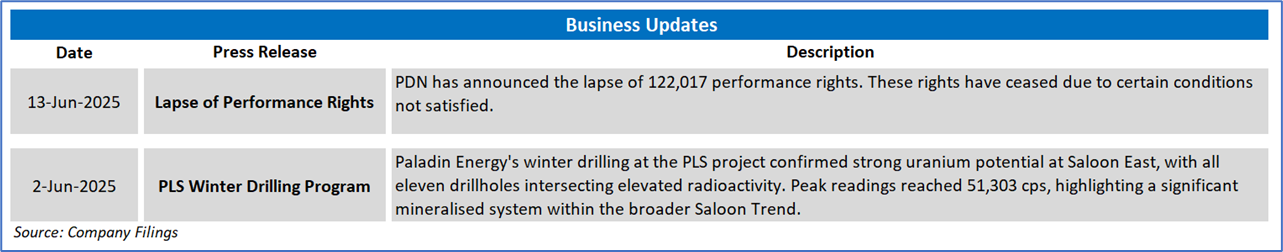
2.1 Recent Business Updates:
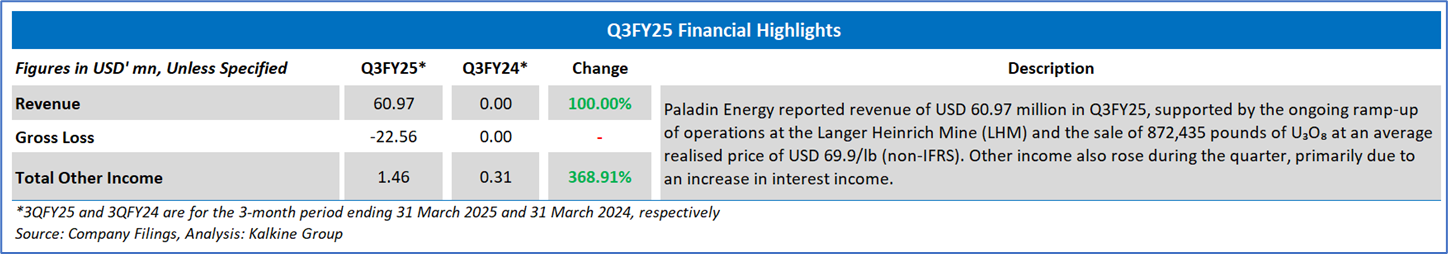
2.2 Q3FY25 Results Highlights (for the 03 months ended 31 March 2025): Below mentioned are some key financial highlights:
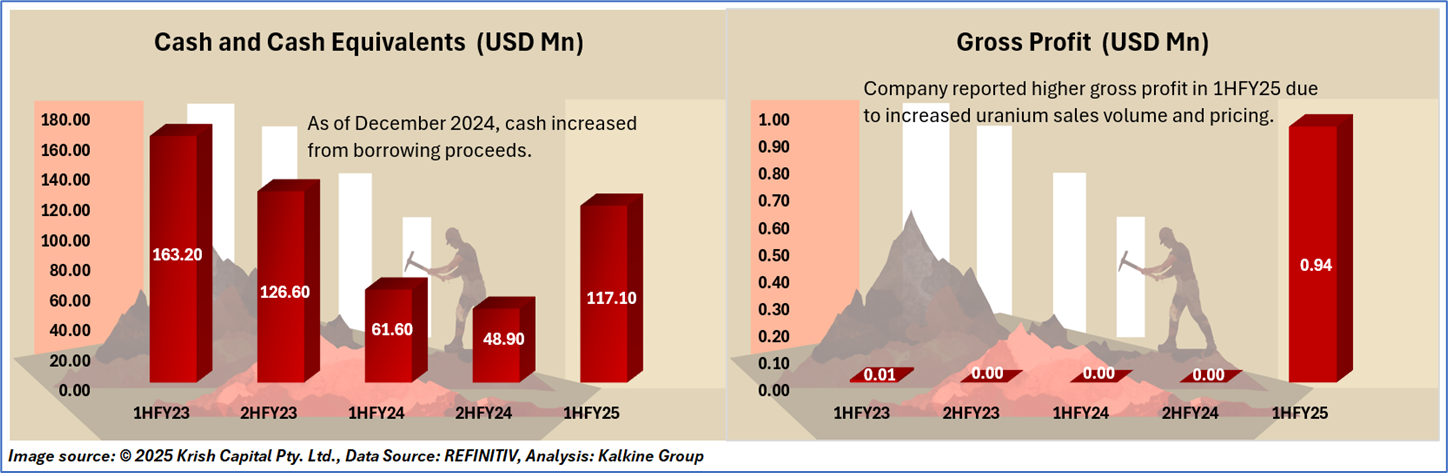
2.3 Historical Financial Trend
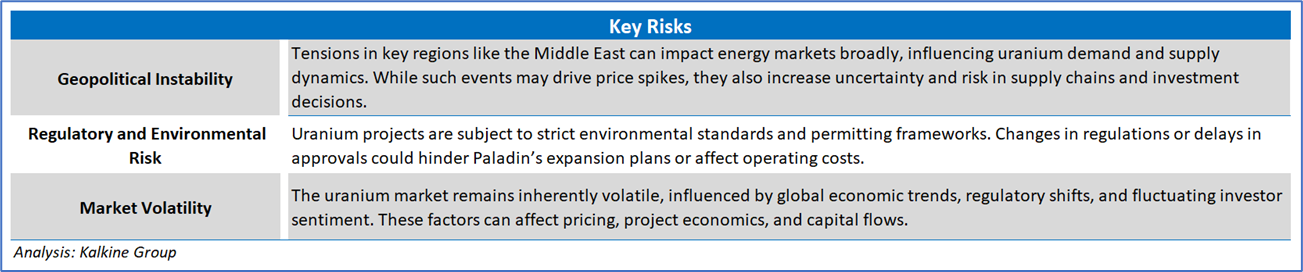
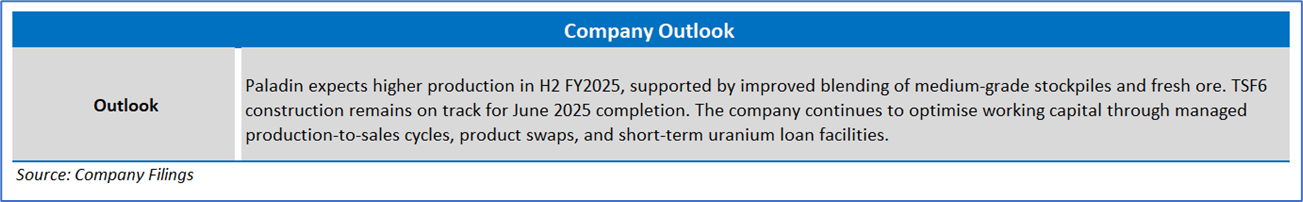
Section 3: Key Risks and Outlook:
Section 4: Stock Recommendation Summary
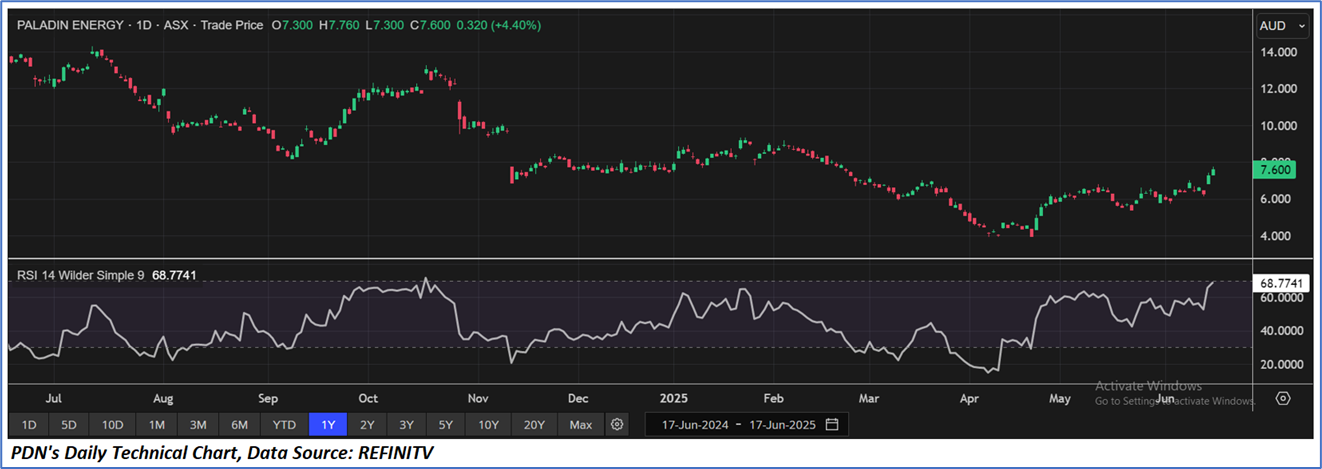
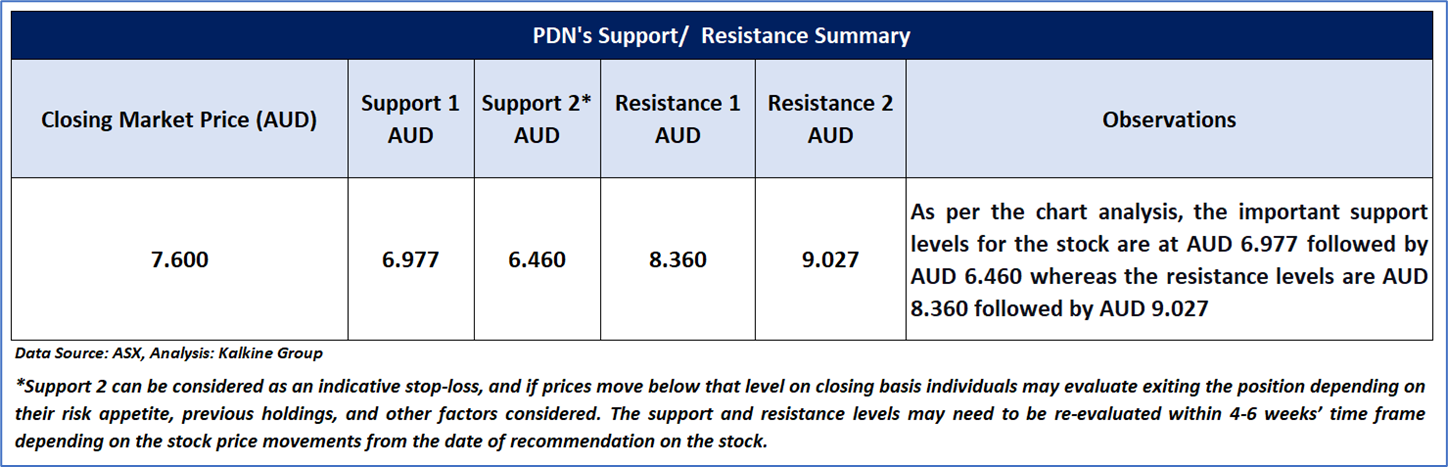
4.1 Price Performance and Technical Summary
The stock has increased by ~13.26% in the last three months, and over the past one year, stock has increased by ~1.74%. The stock has a 52-week low and 52-week high of USD 3.930 and USD 14.280, respectively, and is currently trading below the 52-week high-low average. PDN was last covered in a report dated ‘27 May 2025’.
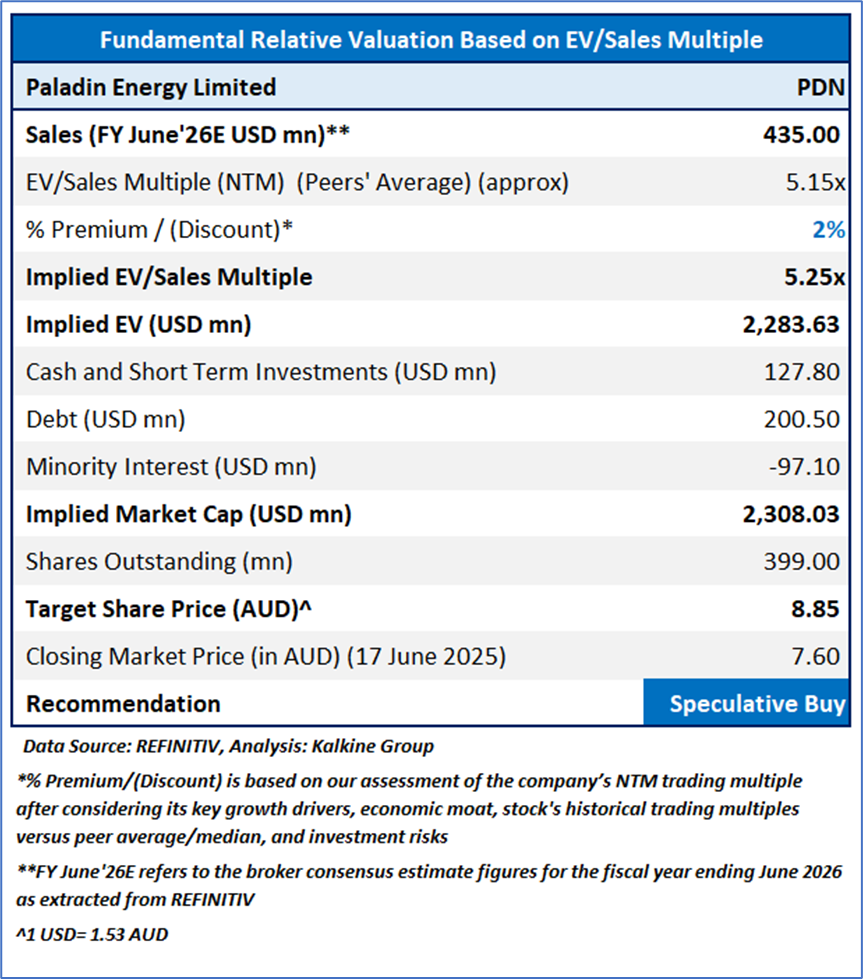
4.2 Fundamental Valuation
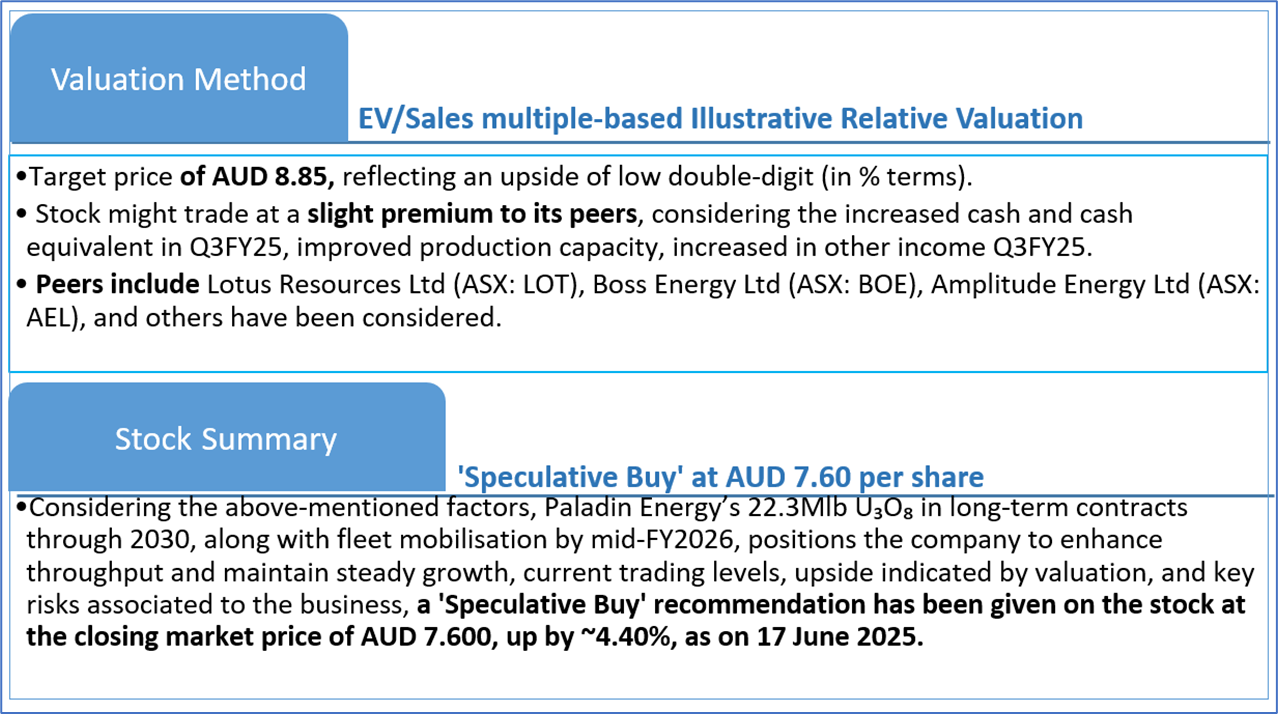
Valuation Methodology: EV/Sales Multiple Based Relative Valuation (Illustrative)
Markets are trading in a highly volatile zone currently due to certain macro-economic issues and geopolitical tensions prevailing. Therefore, it is prudent to follow a cautious approach while investing.
Note 1: Past performance is neither an indicator nor a guarantee of future performance.
Note 2: The reference date for all price data, currency, technical indicators, support, and resistance levels is 17 June 2025. The reference data in this report has been partly sourced from REFINITIV.
Note 3: Investment decisions should be made depending on an individual's appetite for upside potential, risks, holding duration, and any previous holdings. An 'Exit' from the stock can be considered if the Target Price mentioned as per the Valuation and or the technical levels provided has been achieved and is subject to the factors discussed above.
Note 4: Kalkine reports are prepared based on the stock prices captured either from REFINITIV or Trading View. Typically, REFINITIV or Trading View may reflect stock prices with a delay which could be a lag of 25-30 minutes. There can be no assurance that future results or events will be consistent with the information provided in the report. The information is subject to change without any prior notice.
Technical Indicators Defined: -
Support: A level at which the stock prices tend to find support if they are falling, and a downtrend may take a pause backed by demand or buying interest. Support 1 refers to the nearby support level for the stock and if the price breaches the level, then Support 2 may act as the crucial support level for the stock.
Resistance: A level at which the stock prices tend to find resistance when they are rising, and an uptrend may take a pause due to profit booking or selling interest. Resistance 1 refers to the nearby resistance level for the stock and if the price surpasses the level, then Resistance 2 may act as the crucial resistance level for the stock.
Stop-loss: It is a level to protect further losses in case of unfavourable movement in the stock prices.
This report has been issued by Kalkine Pty Limited (ABN 34 154 808 312) (Australian financial services licence number 425376) (“Kalkine”) and prepared by Kalkine and its related bodies corporate authorised to provide general financial product advice. Kalkine.com.au and associated pages are published by Kalkine.
Any advice provided in this report is general advice only and does not take into account your objectives, financial situation or needs. You should therefore consider whether the advice is appropriate to your objectives, financial situation and needs before acting upon it.
There may be a Product Disclosure Statement, Information Statement or other offer document for the securities or other financial products referred to in Kalkine reports. You should obtain a copy of the relevant Product Disclosure Statement, Information Statement or offer document and consider the statement or document before making any decision about whether to acquire the security or product.
Choosing an investment is an important decision. If you do not feel confident making a decision based on the recommendations Kalkine has made in our reports, you should consider seeking advice from a financial adviser, stockbroker or other professional (including taxation and legal advice) before acting on any advice in this report or on the Kalkine website. Not all investments are appropriate for all people.
The information in this report and on the Kalkine website has been prepared from a wide variety of sources, which Kalkine, to the best of its knowledge and belief, considers accurate. Kalkine has made every effort to ensure the reliability of information contained in its reports, newsletters and websites. All information represents our views at the date of publication and may change without notice. The information in this report does not constitute an offer to sell securities or other financial products or a solicitation of an offer to buy securities or other financial products. Our reports contain general recommendations to invest in securities and other financial products.
Kalkine is not responsible for, and does not guarantee, the performance of the investments mentioned in this report This report may contain information on past performance of particular investments. Past performance is not an indicator of future performance. Hypothetical returns may not reflect actual performance. Any displays of potential investment opportunities are for sample purposes only and may not actually be available to investors. To the extent permitted by law, Kalkine excludes all liability for any loss or damage arising from the use of this report, the Kalkine website and any information published on the Kalkine website (including any indirect or consequential loss, any data loss or data corruption). If the law prohibits this exclusion, Kalkine hereby limits its liability, to the extent permitted by law, to the resupply of services..
Please also read our Terms & Conditions and Financial Services Guide for further information. Employees and/or associates of Kalkine and its related entities may hold interests in the securities or other financial products covered in this report or on the Kalkine website. Any such employees and associates are required to comply with certain safeguards, procedures and disclosures as required by law.
Kalkine Media Pty Ltd, an affiliate of Kalkine Pty Ltd, may have received, or be entitled to receive, financial consideration in connection with providing information about certain entity(s) covered on its website including entities covered in this Report.
Past performance is not a reliable indicator of future performance.
 Please wait processing your request...