
Company Overview: Pacific Smiles Group Limited operates dental centers at which independent dentists practice and provide clinical treatments and services. The Company owns and operates approximately two dental center networks in Australia, one being Pacific Smiles Dental and the other, nib Dental Care Centers. The Company has approximately 50 Pacific Smiles Dental Centers and over seven nib Dental Care Centers. The Company offers APPEx training program, which is a service and patient care program. The Company's Dental Center Network is located at Belconnen, Manuka, Tuggeranong and Woden in Australian Capital Territory (ACT); Jesmond, Toronto, Blacktown and Narellan in New South Wales; Bendigo, Drysdale, Point Cook, Traralgon, Waurn Ponds and Warragul in Victoria, and Bribie Island, Browns Plains, Deception Bay, Morayfield, Mount Ommaney and Strathpine in Queensland. Its subsidiaries include Dentist Smiles Group Pty Limited and Dental Assistant Training Solutions Pty Limited.
.png)
PSQ Details
Growth Driven by New and Existing Centres: Pacific Smiles Group (ASX: PSQ) is an Australia-based company, which deals in dental care business and operates with over 90 dental centers. The company also provides additional services, which include support staff, materials, marketing and administrative facilities. For the year ended 30 June 2019, the company reported revenue amounting to $122.2 million, up 16.9% year over year. The increase was backed by growth in new centres opened in FY18 and FY19, along with robust fees from patients in the same centres. During the year, the patient fee grew around 13.9% amounting to $187.4 million. The number of dental centres grew by 11.3% to 89 in FY19. Underlying EBITDA for the year stood at $22.8 million, up 6% year over year. EBITDA was impacted by better-than-expected $0.7 million of telecommunication infrastructure expenditure and a lower than expected fees per appointment of $0.4 million. In FY19, NPAT came in at $8.9 million as compared to $9.3 million reported in FY18. The company declared a final dividend of 3.5 cents per share in FY19.
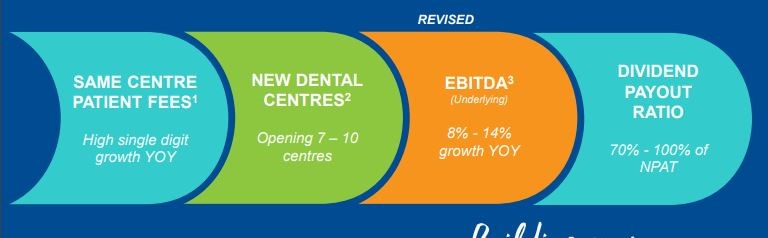
For FY20, the company expects same centre patient fees to grow in high single-digit. Further, the company expects to open around 7 to 10 new dental centres. Underlying EBITDA is expected to grow in the range of 8% to 14%. The dividend pay-out ratio is expected to be between 70-100% of NPAT.
The company witnessed a compound annual growth rate of 63.1% in revenue in the time span of FY15-FY19. Over the above stated period, the company reported continuous increase in same centre patient fee, with the highest growth reported in FY19 at 8.6%. Growth strengthened as the centres matured, delivering more than the expected uplift in FY19. In addition, the company also reported decent growth from less mature centres with utilisation pacing up.
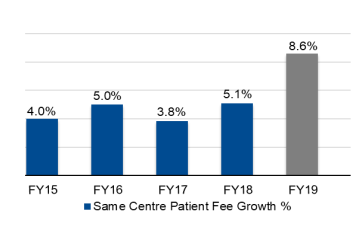
Growth in Same Centre Patient Fee (Source: Company Reports)
FY19 Performance Driven by Robust Patient Fee: During the period, revenues soared up 16.9% to $122.2 million. Gross profit in FY19 came in at $110.3 million, up 14.4% year over year. Underlying EBITDA for the period was $22.8 million, up 6% year over year. NPAT came in at $8.9 million, down 3.5% from the year-ago figure. Earnings per share stood at 5.9 cents per share as compared to 6.1 cents per share reported in FY18. EBITDA margins came in at 18.7%, down from 20.6% from the year-ago period. Patient fee for the year increased approximately 13.9% and came in at $187.4 million. Number of dental centres at the end of the period stood at 89. Corporate costs during the year amounted to 6.2% of patient fees, up from 6% in FY 2018.
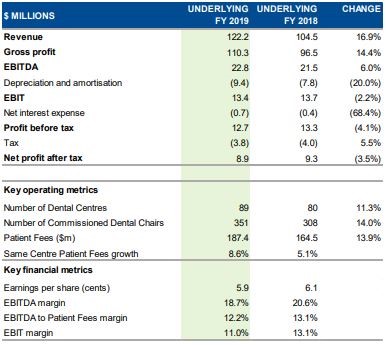
FY19 Results (Source: Company Reports)
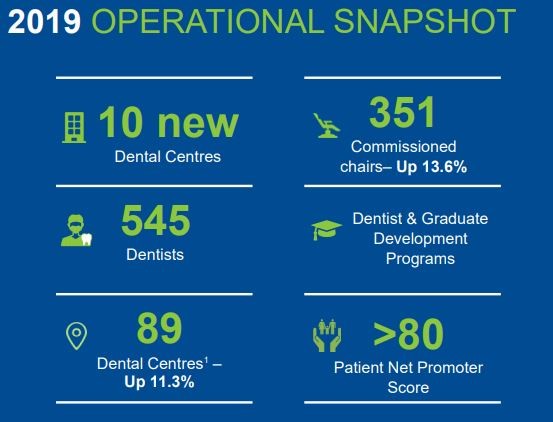
Operational Highlights (Source: Company Reports)
Factors Impacting Revenues: Top-line was positively impacted by robust growth in new centres, which were opened in FY18 and FY19, coupled with higher fees from patients in the same centres. Also, higher investment in new roles and learning and development will aid the growth of the company, going forward. In FY19, the company opened a total of 17 new centres. This move also positively impacted the top-line growth.
Balance Sheet Position: At the end of the year, the company reported cash and cash equivalents of $6.95 million. The company also reported total borrowings of $17 million, up from $5.0 million in FY18, representing the funds’ requirement for expansion of the dental centre network and upgrades of existing facilities, equipment and systems. During the period, the company declared a full year dividend of 3.5 cents per share. Total dividends for FY19 represented 98.8% of underlying NPAT.
Cash Flow Position: Operating cash inflow in FY19 came in at $21.03 million as compared to $17.45 million in FY18. Net cash outflow from investing activities amounted to $16.49 million, and financing cash outflow was reported at $4.27 million. Net capital expenditure for the period came in $16.5 million, representing payments made for developing new centres, upgradation and relocation of existing centres, equipment replacements, IT infrastructure investments, etc.
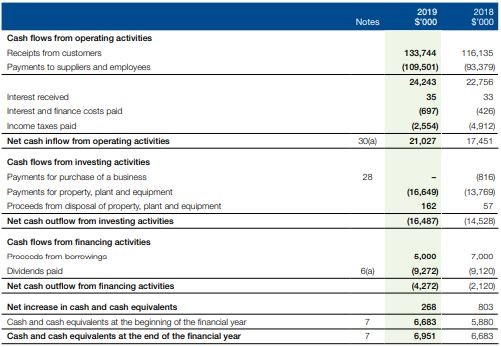
Cash Flow Statement(Source: Company Reports)
In FY19, the company has laid sustainable foundations for growth, with management of the operational cost base through infrastructure cost reductions, increased utilization of centres, opening of new centres, etc. With the above scenario in place, the company is confident about retaining its existing customer base and expects to maintain a dominant growth momentum in FY20.
Digging into Pacific Smiles Group’s Recent Updates:
a. Shareholding Update: On 16th December 2019, the company issued an announcement stating that TDM Growth Partners Pty Limited and its Associates, which is a substantial holder of the company, has increased its voting power from 22.80% to 23.03%.
b. Director’s Interest Update: One of the company’s directors, Benjamin Gisz, who holds an indirect interest in the company’s ordinary shares, acquired 350,000 ordinary shares for $1.65. Total number of securities held after acquisition stood at 35,009,952. As per another release dated 13th December 2019, the company announced that Alexander John Abrahams, one of the company’s directors, disposed of 900,000 fully paid ordinary shares at $1.65 per share.
Top 10 Shareholders: The top 10 shareholders have been highlighted in the table, which together form around 72.62% of the total shareholding. TDM Growth Partners is the entity, holding maximum shares in the company at 23.03%. Abrahams (Alexander) is the second largest shareholder, with a holding of 20.28%.
.png)
Top Ten Shareholders (Source: Thomson Reuters)
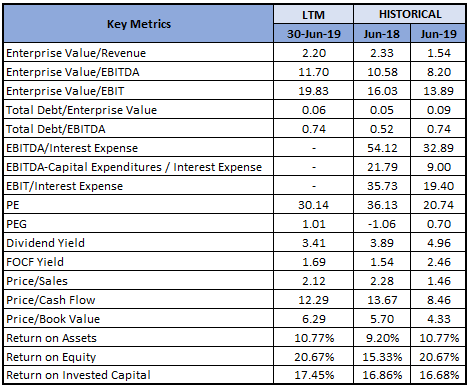
Key Metrics: In FY19, the company had a gross margin, EBITDA margin and net margin of 82.6%, 18.8% and 7.0%, which were higher than the industry margins of 37.2%, 15.3% and 3.6%, respectively. EBITDA margin and net margin were also higher than the margins of FY18, representing decent fundamentals. Debt-to-equity multiple for the year stood higher than the previous year at 0.41x, as a result of funds raised for expansion and upgradation of existing centres, which will further drive growth in the business..png)
Key Metrics (Source: Thomson Reuters)
Outlook: The company is taking necessary measures to open news centres in the coming years, which will eventually contribute to long-term growth and profit margins of the company. Further, the company expects to achieve a long-term target to open around 250 centres having more than 5% of total market share. The company’s long-term strategies involve network growth via existing centres, extending range of services and opening hours along with high functional leadership. The company also aims to increase operational efficiencies by matching patients’ demand with supply constraint, carrying out cost review program, streamline the entire process and system thereby improving the payment channels. For FY2020, the company expects same centre patient fees to grow in high single-digit. Further, the company expects to open around 7 to 10 new dental centres. Underlying EBITDA is expected to grow in the range of 8% -14%. Dividend pay-out ratio is expected to be between 70-100% of NPAT.
FY20 Guidance (Source: Company Reports)
Key Valuation Metrics (Source: Thomson Reuters)
Valuation Methodologies
Method 1: Price to Cash Flow Multiple Approach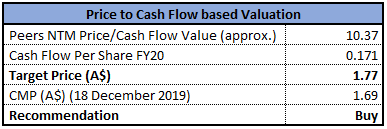
Price to Cash Flow Based Valuation (Source: Thomson Reuters)
Method 2: EV/EBITDA Multiple Approach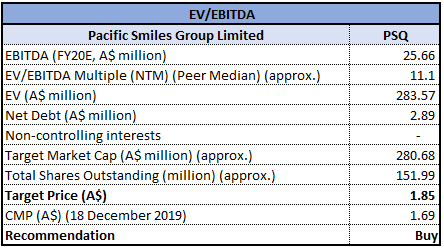
EV/EBITDA Based Valuation (Source: Thomson Reuters)
Note: All forecasted figures have been taken from Thomson Reuters
Stock Recommendation: The stock of the company generated positive returns of 4.9% and 37.1% over a period of 3 months and 6 months, respectively. In FY19, the company delivered a stellar result, driven by increase in new centres which the company inaugurated in FY18 and FY19 coupled with strong fees from patients in the same centres. During the year, the company continued to report high levels of patient satisfaction, reporting pleasing Net Promoter Score results above 80, high by most benchmarks. To drive further growth, the company is taking necessary measures to open news centres in the coming years, which will eventually contribute to the long-term growth and profit margins of the company. From the analysis standpoint, the company has recorded revenue growth at CAGR of 63.1% over the last four years. In the first 7 weeks of FY20, the company reported an approximate growth of 12.2% in same centre patient fee, which enhances the confidence in the guidance provided. In addition, the newly opened centres and the plans for increasing the number further, is a representative of strength and commitment of the business. Considering the above factors, we have valued the stock using two relative valuation methods, i.e., Price to cash flow and EV/EBITDA multiples, and have arrived at a target price of high single-digit upside (in % term). Hence, we recommend a “Buy” rating on the stock at the current market price of $1.690, down 0.588% on 18th December 2019.
.png)
PSQ Daily Technical Chart (Source: Thomson Reuters)
Disclaimer
The advice given by Kalkine Pty Ltd and provided on this website is general information only and it does not take into account your investment objectives, financial situation or needs. You should therefore consider whether the advice is appropriate to your investment objectives, financial situation and needs before acting upon it. You should seek advice from a financial adviser, stockbroker or other professional (including taxation and legal advice) as necessary before acting on any advice. Not all investments are appropriate for all people. Kalkine.com.au and associated pages are published by Kalkine Pty Ltd ABN 34 154 808 312 (Australian Financial Services License Number 425376). The information on this website has been prepared from a wide variety of sources, which Kalkine Pty Ltd, to the best of its knowledge and belief, considers accurate. You should make your own enquiries about any investments and we strongly suggest you seek advice before acting upon any recommendation. Kalkine Pty Ltd has made every effort to ensure the reliability of information contained in its newsletters and websites. All information represents our views at the date of publication and may change without notice. To the extent permitted by law, Kalkine Pty Ltd excludes all liability for any loss or damage arising from the use of this website and any information published (including any indirect or consequential loss, any data loss or data corruption). If the law prohibits this exclusion, Kalkine Pty Ltd hereby limits its liability, to the extent permitted by law to the resupply of services. There may be a product disclosure statement or other offer document for the securities and financial products we write about in Kalkine Reports. You should obtain a copy of the product disclosure statement or offer document before making any decision about whether to acquire the security or product. The link to our Terms & Conditions has been provided please go through them and also have a read of the Financial Services Guide. On the date of publishing this report (mentioned on the website), employees and/or associates of Kalkine Pty Ltd do not hold positions in any of the stocks covered on the website. These stocks can change any time and readers of the reports should not consider these stocks as personalised advice.
Past performance is not a reliable indicator of future performance.
 Please wait processing your request...