Kalkine has a fully transformed New Avatar.
Company Overview: Acme United Corporation (NYSE: ACU) is a supplier of first aid and medical products and cutting technology to the school, home, office, hardware, sporting goods, and industrial markets.
US Markets Round-Up
This week, the Russell 3000 index, a widely followed benchmark of the US stock market across various market capitalizations, opened on a strong note and maintained its momentum. The index made high of 3155.08 during the week and settled at 3152.989 with a week-to-date (WTD) gain of ~3.625 percent on Aug 15, 2024. Other major indices, such as S&P 500 and NASDAQ Composite displayed downside move for the week. On Aug 15, 2024, the S&P 500 index settled at 5319.31 with a WTD gain of ~0.51% percent, while the NASDAQ Composite Index settled at 17594.496 with a WTD gain 5543.21 of ~ 3.72 percent.
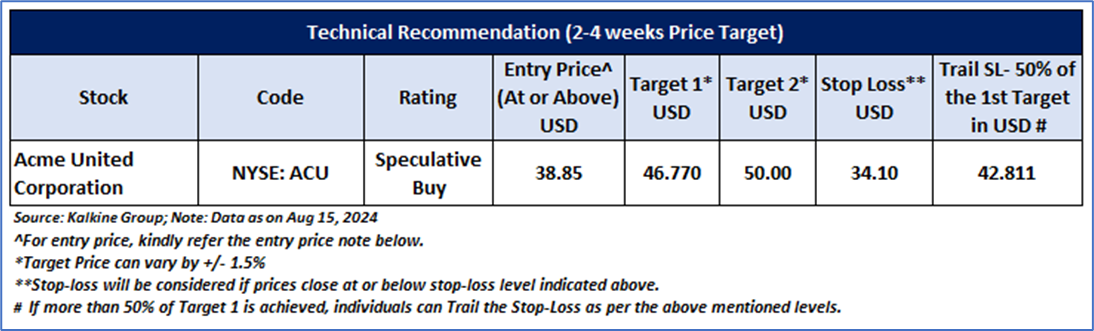
Having understood the US market performance over the week, taking cues from major global news, and based on technical analysis of the Russell 3000 index for the upcoming week, now let’s have a look at the one US-listed stock to pick from the technical standpoint. Noted below recommendation is based on the entry price, target prices, and stop-loss for Acme United Corporation (NYSE: ACU) for the next 2-4 weeks duration:
Acme United Corporation (NYSE: ACU)
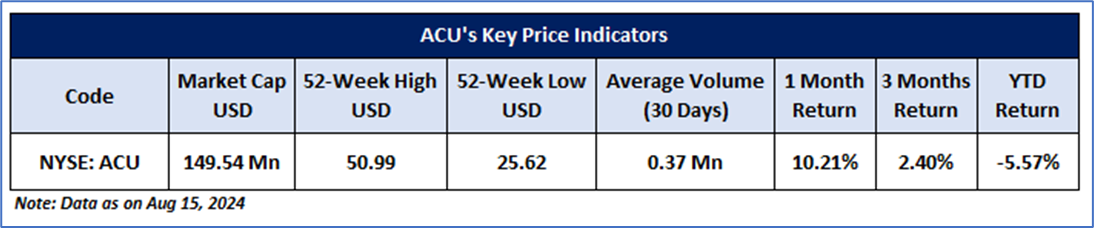
Noted below are the key price indicators for the stock:
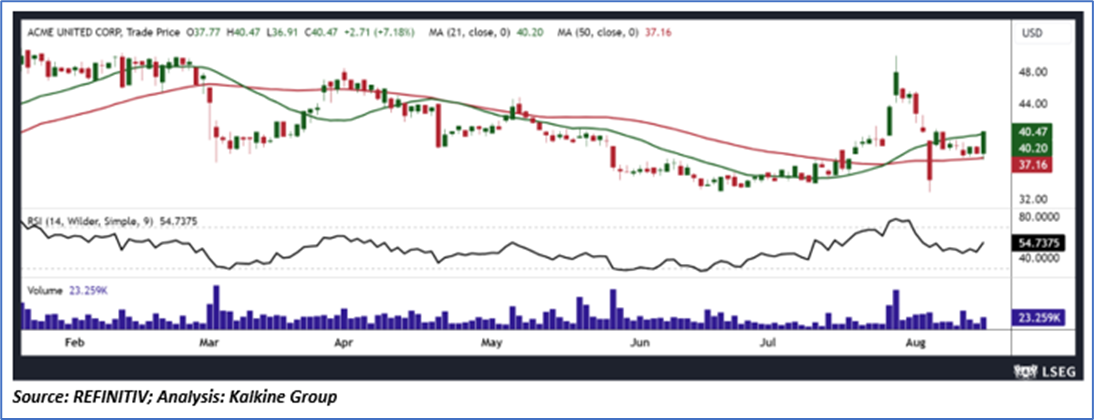
Price Action Analysis (on the daily chart)
ACU's stock price has shown remarkable strength by finding support at critical levels and gradually increasing in value, accompanied by robust trading volume, suggesting a potential near-term uptrend. The stock is poised to face a significant test in the coming 2-4 weeks, with the crucial level of USD 46.77 serving as a major hurdle. If ACU successfully surpasses this threshold, it may trigger a surge of buying activity, potentially driving the stock's value even higher and potentially fueling a further upward trajectory
_08_16_2024_13_20_50_821925.png)
Technical Indicators Analysis (On the daily chart)
The daily chart reveals a notable reversal in the Relative Strength Index (RSI), signalling a significant shift in momentum towards a positive and upward trajectory. This momentum is expected to continue, driving the trend forward in a bullish direction. The robust trading volumes supporting this upward movement underscore the strength and persistence of the momentum. Furthermore, the stock's current position above its 21-day and 50-day Simple Moving Averages (SMAs) provides a solid foundation for support, which could help mitigate any short-term price fluctuations and serve as a buffer against potential dips.

General Recommendation
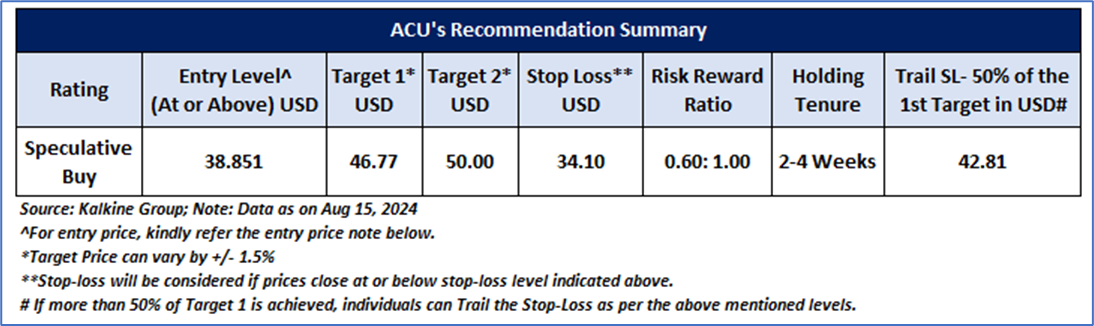
As per the above-mentioned price action and technical indicators analysis, Acme United Corporation (NYSE: ACU) is looking technically well-placed on the chart, and a ‘Speculative Buy’ recommendation has been given on the stock. Investment decision should be made depending on an individual’s appetite for upside potential, risks, and any previous holdings. This recommendation is purely based on technical analysis, and fundamental analysis has not been considered in this report. The summary of recommendation is as follows:
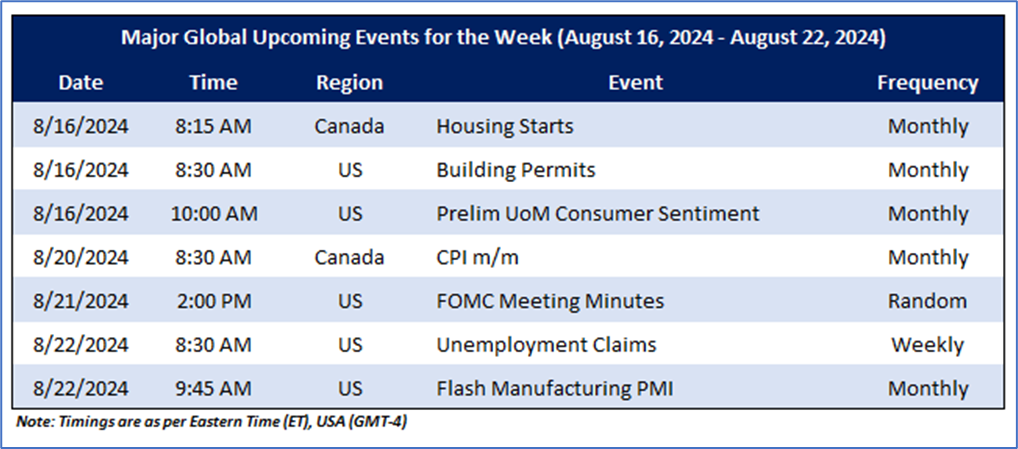
Upcoming Major Global Economic Events
Market events occur daily depending on the data's frequency and generally include updates on FOMC meet, PMI, Unemployment Data, etc. The upcoming week's major global economic events that could impact the S&P/TSX Venture Composite Index and listed stocks' prices are noted below.
Related Risks: This report may be looked at from a high-risk perspective and recommendations are provided for a short duration. Recommendations provided in this report are solely based on technical parameters, and the fundamental performance of the stocks has not been considered in the decision-making process. Other factors which could impact the stock prices include market risks, regulatory risks, interest rates risks, currency risks, social and political instability risks etc.
Note 1: Individuals can consider exiting from the stock if the Target Price or Stop loss mentioned as per the technical analysis has been achieved and subject to the factors discussed above.
Note 2: How to Read the Charts?
The Green colour line reflects the 21-period moving average while the red line indicates the 50- period moving average. SMA helps to identify existing price trend. If the prices are trading above the 21-period and 50-period moving average, then it shows prices are currently trading in a bullish trend.
The Black colour line in the chart’s lower segment reflects the Relative Strength Index (14-Period) which indicates price momentum and signals momentum in trend. A reading of 70 or above suggests overbought status while a reading of 30 or below suggests an oversold status.
The Blue colour bars in the chart’s lower segment show the volume of the stock. The volume is the number of shares that changed hands during a given day. Stocks with high volumes are more liquid than stocks with lesser volume as liquidity in stocks helps in easier and faster execution of the order.
The Orange colour lines are the trend lines drawn by connecting two or more price points and used for trend identification purposes. The trend line also acts as a line of support and resistance.
Technical Indicators Defined: -
Support: A level at which the stock prices tend to find support if they are falling, and a downtrend may take a pause backed by demand or buying interest. Support 1 refers to the nearby support level for the stock and if the price breaches the level, then Support 2 may act as the crucial support level for the stock.
Resistance: A level at which the stock prices tend to find resistance when they are rising, and an uptrend may take a pause due to profit booking or selling interest. Resistance 1 refers to the nearby resistance level for the stock and if the price surpasses the level, then Resistance 2 may act as the crucial resistance level for the stock.
Stop-loss: It is a level to protect further losses in case of unfavourable movement in the stock prices.
Risk Reward Ratio: Risk reward ratio is the difference between an entry point to a stop loss and profit level. This report is based on ~60% Stop Loss of the Target 1 from the entry point.
A trailing stop-loss is a modification of stop-loss in case of favourable movement in the price to protect the gains. Individuals can Trail the Stop-Loss as per the aforementioned levels if the stock price achieves more than 50% of the Target 1. Individuals should consider exiting from the position as per the Trailing Stop-Loss level if the price starts moving downwards after achieving more than 50% of the Target 1.
The reference date for all price data, currency, technical indicators, support, and resistance levels is Aug 15, 2024. The reference data in this report has been partly sourced from REFINITIV.
Abbreviations
CMP: Current Market Price
SMA: Simple Moving Average
RSI: Relative Strength Index
USD: United States dollar
Note: Trading decisions require a thorough analysis by individuals. Technical reports in general chart out metrics that may be assessed by individuals before any stock evaluation. The above are illustrative analytical factors used for evaluating the stocks; other parameters can be looked at along with additional risks per se. Past performance is neither an indicator nor a guarantee of future performance.
This report has been issued by Kalkine Pty Limited (ABN 34 154 808 312) (Australian financial services licence number 425376) (“Kalkine”) and prepared by Kalkine and its related bodies corporate authorised to provide general financial product advice. Kalkine.com.au and associated pages are published by Kalkine.
Any advice provided in this report is general advice only and does not take into account your objectives, financial situation or needs. You should therefore consider whether the advice is appropriate to your objectives, financial situation and needs before acting upon it.
There may be a Product Disclosure Statement, Information Statement or other offer document for the securities or other financial products referred to in Kalkine reports. You should obtain a copy of the relevant Product Disclosure Statement, Information Statement or offer document and consider the statement or document before making any decision about whether to acquire the security or product.
Choosing an investment is an important decision. If you do not feel confident making a decision based on the recommendations Kalkine has made in our reports, you should consider seeking advice from a financial adviser, stockbroker or other professional (including taxation and legal advice) before acting on any advice in this report or on the Kalkine website. Not all investments are appropriate for all people.
The information in this report and on the Kalkine website has been prepared from a wide variety of sources, which Kalkine, to the best of its knowledge and belief, considers accurate. Kalkine has made every effort to ensure the reliability of information contained in its reports, newsletters and websites. All information represents our views at the date of publication and may change without notice. The information in this report does not constitute an offer to sell securities or other financial products or a solicitation of an offer to buy securities or other financial products. Our reports contain general recommendations to invest in securities and other financial products.
Kalkine is not responsible for, and does not guarantee, the performance of the investments mentioned in this report This report may contain information on past performance of particular investments. Past performance is not an indicator of future performance. Hypothetical returns may not reflect actual performance. Any displays of potential investment opportunities are for sample purposes only and may not actually be available to investors. To the extent permitted by law, Kalkine excludes all liability for any loss or damage arising from the use of this report, the Kalkine website and any information published on the Kalkine website (including any indirect or consequential loss, any data loss or data corruption). If the law prohibits this exclusion, Kalkine hereby limits its liability, to the extent permitted by law, to the resupply of services..
Please also read our Terms & Conditions and Financial Services Guide for further information. Employees and/or associates of Kalkine and its related entities may hold interests in the securities or other financial products covered in this report or on the Kalkine website. Any such employees and associates are required to comply with certain safeguards, procedures and disclosures as required by law.
Kalkine Media Pty Ltd, an affiliate of Kalkine Pty Ltd, may have received, or be entitled to receive, financial consideration in connection with providing information about certain entity(s) covered on its website including entities covered in this Report.
 Please wait processing your request...