Kalkine has a fully transformed New Avatar.

Company Overview: Oil Search Limited is an oil and gas exploration and production company. The Company is engaged in the exploration for oil and gas fields and the development and production of such fields. The Company's segments include PNG Business Unit (PNG BU), Exploration and Other. The PNG BU segment is engaged in the development, production and sale of liquefied natural gas (LNG), crude oil, natural gas, condensate, naphtha, other refined products and electricity from the Company's interest in its operated assets for Papua New Guinea crude oil and Hides gas-to-electricity operations and from the Company's interest in the PNG LNG Project. The Exploration segment is engaged in the exploration and evaluation of crude oil and gas in Papua New Guinea. The Other segment includes the Company's ownership of drilling rigs, investment and development towards the Company's power strategy and corporate activities. The PNG LNG Project is a 6.9-million tons per annum (MTPA) integrated LNG project.
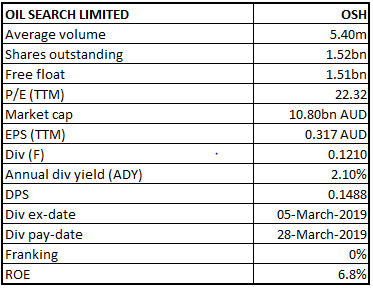
OSH Details
OSH receives a record of decision for its project in Alaska: Oil Search Limited (ASX: OSH) has an engagement in the exploration for oil and gas fields and the development and production of such fields. As on June 12, 2019, the market capitalization of OSH stood at ~$10.8 Bn.
The Company recently announced that it has received the United States Army Corps of Engineers (USACE) permit and record of decision (ROD) for the Pikka Development Project on Alaska’s North Slope, in accordance to the section 404 of the US Clean Water Act. This approval is critical for the next stage in advancing the proposed development. The planned development is located around 52 miles from Deadhorse, Alaska and its closest point is seven miles northeast of the community of Nuiqsut.
This record of decision will allow the company to enter the front-end engineering and design (FEED) phase of the project, which is targeted for the third quarter of 2019. The management stated that a thorough analysis is underway on the data collected from its successful 2018/19 appraisal programme. The early results reinforce the expectations of a likely material upgrade in contingent oil resources and that the development will, at a minimum, meet the Company’s development plan assumptions of delivering 120,000 barrels of oil per day.
The Company has entered into some of the important agreements to increase its production foothold in different regions such as Alaska and Papua New Guinea (PNG). Despite the decline in production and sales volume for CY18, the company has witnessed decent top-line and bottom-line growth for the same period. As per the International Energy Agency (IEA) reports, the outlook for natural gas is bright as Global gas demand is expected to grow by 1.6% annually till the year 2040, as compared to oil and coal demand growth of 0.5% and 0.2% per year, respectively over the same period. Fundamentally, the company looks in a decent position with a net margin of 22.2% and ROE of 6.8% in CY18. Over the last three years (CY16-CY18), the company’s top-line and bottom-line have grown at a CAGR of 11.5 percent and 94.9 percent, respectively. Moreover, the company has also witnessed higher production growth over the years with 5-year CAGR of 6.9%. Moving forward, decent financials, healthy balance sheet along with recent agreement for Pikka Development Project on Alaska’ North Slope are expected to act as tailwinds for Oil Search.
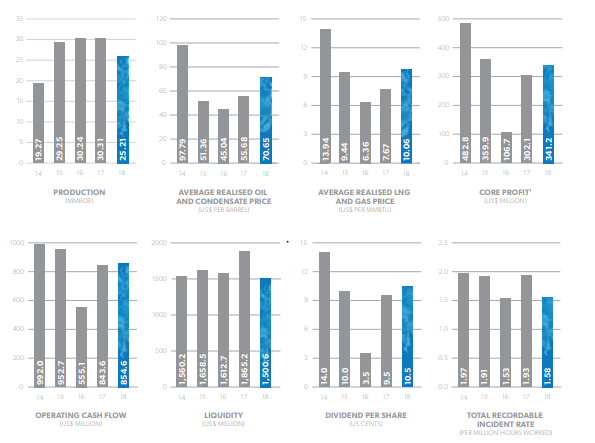
Financial Metrics Trend (Source: Company Reports)
Top 10 Shareholders: The top 10 shareholders have been highlighted in the table which together form around 37.84% of the total shareholding. Mubadala Investment Company PJSC, and Capital Research Global Investors hold maximum interest in the company at 12.89% and 7.59%, respectively.
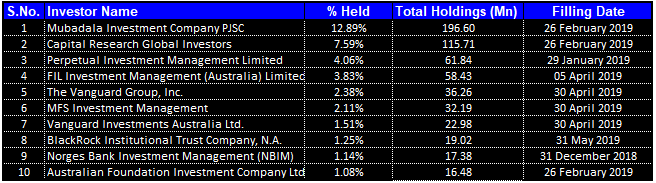
Top 10 Shareholders (Source: Thomson Reuters)
Key Ratios: Gross margin, EBITDA margin, and net margin for CY18 at 54.5%, 68.1%, and 22.2% are better than the industry median of 44.3%, 37.4%, and 13.9%, respectively, implying a decent financial performance by the company than its peer group. Quick ratio for CY18 at 1.09x was also better than the industry median of 1.03x, which indicates that the company is in a better position to address its short-term fund requirements than its peer group.
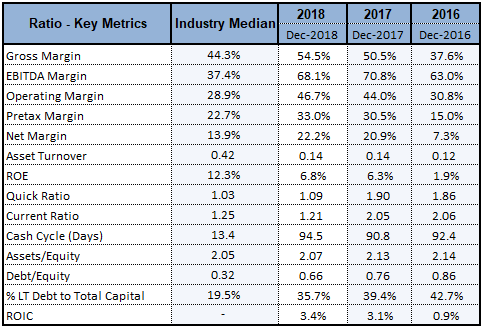
Key Ratios (Source: Thomson Reuters)
Key Highlights of March’19 Quarter: Total production of PNG LNG in the first quarter of 2019 was 7.25 mmboe, reflecting the continued strong performance by the PNG LNG project, offset by lower oil field production. Total sales for Q1CY19 stood at 6.65 mmboe, which was 15% lower than the sales in Q4CY18 at 7.82 mmboe. The lower sales volume was primarily due to the timing of LNG shipments, with three LNG cargoes on the water at the end of the period, compared to one at the end of the previous quarter. The total revenue decreased from US$503.1 Mn in Q4CY18 to US$398.1 Mn in Q1CY19, majorly due to the weaker global energy prices, with the realised oil and condensate price down by 3% and the realised LNG and gas price 7% which was lower than the Q4CY18. Oil Search ended Q1CY19 with the liquidity of US$1.46 Bn, comprising of US$789.5 Mn in cash and US$671 Mn in credit facilities.
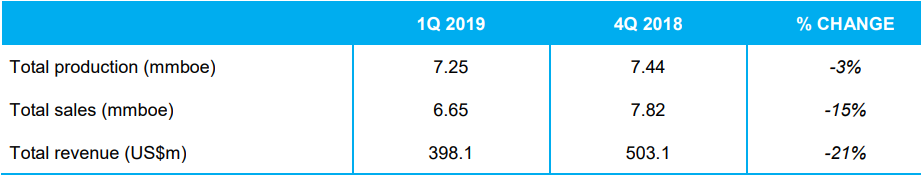
March’19 Quarter Key Metrics (Source: Company Reports)
March’19 Quarter Sales increased by ~30% on pcp: During the March’19 quarter, 29,544 Bn Btu of LNG from the PNG LNG Project was sold, which was 15% lower than sales volumes in the fourth quarter of 2018. A total of 27 LNG cargoes were delivered, where 23 cargoes were sold under contract (including four to PetroChina and BP under mid-term sale and purchase agreements signed in the third quarter of 2018) and four on the spot market, compared to 31 cargoes sold in the previous quarter. Three cargoes were on the water at the end of the period, compared to one at the end of the fourth quarter of 2018. Oil, condensate and naphtha sales volumes for the period totaled 1.25 mmbbl, which was 17% lower than liquid sales in the previous quarter. Additionally, three cargoes of Kutubu Blend and three naphtha cargoes were sold during the period.
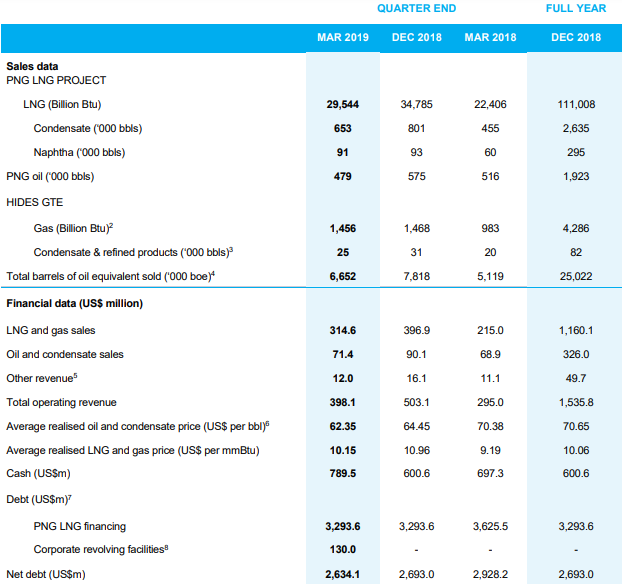
March’19 Quarter Sales and Revenue Metrics (Source: Company Reports)
The average oil and condensate price realised during the quarter was US$62.35 per barrel, which was 3% lower than the previous quarter, reflecting weaker global oil prices. The average price realised for LNG and gas sales decreased by 7% to US$10.15/mmBtu, reflecting the approximate three-month lag between the spot oil price and LNG contract prices. The Company did not undertake any hedging transactions during the period. Total sales revenue from LNG, gas, oil and condensate for the quarter declined by 21% to US$386.1 Mn, primarily driven by the timing of LNG shipments. Other revenue, comprising rig lease income, infrastructure tariffs, electricity, refinery and naphtha sales, decreased from US$16.1 Mn to US$12.0 Mn.
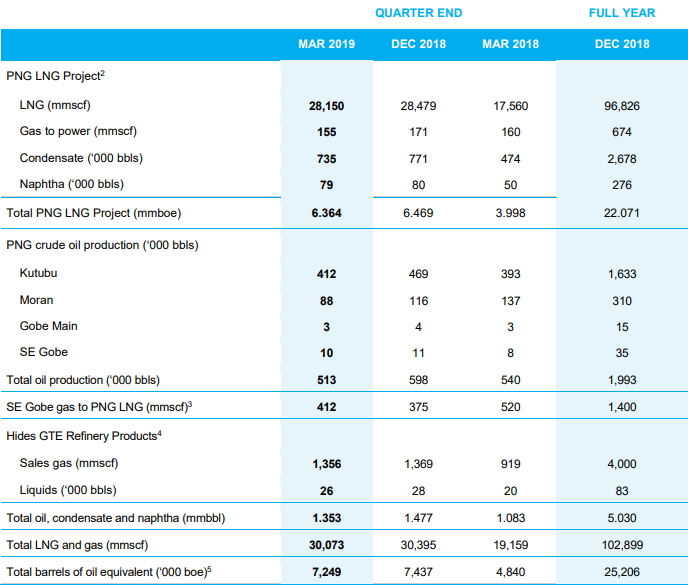
March’19 Quarter Production Metrics (Source: Company Reports)
OSH’s March’19 Quarter investment expenditure reduced by ~77% on pcp:Oil Search’s total investment expenditure (including exploration & evaluation, production, and property, plant & equipment (PP&E)) decreased from US$477.9 Mn in March’18 quarter to US$110.8 M nin March’19 quarter. The company spent US$85.1 Mn on exploration and evaluation activities, which included the Muruk 2 appraisal well (US$13.4 Mn), the second phase of seismic acquisition in the Onshore Papuan Gulf (US$5.4 Mn), pre-FEED activities for LNG expansion (US$14.9 Mn) and the Company’s Alaskan North Slope appraisal drilling programme (US$40.4 Mn).
Exploration cost was mainly comprised of seismic acquisition costs and geological, geophysical and general and administration expenses, and was reported at US$12.4 Mn. Development expenditure came in at around US$6 Mn (including US$4.1 Mn spent on the PNG LNG project). Expenditure on producing assets was reported at US$13.4 Mn, while expenditure on property, plant and equipment was reported at US$6.2 Mn.
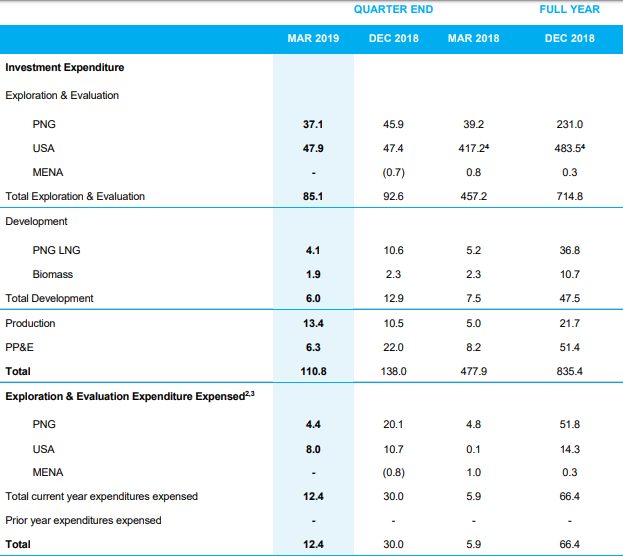
March’19 Expenditure Summary (Source: Company Reports)
OSH signs gas agreement with PNG Government: In April 2019, PRL 15 Joint Venture and the PNG Government entered into a gas agreement finalising the fiscal arrangements for the development of the Papua LNG Project. The PNG LNG Project signed a mid-term LNG sale and purchase agreement (SPA) with Unipec, taking the total Project volumes under contract to 7.9 MTPA. The SPA involves the supply of approximately 0.45 MTPA of LNG for four years, commencing in April 2019.
CY18 Financial Performance: Revenue for the company increased by 6% to US$1,535.8 Mn in CY18. The net profit after tax increased by 13% to US$341.2 Mn for the same period. At the end of March 2019, net debt (total borrowings less cash) on the balance sheet stood at US$2,634.1 Mn as compared to US$2,693 Mn as on December 2018.
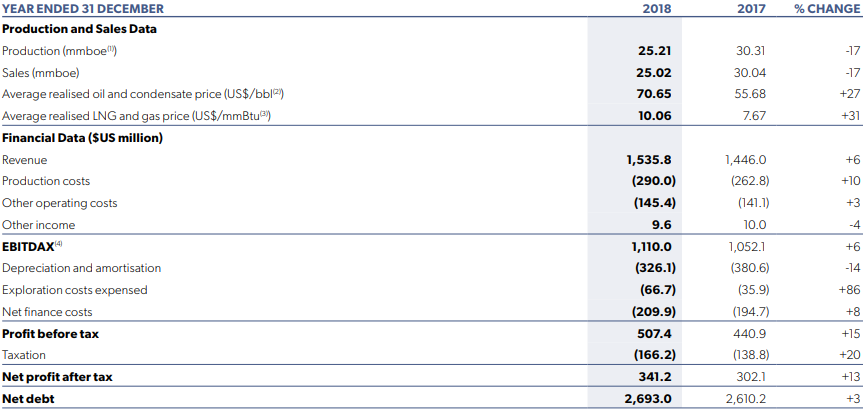
CY18 Financial Metrics (Source: Company Reports)
Natural Gas Outlook: As per the International Energy Agency (IEA) reports, gas is a flexible fuel that can meet multiple needs across the energy system, with lower emissions than coal or oil.
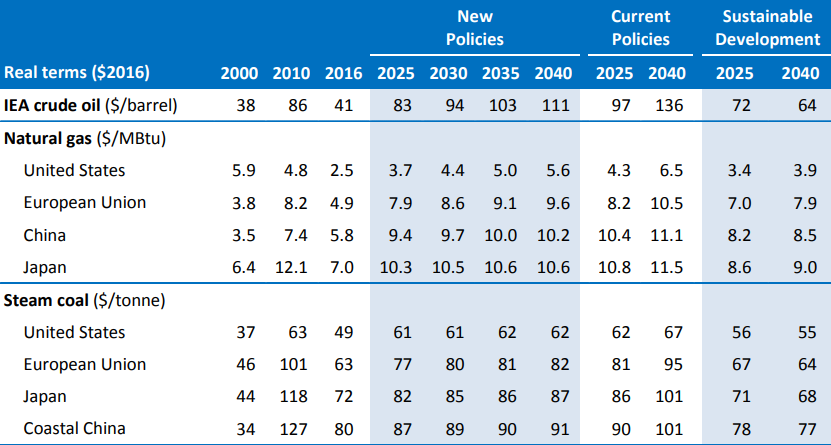
Fossil-Fuel Import Prices (US$) by Scenario (Source: IEA Reports); MBtu- million British thermal units; LNG- liquefied natural gas.
There is no single global price for gas, as there is for oil. Instead, there is a range of regionally determined prices, all with their own specificities, that become gradually more interlinked while moving towards a more interconnected global market, driven by the increasing share of liquefied natural gas (LNG) in global trade.
.png)
Natural Gas Demand by region in the New Policies Scenario (bcm) (Source: IEA Reports)
In the New Policies Scenario, global demand for natural gas is expected to increase from 3,635 bcm (billion cubic metres) in 2016 to over 5,300 bcm in 2040. The additional 1,670 bcm of gas consumption that materialises over the outlook period corresponds to more than twice the current gas use of the United States, which is the world’s largest gas consumer. The average annual demand growth rate of 1.6% between 2016 and 2040 is much faster than that projected for oil or coal, which expand at 0.5% per year and 0.2% per year, respectively over this period.
What to expect: Following the completion of the Papua LNG Gas Agreement, the Company has turned its focus on finalising the P’nyang Gas Agreement, with a targeted signing in the Q2CY19. Substantial progress has also been made on other commercial agreements supporting the proposed three-train, 8 MTPA downstream development at the PNG LNG plant site. The Company has signed a new PRL 15 Joint Operating Agreement, while the three integration agreements governing Papua LNG’s access to the PNG LNG site are very close to completion. The company anticipates that Front-End Engineering and Design (FEED) for the downstream development at the PNG LNG plant site will commence following the finalisation of the P’nyang Gas Agreement. The Company’s ongoing projects are expected to double its present production by the middle of the next decade.
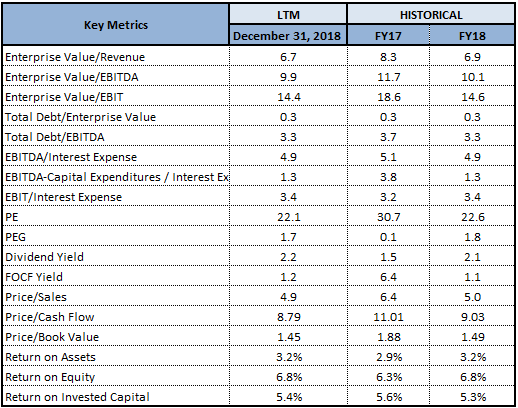
Key Valuation Metrics (Source: Thomson Reuters)
Stock Recommendation: Oil Search’s share generated a positive YTD return of 2.02% and is trading close to its 52-week low prices of $6.700 with a beta of 0.99x (5-Years, Monthly), proffering a decent opportunity for accumulation. On the analysis front, the Company posted a 6% and 13% increase in its revenue and net profits in CY18 as compared to CY17, depicting decent financial performance by the company. Its gross margin, EBITDA margin, and net margin in CY18 remained above the industry median, which implies the company is well determined to generate valuable returns for its shareholders. With the ongoing agreements to increase its geographical foothold along with the decent outlook for natural gas, the company is well positioned for growth, going forward. With the decent sales volume growth in Q1CY19, healthy balance sheet, respectable operating margins and return ratios, we recommend a “Buy” rating on the stock at the current market price of $7.080 per share and expect lower double-digit growth in the next 12-24 months.
.png)
OSH Daily Chart (Source: Thomson Reuters)
Disclaimer
The advice given by Kalkine Pty Ltd and provided on this website is general information only and it does not take into account your investment objectives, financial situation or needs. You should therefore consider whether the advice is appropriate to your investment objectives, financial situation and needs before acting upon it. You should seek advice from a financial adviser, stockbroker or other professional (including taxation and legal advice) as necessary before acting on any advice. Not all investments are appropriate for all people. Kalkine.com.au and associated pages are published by Kalkine Pty Ltd ABN 34 154 808 312 (Australian Financial Services License Number 425376). The information on this website has been prepared from a wide variety of sources, which Kalkine Pty Ltd, to the best of its knowledge and belief, considers accurate. You should make your own enquiries about any investments and we strongly suggest you seek advice before acting upon any recommendation. Kalkine Pty Ltd has made every effort to ensure the reliability of information contained in its newsletters and websites. All information represents our views at the date of publication and may change without notice. To the extent permitted by law, Kalkine Pty Ltd excludes all liability for any loss or damage arising from the use of this website and any information published (including any indirect or consequential loss, any data loss or data corruption). If the law prohibits this exclusion, Kalkine Pty Ltd hereby limits its liability, to the extent permitted by law to the resupply of services. There may be a product disclosure statement or other offer document for the securities and financial products we write about in Kalkine Reports. You should obtain a copy of the product disclosure statement or offer document before making any decision about whether to acquire the security or product. The link to our Terms & Conditions has been provided please go through them and also have a read of the Financial Services Guide. On the date of publishing this report (mentioned on the website), employees and/or associates of Kalkine Pty Ltd do not hold positions in any of the stocks covered on the website. These stocks can change any time and readers of the reports should not consider these stocks as personalised advice.
 Please wait processing your request...