Kalkine has a fully transformed New Avatar.
Company Overview: Noni B Limited is engaged in retailing of women's apparel and accessories. The Company operates within the women's fashion retail sector in Australia through a national network of boutique stores under the brands of Noni B and Liz Jordan. It also operates Queens park and Events brands. The Company creates its products, which are manufactured under contract by third-party suppliers. It offers various types of dresses, such as day dresses, evening dresses, maxi dresses and print dresses; tops, such as T-shirts, shirts, kaftans, tanks and tunics; knitwear, such as cardigans, sweaters and jumpers, and capes and ponchos; outerwear, such as jackets, coats, shrugs and vests; bottoms, such as pants, skirts, denim and shorts; intimates, such as bras, briefs, camisoles and slips; occasions, such as mother of the bride, desk-to-dinner, travel range and the slimming range, and accessories, such as scarves, eyewear, hand bags and fascinators. It operates through a retail network over 220 stores.
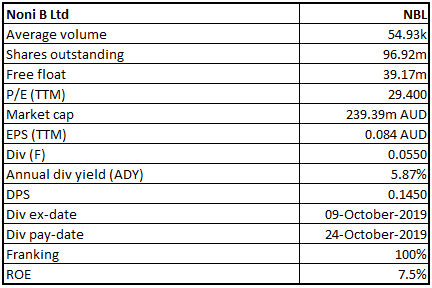
NBL Details
Successful Year for Noni B Group: Noni B Limited (ASX: NBL) is primarily engaged in retailing of women’s apparel and accessories. As on October 29, 2019, the market capitalisation of Noni B Limited stood at ~A$239.39 million. The company’s NPAT at $8.13 million in FY19 from $2.21 million in FY16 witnessed a CAGR growth of 54.4% over the period of FY16-FY19 with an EBITDA margin of 5.4% in FY19 from 5.3% in FY16. On 27 August 2019, the company released its annual report for the year ended 30 June 2019, wherein it reported an increase in EBITDA by 22% to $45.5 million. The company unified five additional women’s fashion brands acquired from Specialty Fashion Group on 2 July 2018, which transformed the company into one of the leading retail fashion groups in Australia and New Zealand. The acquired portfolio had been unprofitable for some time, but 5 brands complemented the existing business and the company saw an opportunity to achieve $30 Mn in the cost synergies. The company delivered 1.26 million orders in the last 12 months and has increased the product inventory on all its sites. The company has increased its database to 4.4 million email addresses and 3.4 million phone numbers, and this will help it to enhance the understanding of each brand’s customers, product preferences, shopping habits, and behaviours. This might support to increase top-line growth in years to come.
During the year ended 30 June 2019, balance sheet of the company strengthened, where the current assets increased from $110.81 million in FY18 to $214.3 million in FY19 with positive operating cash flow of $23.5 million and net cash of $7.1 million at the year-end. As a result, the company declared a fully franked final dividend of 5.5 cents per share, which was paid on October 24, 2019, followed by a fully franked interim dividend of 9 cents per share, representing a high pay-out ratio and confidence in earnings growth. The revenue of the company went up by 136.8% in FY19 from $372.4 million to $881.9 million. The company’s annual general meeting (AGM) will be held on November 21, 2019 in order to discuss financials and other related reports.
In FY20, the company would continue its focus towards 2 major growth areas, i.e., increasing the store network footprint across all the brands, and driving digital expansion. Additionally, there are expectations that the capabilities to garner revenues might act as a tailwind for long-term growth.
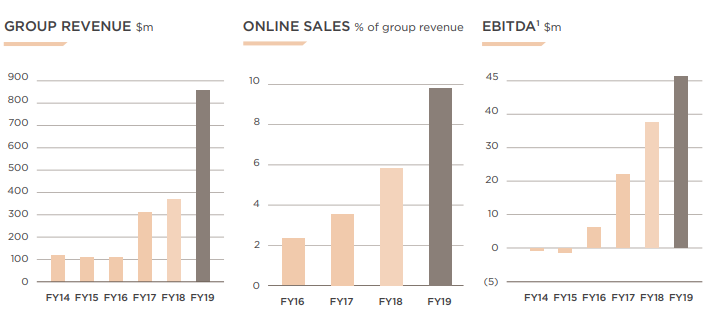
Financial Performance (Source: Company Reports)
Top 10 Shareholders: The following table provides a broader overview of the top 10 shareholders in Noni B Limited:
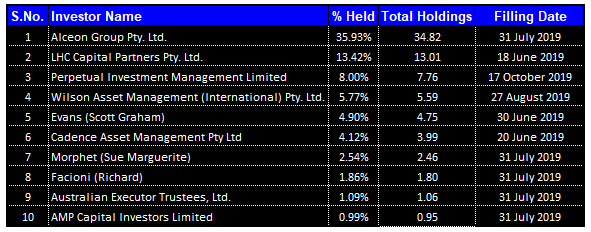
Top 10 Shareholders (Source: Thomson Reuters)
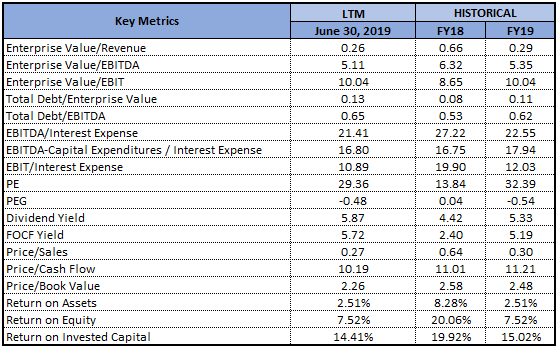
Key Margins: The company witnessed a CAGR of 68.12% in revenue in the time span of FY15 to FY19 and, therefore, it can be said that NBL is possessing decent capabilities to garner revenues. In the same time period, the CAGR of 63.76% in the gross profit was observed. During FY19, gross profit margin of the company stood at 56.6% as compared to the industry median of 24.2%. This implies that the company did well in managing its cost of sales and has more to cover for operating, financing, and other costs. The company’s Debt/Equity multiple stood at 0.28x in FY 2019, which is in-line with the industry median of 0.28x and, therefore, it can be said that the company has been managing its balance sheet in accordance with the broader industry standards.
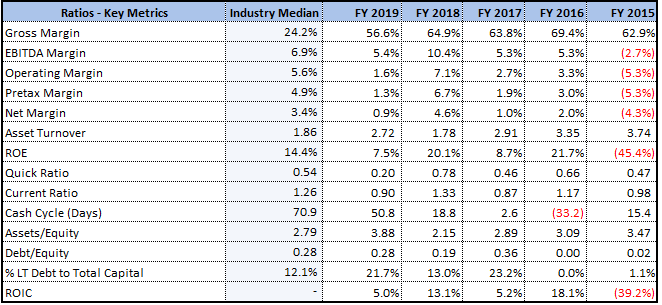
Key Metrics (Source: Thomson Reuters)
Acquisition from Speciality Group: Noni B Limited acquired five additional brands from Specialty Fashion Group on July 02, 2018. When the company announced the acquisition of Specialty brands, it conservatively expected them to break-even on an EBITDA basis in FY19 and returning to profit in FY20. The company achieved anticipated synergies and merger benefits ahead of schedule and identified additional efficiencies, resulting in 5 brands, collectively, making the positive earnings contribution for the year. As at June 30, 2019, the company cemented cost savings of $70 million, out of which $30 million are yet to be reflected in earnings and will be fully realised in FY2020.
Analysis of 5-year Performance: Over the past 5 years, Noni B Group has grown to be one of the largest fashion retail groups in Australia. The company’s EBITDA went up from $37.2 million in FY18 to $45.5 million in FY19 despite a difficult trading environment. It reflected more than just cost savings and, in addition to the consolidation of supply chains and integration of all the back-office and IT systems, the company also witnessed improvements, which includes working capital, that would be further benefiting the performance in future years. The company has completely evolved during these 5 years and has made a stronger and more profitable business which is financially stable, generates cash, and provides a solid platform for future expansion. The following image gives a brief overview of the company’s EBITDA from FY14- FY19:
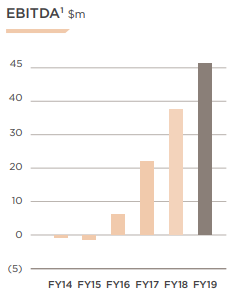
Five-year EBITDA growth (Source: Company Reports)
Expansion in Online Sales: In FY19, online sales grew by 4.0% to 9.8% of total group sales and managed to deliver a total of 1.26 million orders in the past 12 months. Standardised operating platform improved the shopping experience and increased the speed to market for new site enhancements. The company also delivered a multi-channel experience through click and collect across 1,379 stores. The company has built an omni-channel, which is simple, seamless, and fast. NBL also increased the product inventory on all sites, creating 9 marketplaces that provide a first stop last shopping destination. There are expectations that further team investment might improve customer experience and achieve growth goals.
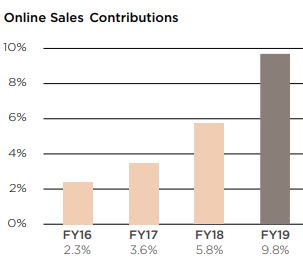
Online Sales Contributions (Source: Company Reports)
Brands of 2019: The company offers different brands to cater all the individual customer needs and desires like Millers, W.Lane, NONI B, Rivers, Katies, Autograph, Rockmans, Crossroads, and Beme. Millers offers affordable, ageless fashion that doesn’t compromise on comfort or fit. The W. Lane lady has an active and fulfilling lifestyle. The NONI B provides smart dressing and smart casual fashion that’s classic, timeless and elegant whereas the Rivers customer is stylish, outgoing and full of energy. They provide value-driven fashion with great fit and quality. Katies create unique as well as versatile fashion to match the style, via effortless and flattering fabrications.
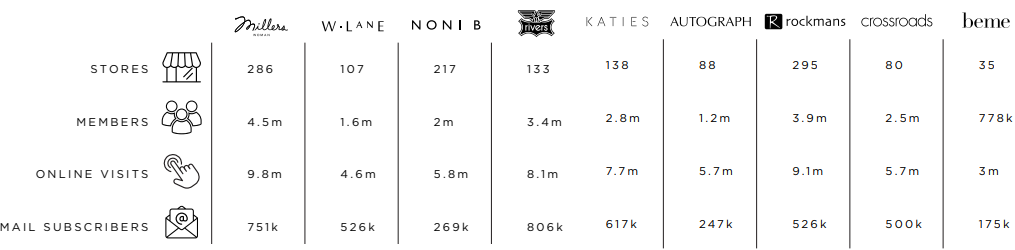
Brands of 2019 (Source: Company Reports)
Outlook: NBL’s growth strategies for FY 2020- FY 2023 revolve around portfolio growth and online growth. The momentum which was mentioned in the last year’s annual report has been accelerating and, after the substantial progress in the past year, the company is expecting underlying EBITDA in FY 2020 to be in line with that of the market consensus of $75,000,000. The company is looking forward to the potential that is to be unlocked by the greater analysis of group’s data, store expansion and online strategies. Additionally, it looks forward to further revenue as well as earnings growth in FY 2021 and beyond. As per the management, the company plans to open 100 additional stores per year. The database of Noni B has 4.4 million emails and 3.4 million phone numbers, showing the clear prospect to leverage the database to increase share of wallet. The company also plans to rollout new categories like Beauty, Homewares, Luggage and other.
As mentioned earlier, the company’s total revenues have witnessed respectable CAGR growth, and therefore, it can be said that NBL is possessing decent capabilities to garner revenues. The company would continue to review the growth opportunities via acquisitions to expand its current business. The company’s brands’ strong customer loyalty provides the considerable potential to broaden the range of products it sells, and the company plans to capitalise on this in the coming year with deployments towards the online strategy.
Key Valuation Metrics (Source: Thomson Reuters)
Valuation Methodology: Price to Cash Flow based valuation
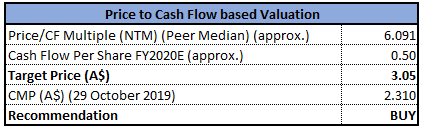
Price to Cash Flow based valuation (Source: Thomson Reuters), *NTM: Next Twelve Months
Note: All forecasted figures and peers have been taken from Thomson Reuters
Stock Recommendation: The company’s stock has witnessed a fall of 15.99% in the span of previous one month, while in the time frame of past three months, the stock has fallen 6.08%. As per ASX, 52-week trading range of the stock stands at $2.290 to $3.400 and currently, the stock is trading at the lower band of its 52-week trading range, proffering a decent opportunity for accumulation. In the release for FY19 results, the company has highlighted certain operational achievements. These achievements mainly include improvement and deployment in the online channel strategy with sales contribution growing to 9.8%, supply chain consolidation, systems integration and optimising the store network. Based on the foregoing, we have applied a relative valuation method, i.e., Price to Cash Flow multiple and arrived at a target price of double-digit growth (in percentage terms). Hence, we give a “Buy” recommendation on the stock at the current market price of A$2.31 per share (down 6.478% on 29 October 2019).
.png)
NBL Daily Technical Chart (Source: Thomson Reuters)
Disclaimer
The advice given by Kalkine Pty Ltd and provided on this website is general information only and it does not take into account your investment objectives, financial situation or needs. You should therefore consider whether the advice is appropriate to your investment objectives, financial situation and needs before acting upon it. You should seek advice from a financial adviser, stockbroker or other professional (including taxation and legal advice) as necessary before acting on any advice. Not all investments are appropriate for all people. Kalkine.com.au and associated pages are published by Kalkine Pty Ltd ABN 34 154 808 312 (Australian Financial Services License Number 425376). The information on this website has been prepared from a wide variety of sources, which Kalkine Pty Ltd, to the best of its knowledge and belief, considers accurate. You should make your own enquiries about any investments and we strongly suggest you seek advice before acting upon any recommendation. Kalkine Pty Ltd has made every effort to ensure the reliability of information contained in its newsletters and websites. All information represents our views at the date of publication and may change without notice. To the extent permitted by law, Kalkine Pty Ltd excludes all liability for any loss or damage arising from the use of this website and any information published (including any indirect or consequential loss, any data loss or data corruption). If the law prohibits this exclusion, Kalkine Pty Ltd hereby limits its liability, to the extent permitted by law to the resupply of services. There may be a product disclosure statement or other offer document for the securities and financial products we write about in Kalkine Reports. You should obtain a copy of the product disclosure statement or offer document before making any decision about whether to acquire the security or product. The link to our Terms & Conditions has been provided please go through them and also have a read of the Financial Services Guide. On the date of publishing this report (mentioned on the website), employees and/or associates of Kalkine Pty Ltd do not hold positions in any of the stocks covered on the website. These stocks can change any time and readers of the reports should not consider these stocks as personalised advice.
 Please wait processing your request...