Kalkine has a fully transformed New Avatar.

1. Sector Landscape and Outlook
Non-Ferrous Metal Industry1 witnessed the shockwaves from the global uncertainty, latest due to the outbreak of coronavirus that has withered the price of industrial commodities, namely Copper, Nickel, Aluminum. On the contrary, the Rare Earths Metal (REM) such as Neodymium and Praseodymium Oxide fell marginally but remained almost constant due to the supply tightening courtesy to China, holding 85% market share in production.
In the milieu of which it is quintessential to analyse the commodity mentioned above to envisage the economic and industrial outlook.
Copper is often considered as the economic indicator, Nickel - a major industrial metal, aluminium - a structural metal used in automobile and construction sector and REM - a digital and green technology metal. Albeit the global economy is in deep uncertainty, putting pressure on the non-ferrous metals, a price recovery could be expected with the abatement of coronavirus.
In this sector report, we examine the supply and demand of the Non-Ferrous Metal Industry to understand the pricing trends and outlook to demystify the performance of the companies operating in the industry.
The key queries which find an answer in this report are: What are the key drivers guiding the industry? What are the factors affecting the commodity price? How will the industry position itself in future? Are Companies gaining in the near term? 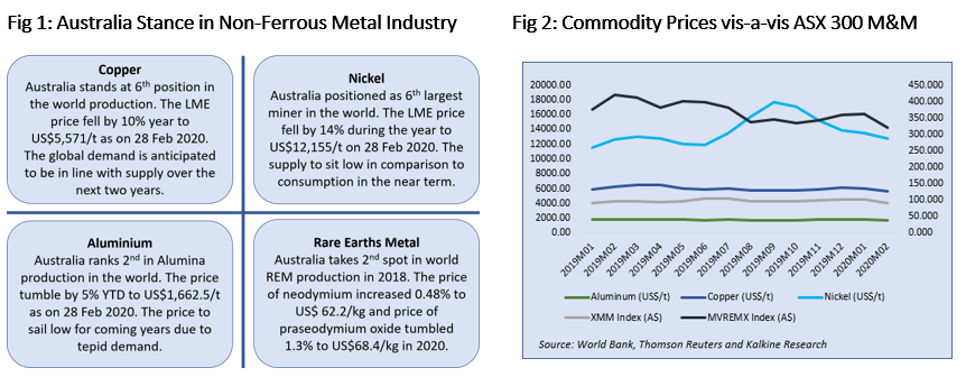
Copper: ‘Doctor Copper’ is a term often used to detect the global economic pulse to assess the health of the economy. Lately Copper prices due to the outbreak of coronavirus tumbled by ~11.6% from US$ 6,300 per tonne on 16 Jan 2020 to US$ 5,569 per tonne on 28 Feb 2020. The plunging prices are testimony to the brunt of coronavirus on the global economy as China being the world’s largest resources trader and houses most of the smelters and refineries. 2020 started ferociously, but 2019 too witnessed the ups and downs due to the U.S-China trade war, conflict between the U.S. and Iran, Brexit uncertainty and the dwindling interest rate to mention a few.
However, the price shot up to US$5,667/t on 3 Mar 2020 as China stimulated hope for world-wide policy support to neutralize the domino effect of coronavirus pandemic on the global economy. .png)
Having said that the prices are likely to see a recovery post abatement of coronavirus fears owing to the v-shaped recovery in demand. It is to be noted that Copper smelter operations in China have not been closed since it is costlier to undertake temporary shutdown, further the Copper fabrication hub is located in Guangdong province and not Hubei – an epidemic struck province that gave rise to inventories of Copper cathode.
Copper Production: In 2019, Copper witnessed a drop in production due to the falling ore grade, thus constraining the mine production. On top of this, several players faced hurdles related to high electricity costs, protest and tax regimes impacting operational productivity.
The Chile Copper output was on the lower side due to the heavy rains, protest at Chuquicamata mine and falling grade at Codelco. On similar lines, Zambia and Democratic Republic of the Congo (DRC) production were also under pressure due to surge in electricity cost, tax uncertainty and closure of Glencore Mutanda mine. The closure of Vedanta’s KCM by Zambia government is the testimony to the taxation conflict. While countries like Australia, Panama, Peru and the U.S. etc. witnessed a surge in production mainly due to ramping up and expansion of operations.
As per the Australian Department of Industry, Innovation and Science (DIIS), the world Copper production, including refined product is expected to be in oversupply with respect to demand in 2020 and 2021. The much-anticipated economic recovery and rising consumption could support the Copper prices post 2020. DIIS expects the price to improve by around 9.7 per cent from US$5,639/t (as on 2 Mar 2020) to US$6,188/t in 2021.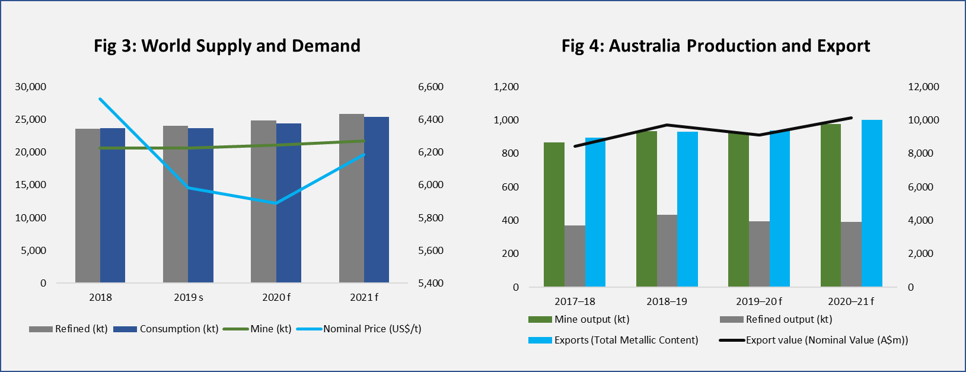
Source: DIIS; Additional Analysis: Kalkine Research
With the understanding of Copper dynamics, lets now move over to major industrial metal- Nickel.
Nickel: The silvery-white metal is a primary industrial raw material used mainly in stainless steel production (around 66.67% usage) is following a similar price curve as Copper with regards to the price. The LME Nickel price increased by 79% in 2019 from US$10,435/t as on 2 Jan 2019 to US$18,620/t as on 2 Sep 2019 due to the speculation over the Indonesian export ban on the commodityby 2022. However, the price later corrected by 25% to US$13,990/t as on 31 Dec 2019 post the announcement of the resumption of Indonesian ore export. Further, the easing of the US-China trade dispute and lower demand for steel added more pressure to the prices. More recently, owing to intensifying spread of Coronavirus, Nickel further plunged by ~15% from the high that was recorded on 16 Jan 2020, i.e. US$14,285/t to US$12,155/t on 28 Feb 2020.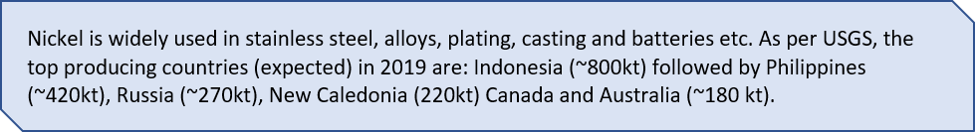
Production status in 2019: The production from world’s largest producer- Indonesia grew on the back of high prices and consumption growth until the ban of ore export. The second-largest player Philippines’ output dwindled because of government audits and increasing environmental standards leading to the temporary closure of most of the open-pit mines. Also, it is pertinent to mention that the new refining capacity of 130,000t is anticipated in the next two years from China and 90,000t (the advent of Nickel ore export ban) from Indonesia.
The global demand for Nickel has mostly come from China, followed by Japan, the U.S. and Indonesia. The Indonesian consumption is likely to grow over the year due to the investment in the Nickel smelter and increasing stainless steel manufacturing capacity, with 6,500t of capacity expected to come online in the next two years.
Though the outlook is very ambiguous due to coronavirus pandemic fears and political uncertainty in the coming years’, consumption is anticipated to outweigh the production keeping market in deficit and the price is anticipated to increase to US$15,800t in 2020 and US$16,500 in 2021 as per DIIS.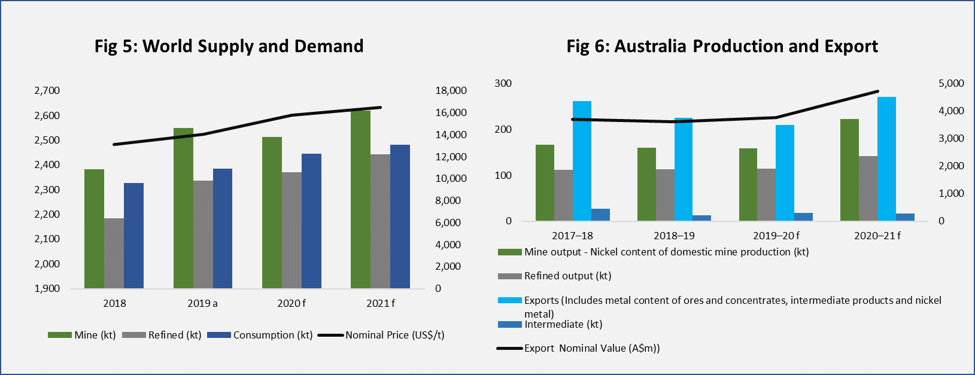
Source: DIIS and Kalkine Research for additional analysis
Aluminium: The antique Alum with a significant proportion being used in construction and transportation sector (due to its high strength to weight ratio) offers muscle to the structure. 2019 saw the LME price fall by ~3% to US$1,799.5/t as on 31 Dec 2019. However, 2020 start has been much more dramatic with prices tumbling by ~8% to US$1,662.5/t as on 28 Feb 2020. The downward price pressure could be attributed to trade tensions between the US-China, financial sanctions on the significant Russian aluminium producer, Rusa and the recent coronavirus outbreak. However, the aluminium price is recovering and is currently trading at US$1,705.5/t (as on 3 Mar 2020) post the China's Nonferrous Metals Industry Association (CNIA) calling Government for help to initiate stockpiling program.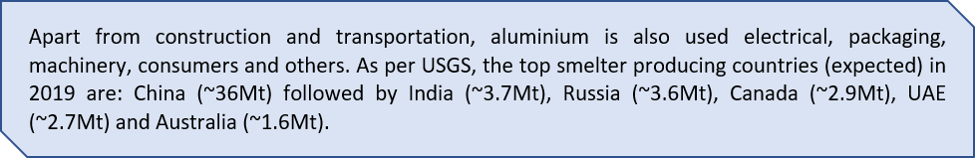
With the understanding of the aluminium price action let’s move on to gauge the supply dynamics.
Aluminium Supply Dynamics: During 2019, China — the world's largest aluminium producer and user, saw its output tumble due to the outages and flooding in Hongqiao's aluminium smelter and an explosion at Xinfa's aluminium smelter. Also, the trade tension along with stringent environmental regulation added to the slow growth in the country. Intriguingly, being a significant consumer, the demand also fell because of the ongoing tension, world economic slowdown dampening the aluminium demand.
The aluminium production is anticipated to increase in near term due to the additional capacity coming from China, Indonesia and Iran. China's Baoshan Iron and Steel is likely to add ~300ktpa, Inner Mongolia Mengtai Group to add 200kt of aluminium alloy project, Iran to increase production to 1.5Mt by 2025 and Indonesian Asahan smelter is likely to increase its capacity from 250ktpa to 2Mtpa in next 15 year. In the same line, consumption too will be increased marginally lower than supply with the upcoming global demand of EV's.
It is also worth mentioning that the bauxite is used for alumina production and which is then smelted to produce aluminium. On the world production front, Australia stands first in bauxite and second in alumina. Bauxite production soon is likely to increase with the ramp-up of Amrun bauxite project in WA and Guinea's Boffa bauxite mine. Also, alumina production is expected to increase from Lanjigarh refinery (India), Qiya Linfen alumina refinery (China) and Mempawah alumina refinery (Indonesia).
The aluminium price is expected to hover around US$1,700/t in 2020 and US$1,615/t in 2021 due to the production outpacing the consumption.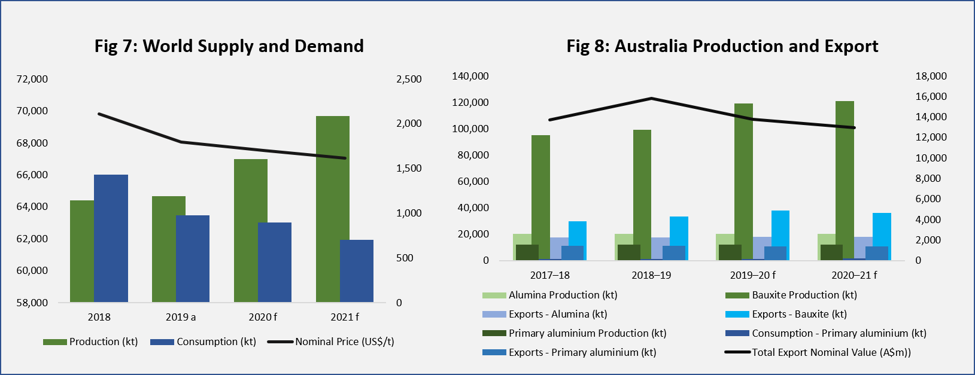
Source: DIIS and Kalkine Research
Let’s shift our focus from traditional non-ferrous to a metal that has been in vogue thanks to the surge in green energy demand.
Rare Earth Metal: Rare earth elements (REE) consists of fifteen lanthanides with additional yttrium and scandium. The rare earth metal index, i.e. the MVIS Global Rare Earth/Strategic Metals Index (MVREMX), is on the same lines as other base metal prices. 2019 witnessed the surge in index price by 19% to a high of ~US$304.67 in April 2019, post which it tumbled by 17% to ~US$251.93 as on 31 Dec 2019. Come 2020; it further fell by 17% to hover around ~US$208.77 as on 28 Feb 2020. The index price recovered marginally and reached US$215.49 as on 3 Mar 2020.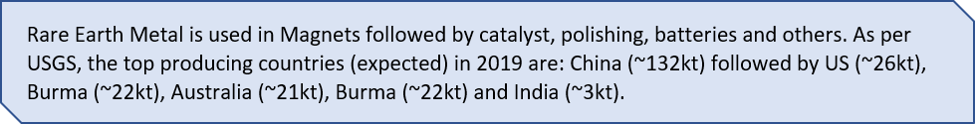
Rare Earths Production Scenario: Australia is likely to lose its second place in world production to fourth. [why] The total world reserves are anticipated to be around 120Mt with Australia standing sixth at 3.3Mt post-China, Brazil, Vietnam, Russia and India. Also, it is pertinent to mention that when it comes to resources, Australia holds the most significant volume of rutile (titanium), zirconium (zircon) and tantalum. In the case of spodumene (lithium), rutile and zirconium production, the country stands highest in the rank. While in consumption China’s position remains the same at the top followed by Japan/other Asia and the U.S.
Rare Earths Expected Price Action: The price of REM is likely to increase in future with US-China 1st trade deal. The agreement envisages the buying of two metals, namely scandium and yttrium from the U.S. to China for the use in lightings and computers. Also, rutile supply in coming years is expected to fall with strong welding and sponge market supporting price.
Fig 9: The different types of REM and their applications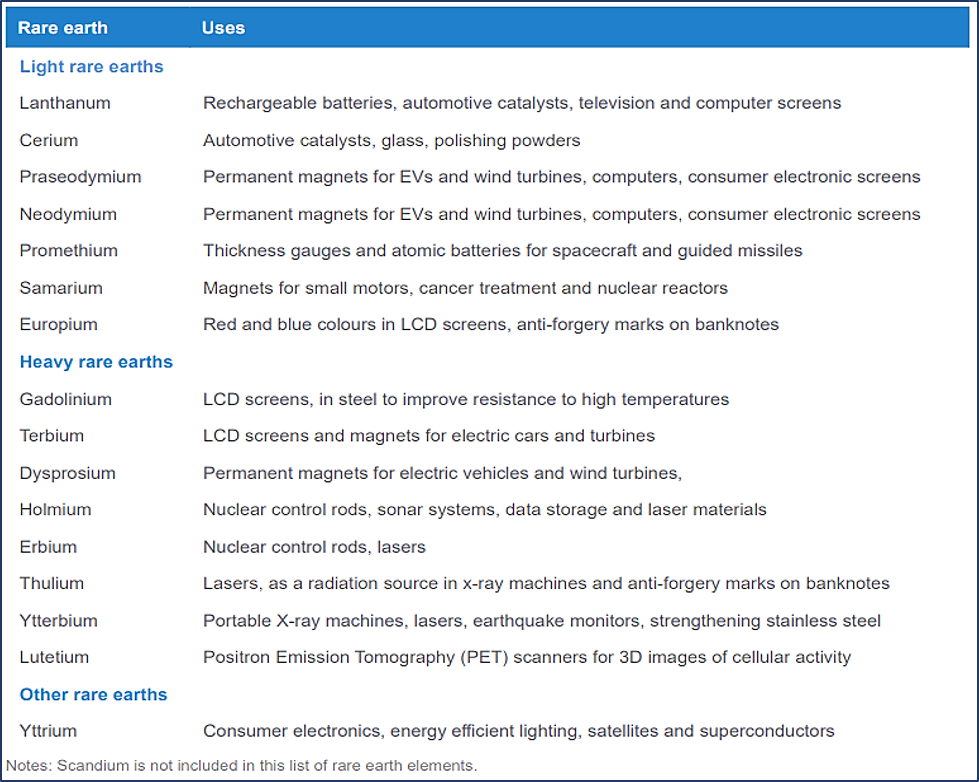
Source: DIIS
After understanding the non-ferrous metals, let’s take a look at the outlook (based on the data provided by the DIIS) of the Copper, Nickel and Aluminium for the next two years. The DIIS has provided its estimates for the consumption, production and price for these three commodities. Based on the data we have calculated expected percentage change over next two years and for the presentation purpose, we have indexed the highest value at 10 and distributed the rest in proportionate way.
Fig 10: Commodity Ranking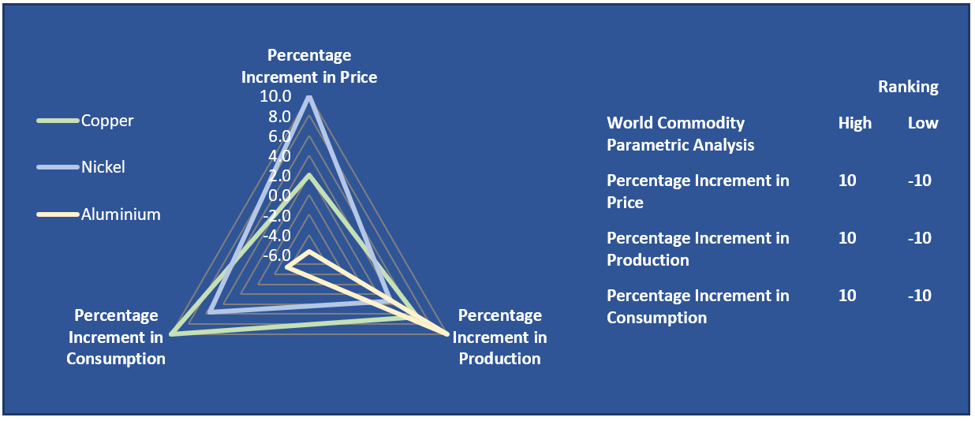
Source: DIIS, Kalkine Research
The central banks across major economies have taken proactive steps to fight the slowdown due to coronavirus pandemic. On 3 Mar 2020, the U.S. fed cut the interest rate by 0.50%, a significant move coming for the first time since the 2008 financial crisis. The RBA also cut rate recently, by 25 bps keeping the bank rate at record low levels of 0.5%. It is to be noted that, many more global central banks have also taken a stance to ease liquidity. The boost in liquidity could come as major support for global commodity prices.
2. Investment Theme and Stocks under Discussion (NIC, SFR, ILU, WSA and LYC)
After gauging through the key commodities trends, driver and stance, let’s take a detailed view of the companies in Non-Ferrous Metal Industry in terms of their performance and outlook. To assess the same, companies’ stocks are evaluated based on Discounted Cash Flow (DCF).
Fig 11: Relative performance of the stocks under discussion in last 1 year (Indexed to 100)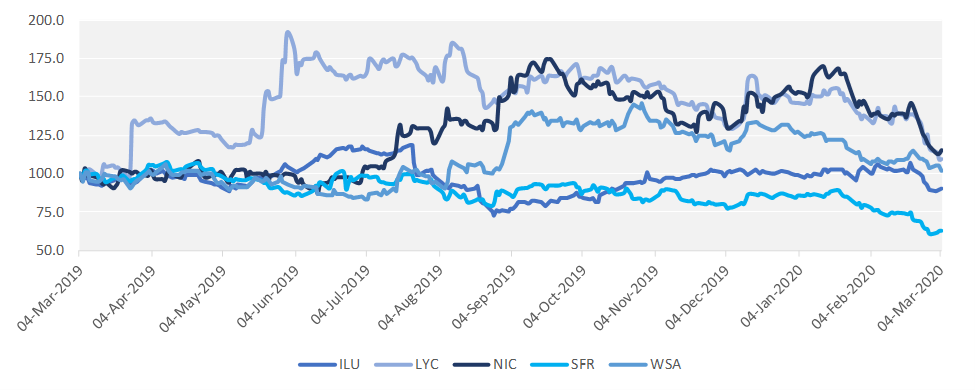
1) ASX: NIC (NICKEL MINES LIMITED)
(Recommendation: Buy, Potential Upside: 25%)
NIC is a producer of nickel pig iron, which is a vital component in the manufacturing of stainless steel.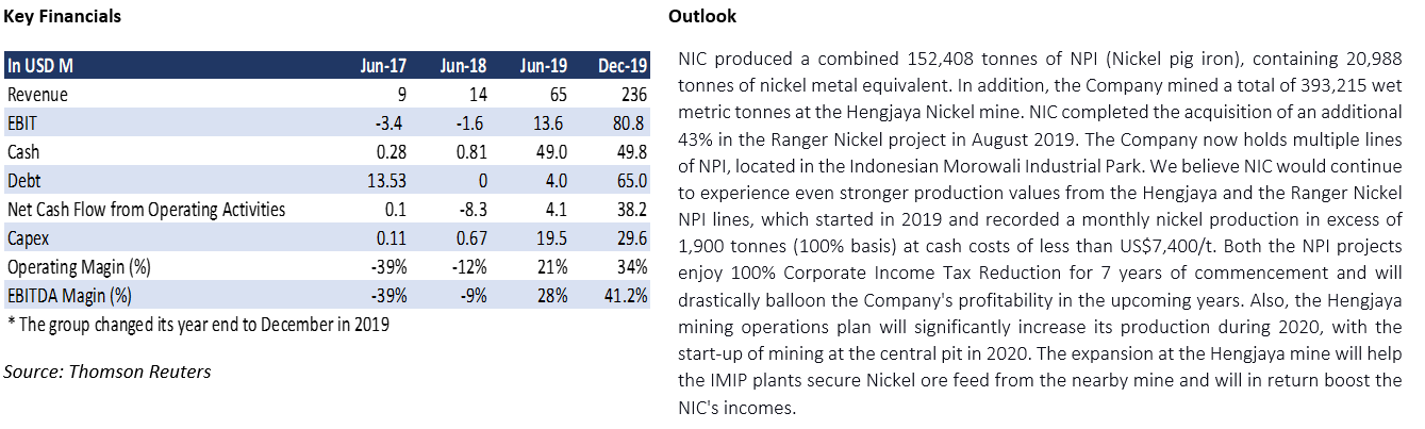
Valuation
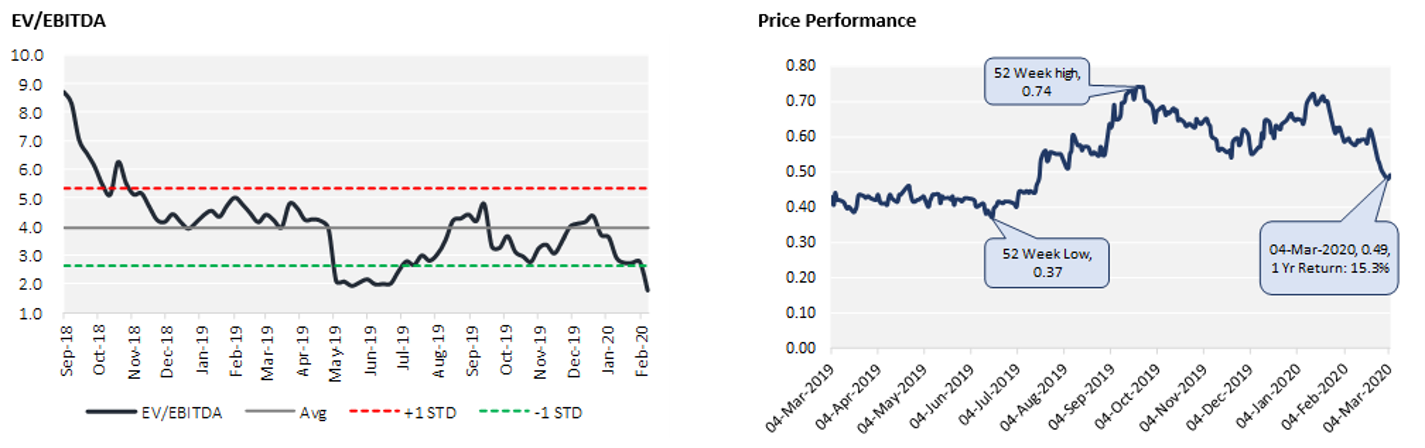
Our valuation model suggests that stock has a potential upside in the range of ~25% on 4 March 2020 closing price. The company recently change its financial year end to December from June and provided. The company’s revenue is expected to increase significantly in 2020 on account of 1. Dec 19 numbers include only 6 months data, 2. 2020 to be the first full year of production, 3. Commencement of mining operations at Central pit in the Hengjaya mining, and 4. Integrated nature of business across Nickel value chain at IMIP. We expect margins to remain robust on account of increased mining activities which is expected to result in lesser cash cost.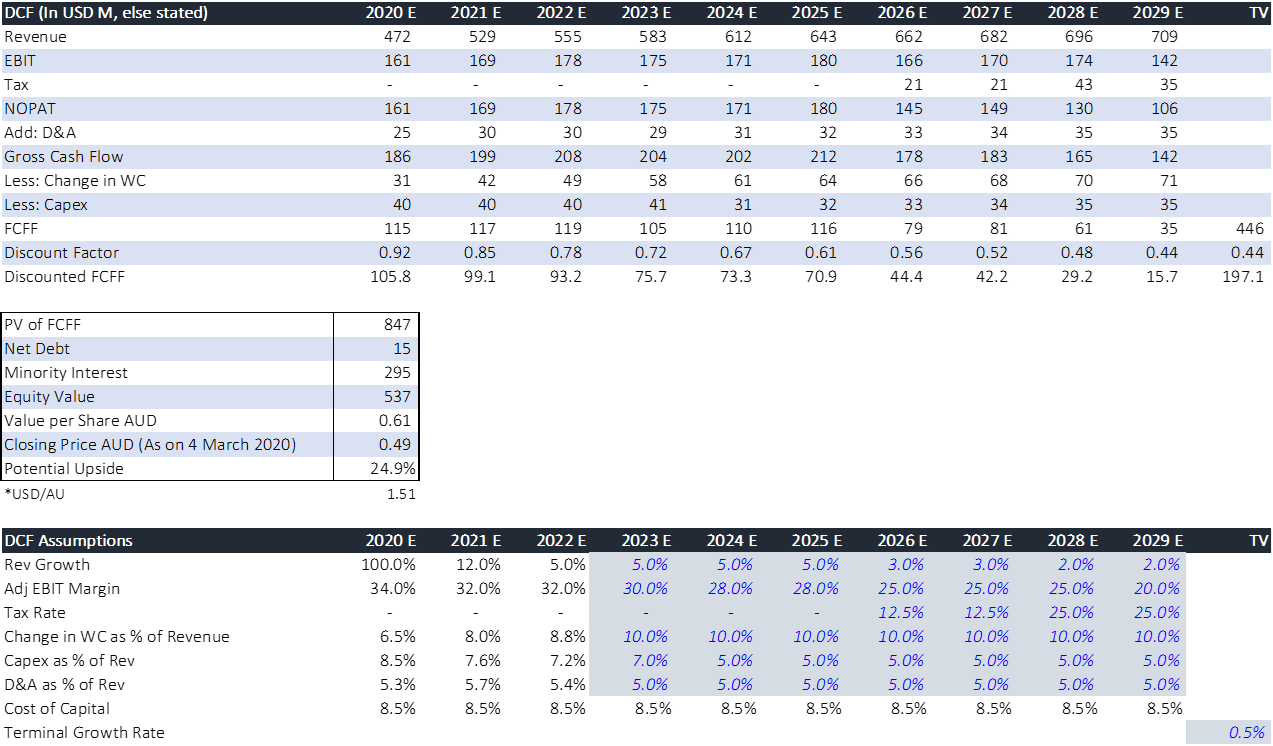
2) ASX: SFR (SANDFIRE RESOURCES LIMITED)
(Recommendation: Buy, Potential Upside: 19%)
SFR is a base & precious metals miner and explorer, operating major gold and copper mines across Australia while developing future mining assets in Africa and America.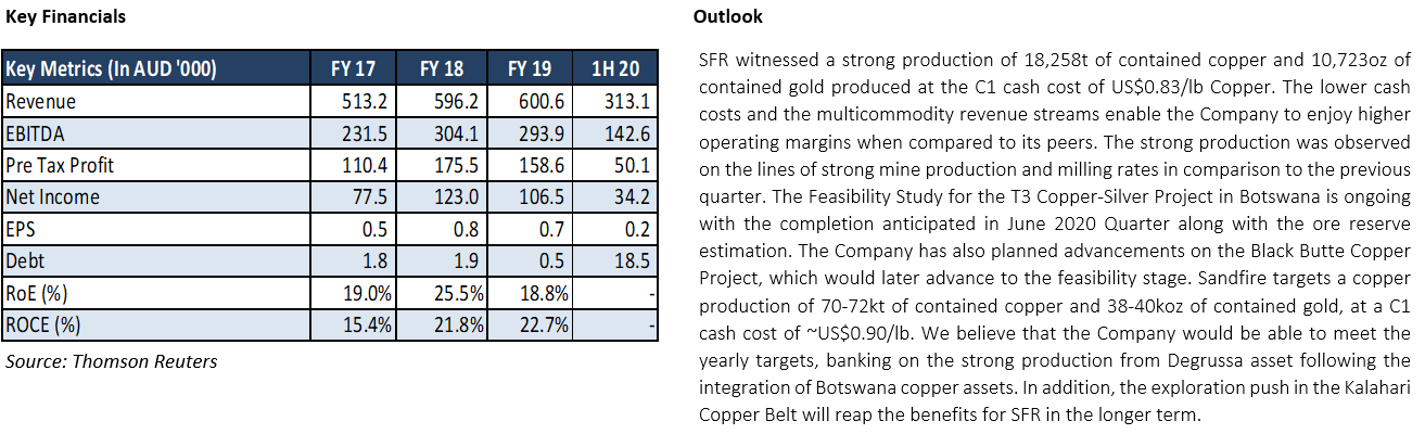
Valuation
Our valuation model suggests that stock has a potential upside in the range of ~19% on 4 March 2020 closing price. We expect that higher production from Degrussa operations would help the company to grow its revenue in 2020. We think that margins may remain good on account of higher Copper production coupled with strong byproduct credits in the long term; however, a mild pressure is expected in the near term on account of increase in cash cost.
3) ASX: ILU (ILUKA RESOURCES LIMITED)
(Recommendation: Buy, Potential Upside: 14%)
ILU is a global mineral sands company. It has 60 plus year of experience ranging from exploration to mining and processing along with marketing and rehabilitation.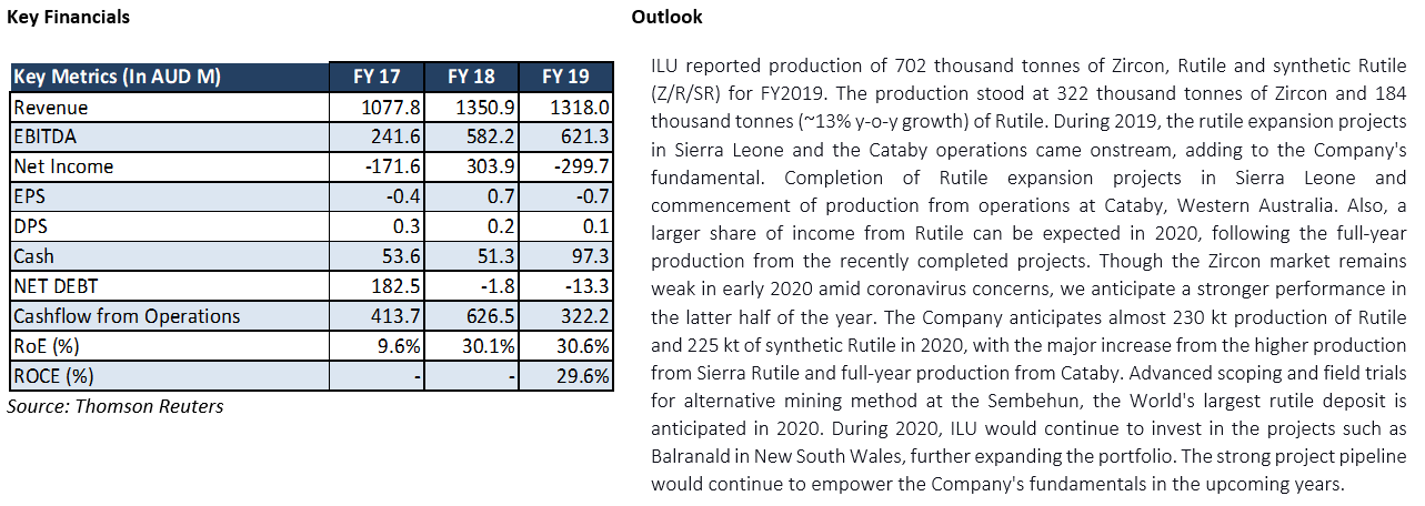
Valuation
Our valuation model suggests that stock has a potential upside in the range of ~14% on 4 March 2020 closing price. We expect that higher production from Sierra Rutile and full-year production from Cataby would help the company to grow its revenue in 2020. Advanced scoping and field trials of Sembehun, the World's largest rutile deposit is anticipated in 2020, further strengthening the future outlook for the company.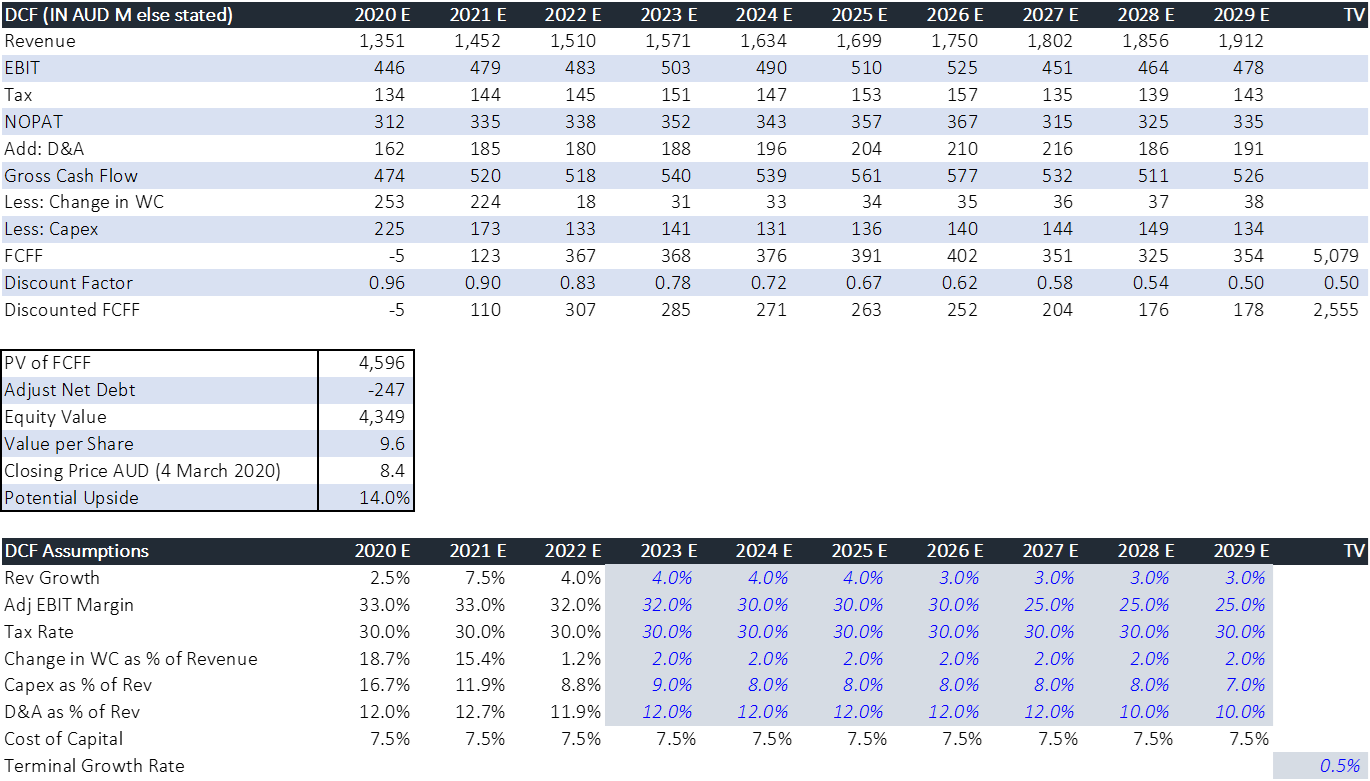
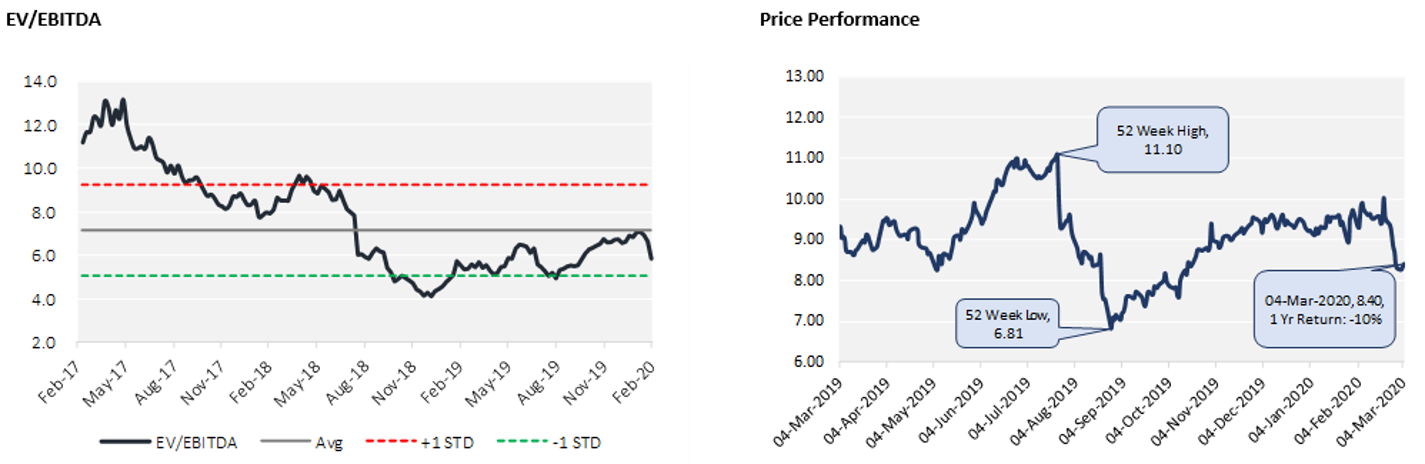
4) ASX: WSA (WESTERN AREAS LIMITED)
(Recommendation: Hold, Potential Upside: 5%)
WSA is Nickel focused mining group, and it holds the world’s two highest grade nickel mines.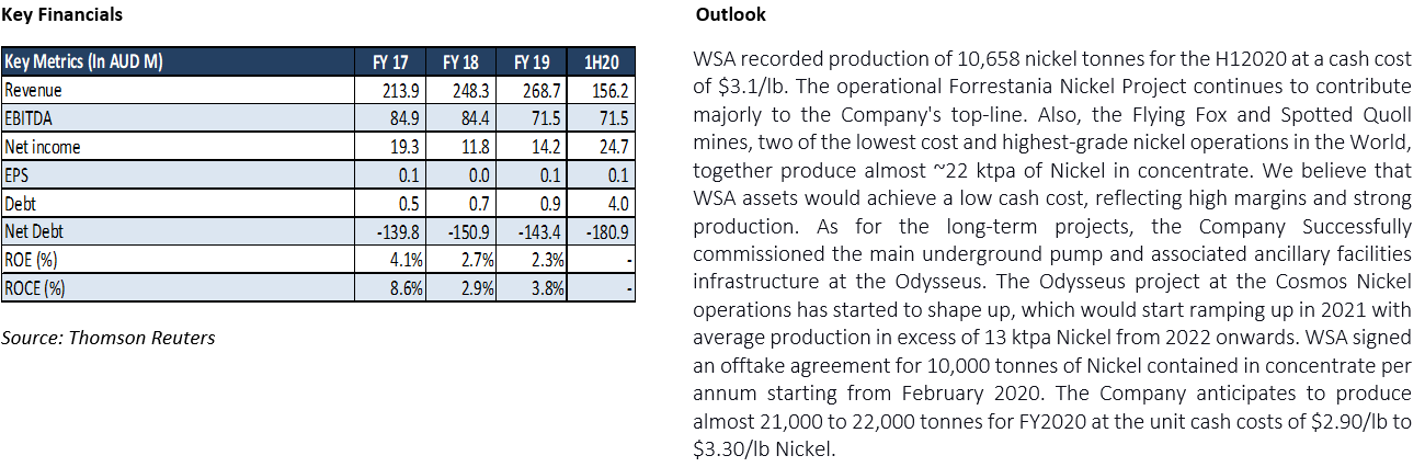
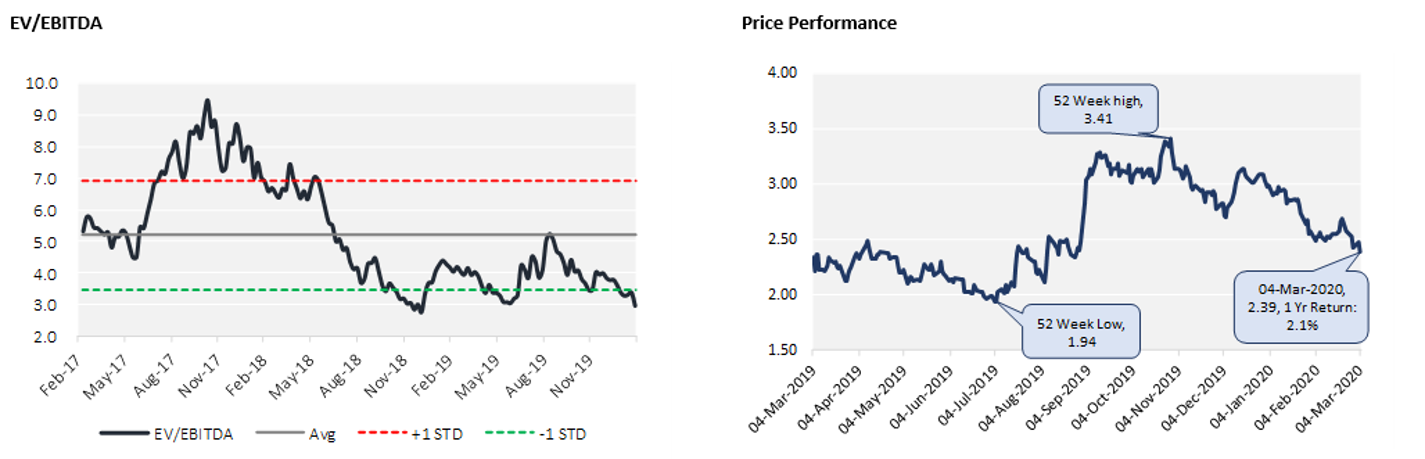
Valuation
Our valuation model suggests that stock has a potential upside in the range of ~5% on 4 March 2020 closing price. The group has a decent outlook and following are the key points to note: 1. offtake of 10 ktpa Ni (almost 50% of total production), 2. Odysseus project at the Cosmos Nickel operations to start in 2021 with average production in excess of 13 ktpa Nickel from 2022 onwards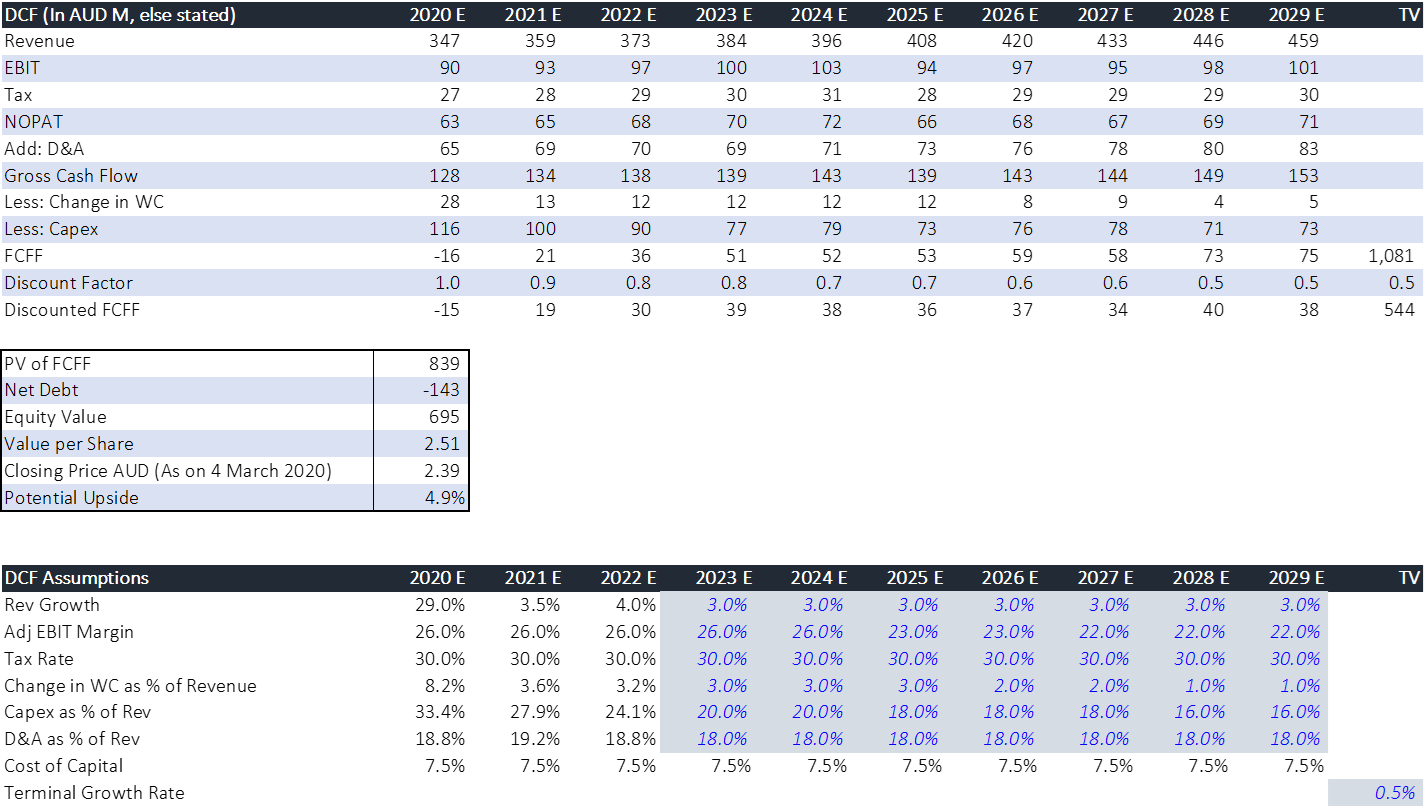
5) ASX: LYC (LYNAS CORPORATION LIMITED)
(Stance: Watch)
LYC is an Australia based integrated rare earths metal company with operation ranging from mining to the customer-ready product. The Company owns one of the world highest grade rare earths Mt Weld mine in WA.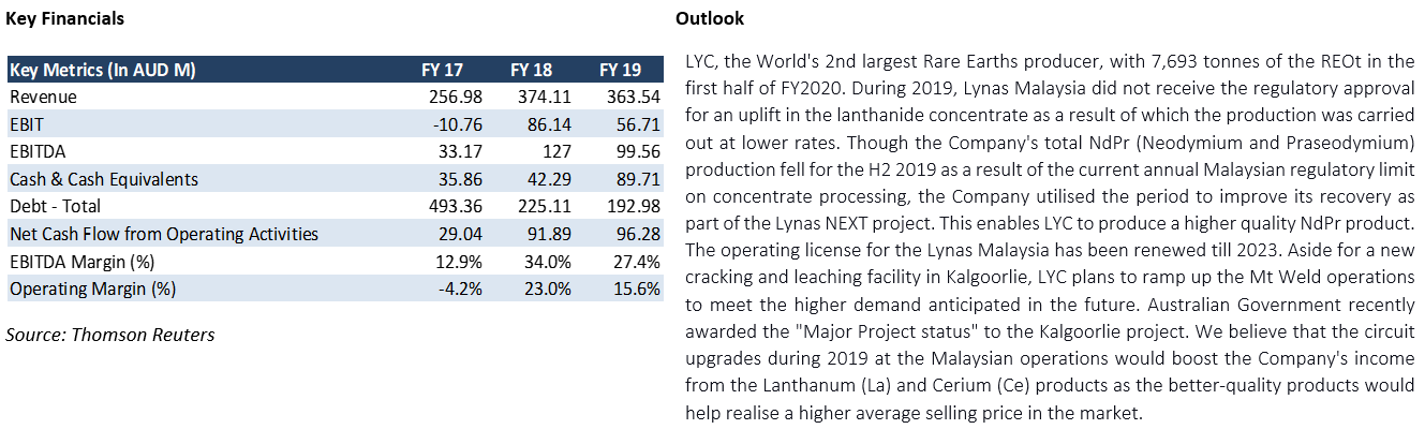
Valuation
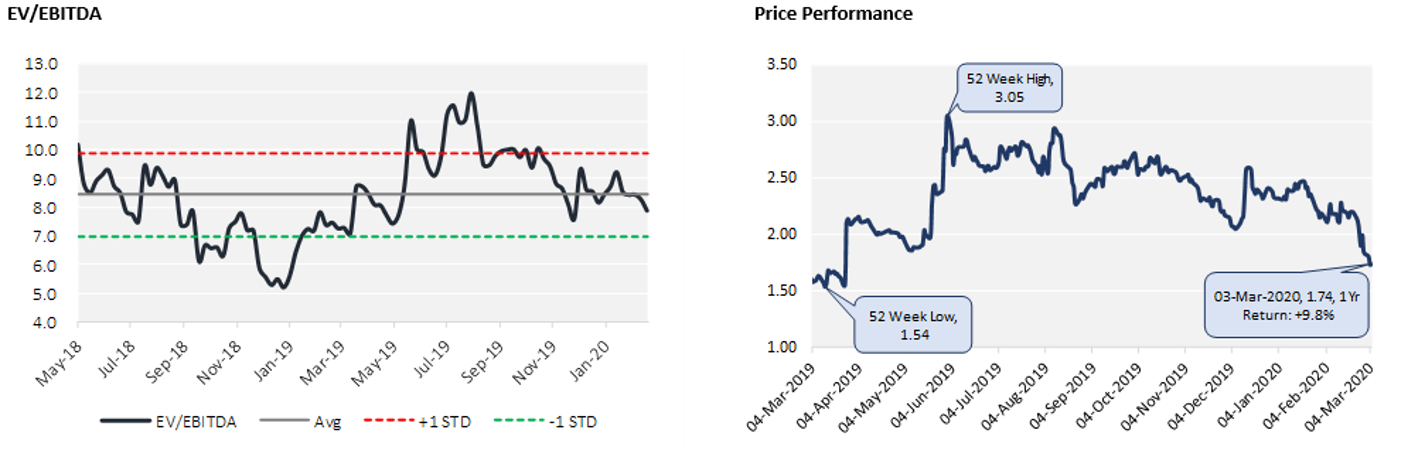
Our valuation model suggests that stock has a potential upside in the range of ~1% on 4 March 2020 closing price. Lynas experienced a steady growth in its revenue, following the increased selling price across its products. Though LYC managed to serve the strong demands from its customers especially from Japan, the production volumes fell during the last 6 months as a result of the current annual Malaysian regulatory limit on concentrate processing. Hence, we have a “Watch” stance on the stock.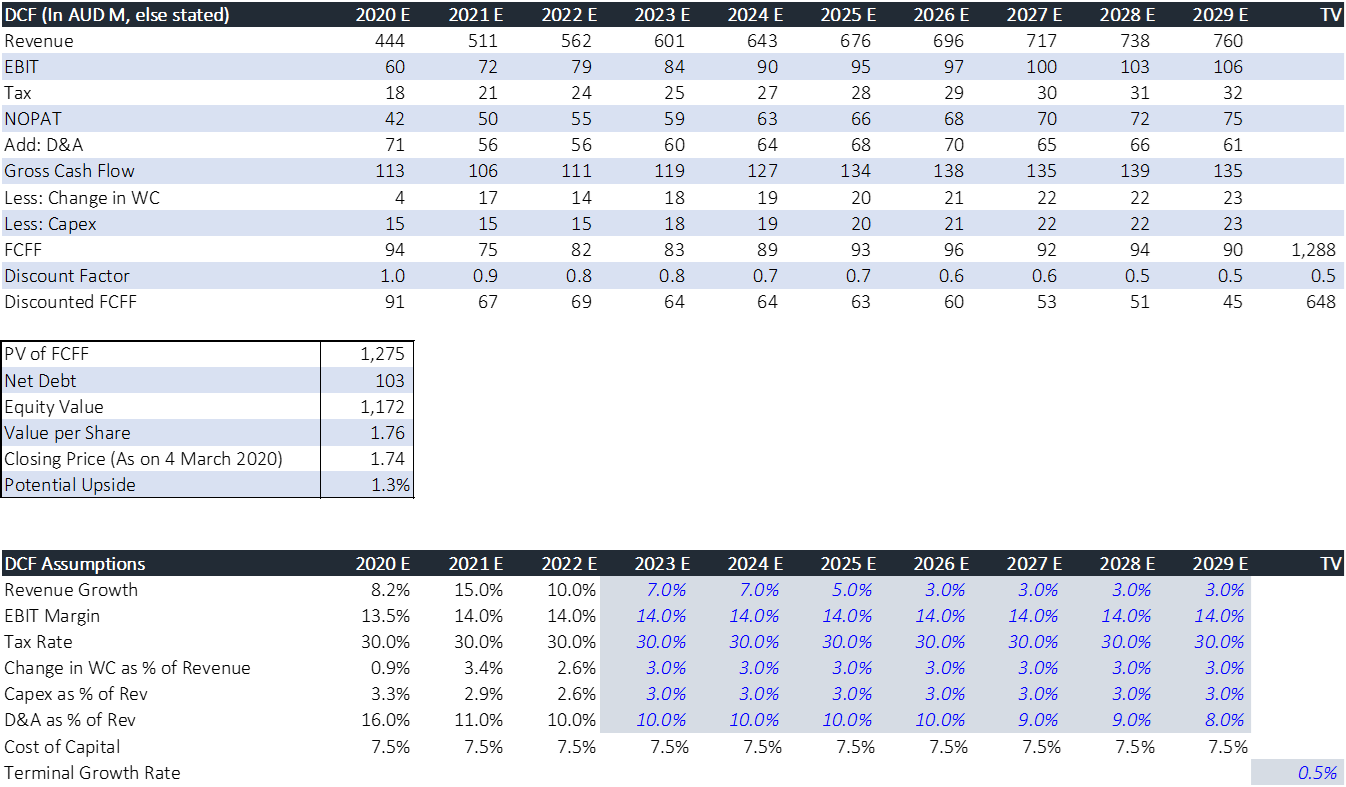
Note: All the recommendations and the calculations are based on the closing price of 4 March 2020. The financial information has been retrieved from the respective company’s website and Thomson Reuters
1In this report precious metal has not been included in the Non-Ferrous Metal
Disclaimer
The advice given by Kalkine Pty Ltd and provided on this website is general information only and it does not take into account your investment objectives, financial situation or needs. You should therefore consider whether the advice is appropriate to your investment objectives, financial situation and needs before acting upon it. You should seek advice from a financial adviser, stockbroker or other professional (including taxation and legal advice) as necessary before acting on any advice. Not all investments are appropriate for all people. Kalkine.com.au and associated pages are published by Kalkine Pty Ltd ABN 34 154 808 312 (Australian Financial Services License Number 425376). The information on this website has been prepared from a wide variety of sources, which Kalkine Pty Ltd, to the best of its knowledge and belief, considers accurate. You should make your own enquiries about any investments and we strongly suggest you seek advice before acting upon any recommendation. Kalkine Pty Ltd has made every effort to ensure the reliability of information contained in its newsletters and websites. All information represents our views at the date of publication and may change without notice. To the extent permitted by law, Kalkine Pty Ltd excludes all liability for any loss or damage arising from the use of this website and any information published (including any indirect or consequential loss, any data loss or data corruption). If the law prohibits this exclusion, Kalkine Pty Ltd hereby limits its liability, to the extent permitted by law to the resupply of services. There may be a product disclosure statement or other offer document for the securities and financial products we write about in Kalkine Reports. You should obtain a copy of the product disclosure statement or offer document before making any decision about whether to acquire the security or product. The link to our Terms & Conditions has been provided please go through them and also have a read of the Financial Services Guide. On the date of publishing this report (mentioned on the website), employees and/or associates of Kalkine Pty Ltd do not hold positions in any of the stocks covered on the website. These stocks can change any time and readers of the reports should not consider these stocks as personalised advice.
 Please wait processing your request...