
Kalkine’s Global Tariff Report provides fully independent analysis and data-driven analysis of major global sectors affected by tariff changes, evaluating the implications these shifts may have on equity valuations across those industries. The report concentrates on trade-sensitive sectors that typically experience heightened investor scrutiny during periods of tariff uncertainty. It also identifies defensive and countercyclical segments that demonstrate relative resilience or may even outperform, amid disruptions to global trade flows.
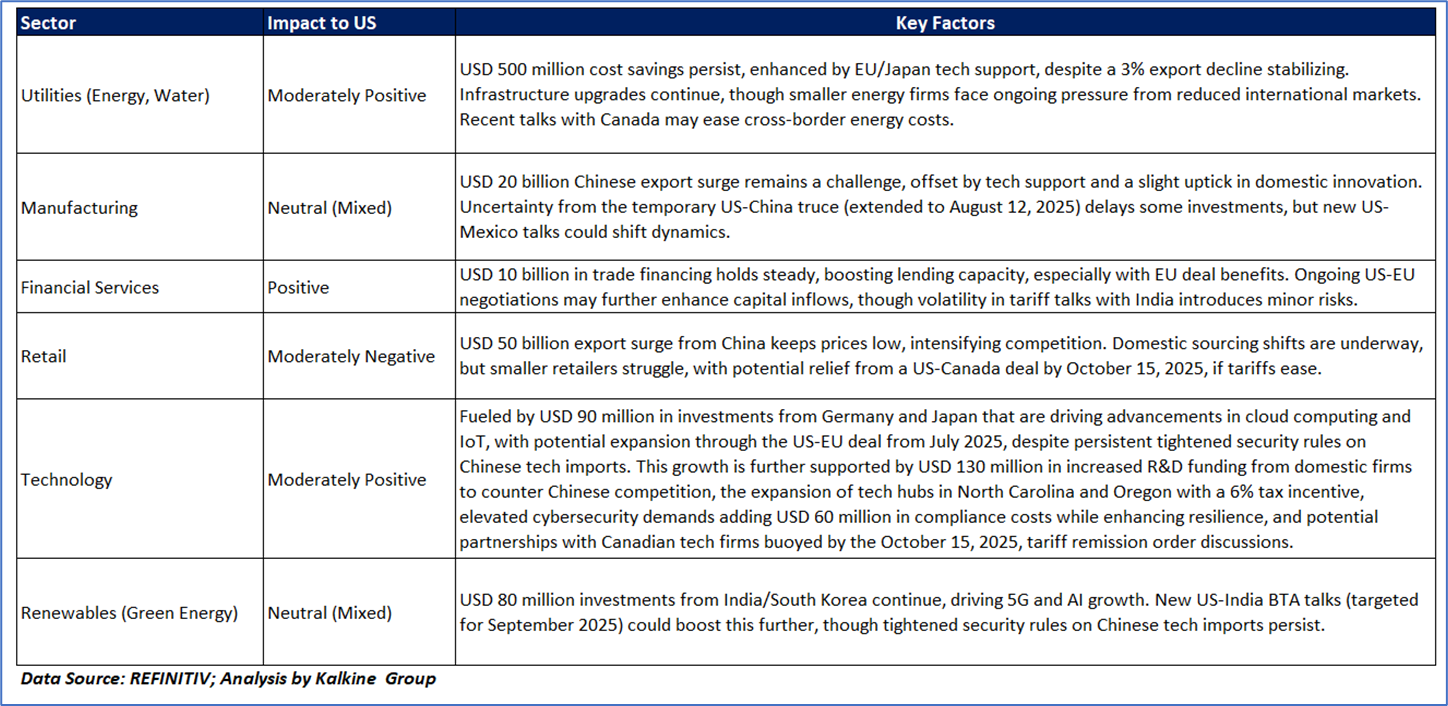
As illustrated in the table below, several key sectors in different countries are directly impacted by the recent tariff announcement from President Trump.
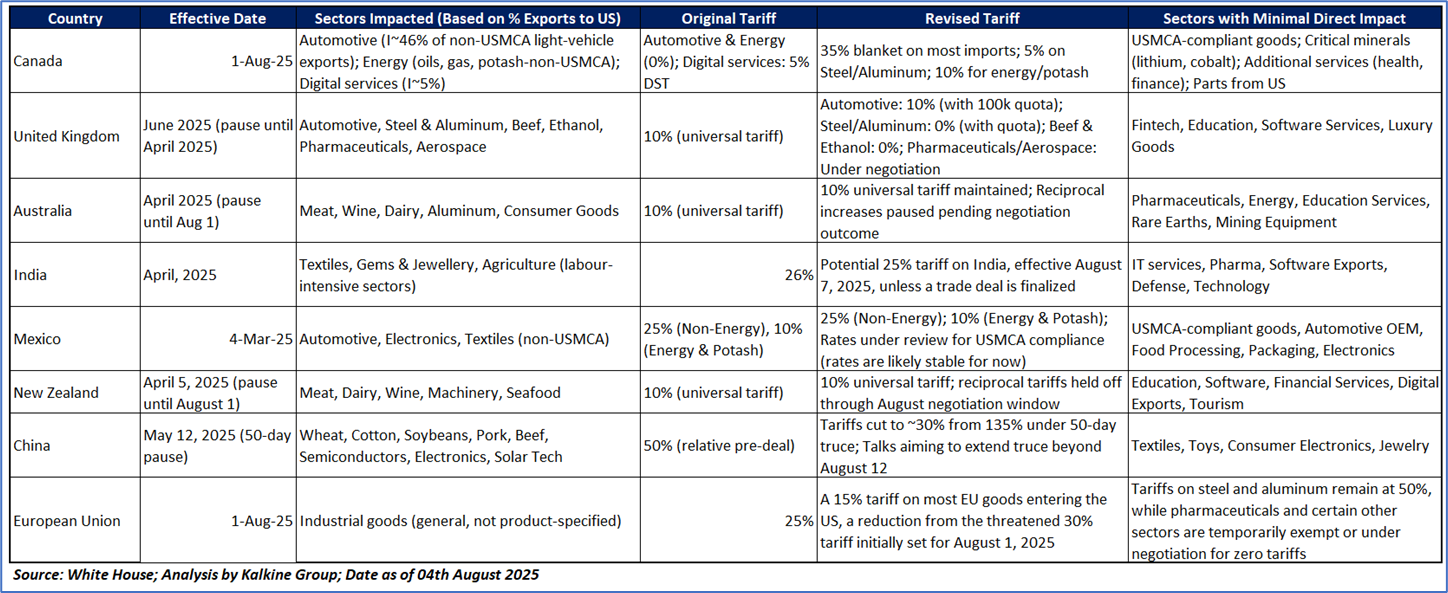
Latest Updates on Global Tariffs by Trump’s Administration
Key Developments (August 04th, 2025)
Canada:
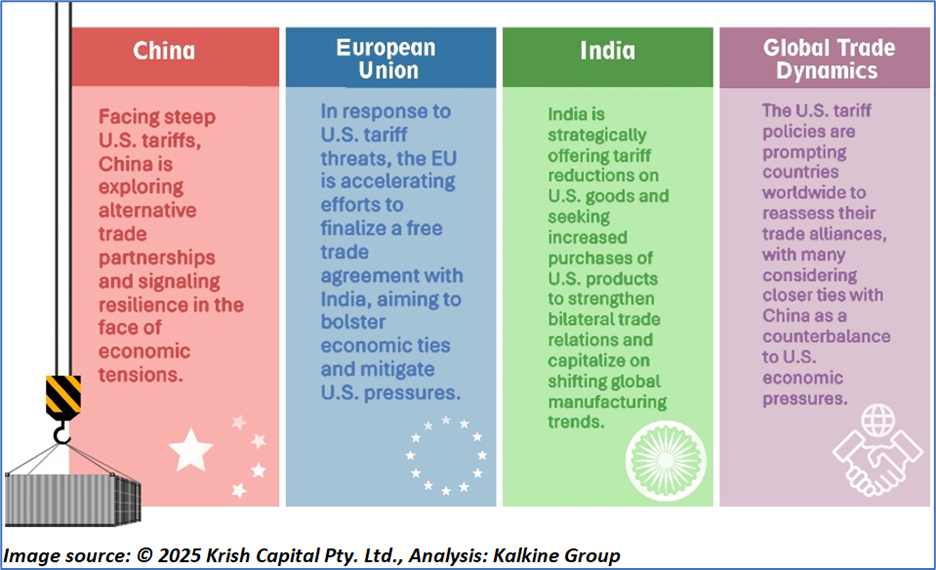
China:
European Union:
India:
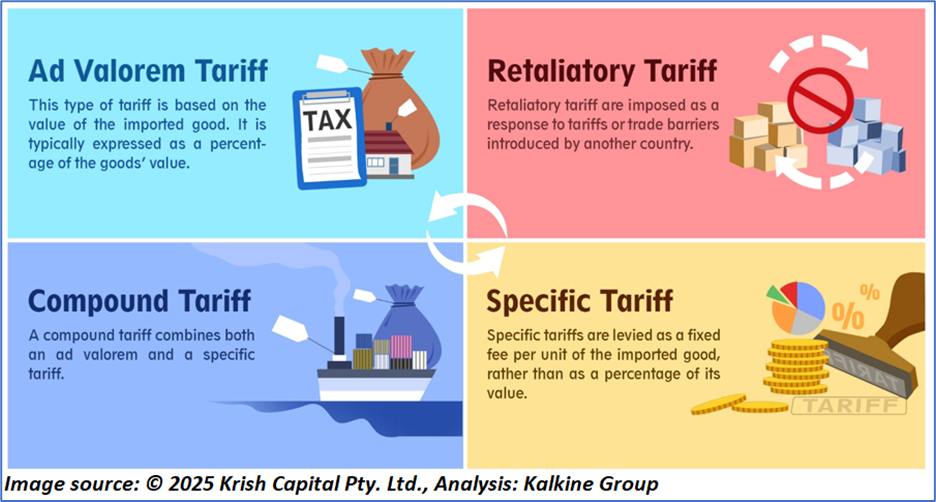
What are the different types of Tariffs?
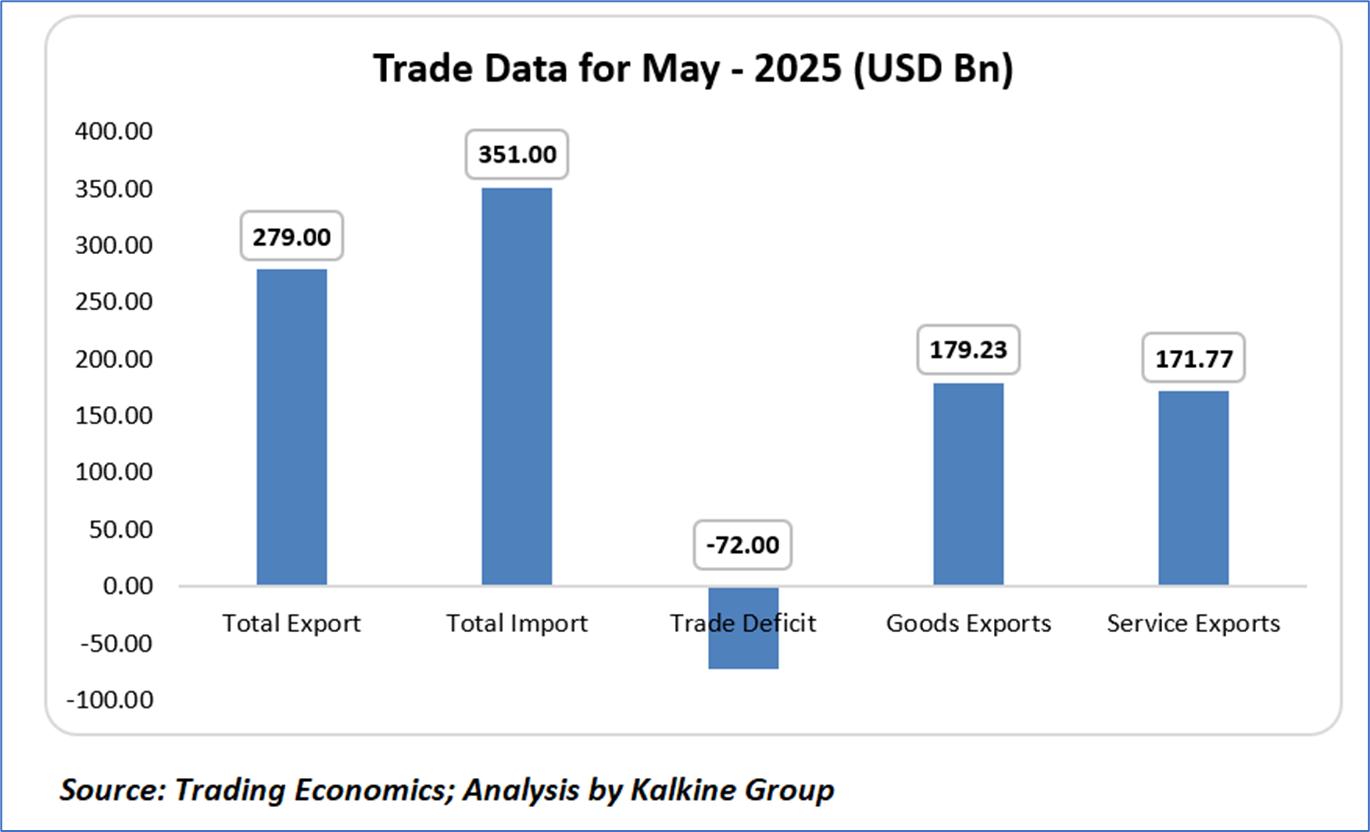
A Snapshot of USA’s Trade Size
In May 2025, the US economy exhibited a persistent trade deficit of USD72.00 billion, driven by total imports of USD351.00 billion outpacing total exports of USD279.00 billion, reflecting ongoing challenges in balancing trade amid global economic pressures and recent tariff policies, including a 10% baseline duty and higher tariffs on countries like China (30%) and Vietnam (20%). Goods exports, at USD179.23 billion, underscored strength in manufacturing sectors, while service exports reached USD171.77 billion, highlighting robust demand for US services such as technology and finance. The trade deficit, consistent with prior months, suggests that tariff-driven price increases (e.g., apparel prices projected to rise 27% long-term) may be dampening export competitiveness, particularly for goods facing retaliatory tariffs. However, the service sector’s strong performance mitigates some concerns, supporting economic resilience. The US must navigate these trade dynamics carefully, leveraging domestic production incentives and trade agreements to address the deficit while sustaining export growth in a tariff-heavy environment.
Impact of US Tariffs on Various Sectors
The U.S. economy is currently grappling with significant challenges, including high inflation, supply chain disruptions, and the effects of aggressive monetary policy from the Federal Reserve. Key sectors such as manufacturing, agriculture, and technology are feeling strain, particularly due to their dependence on global supply chains and export markets, with trade policies like tariffs on steel, aluminum, and electronics driving up costs for businesses and consumers alike. Despite these pressures, there’s cautious optimism in some quarters about market stabilization within the next year, though this is tempered by ongoing issues like labor shortages, energy price volatility, and political divisions. The Federal Reserve’s interest rate hikes aimed at curbing inflation—still above target levels—have slowed economic growth, raising recession risks, while strategic efforts such as trade agreements and supply chain diversification remain critical to fostering stability and mitigating prolonged uncertainty across these vital sectors.
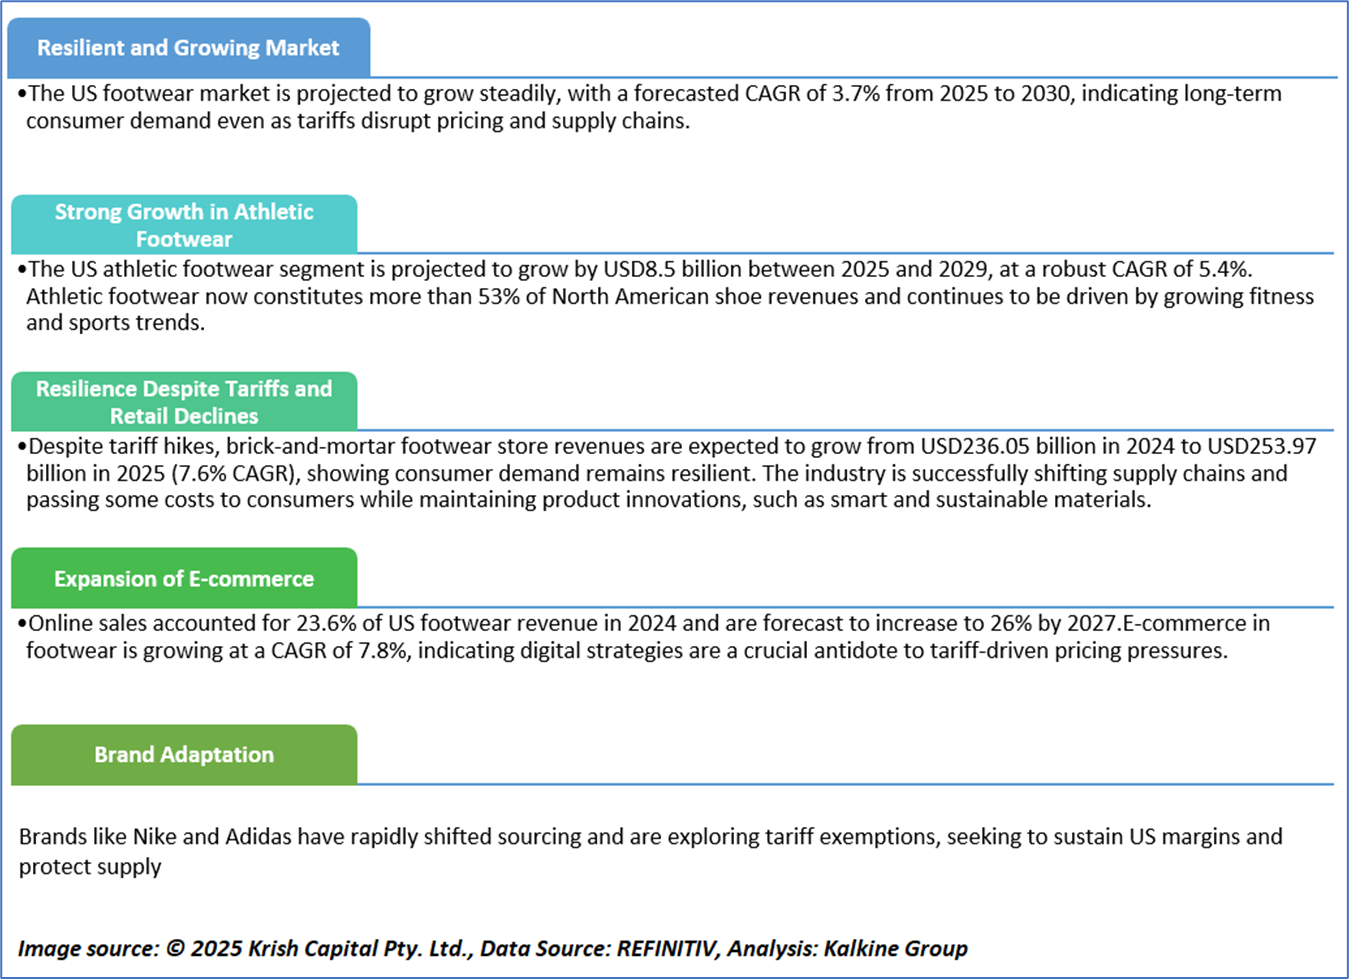
Why does the US Footwear Segment Industry look Attractive Amid Tariff Concerns?
Amid elevated Market Volatility and Tariff pressures, NIKE Inc. (NYSE: NKE) stands out as our defensive pick within the Travel & Hospitality Industry, supported by rigorous fundamental and technical research
Kalkine’s Global Tariff Report covers the Investment Highlights, Key Financial Metrics, Risks, Technical Analysis along with the Valuation, Target Price, and Recommendation on the NIKE Inc. (NKE).
Section 1: Company Overview and Fundamental Insights
1.1 Company Overview:
NIKE, Inc. (NYSE: NKE) is engaged in the designing, marketing and distributing of athletic footwear, apparel, equipment and accessories and services for sports and fitness activities. The Company's operating segments include North America; Europe, Middle East & Africa (EMEA); Greater China; and Asia Pacific & Latin America (APLA). It sells a line of equipment and accessories under the NIKE Brand name, including bags, socks, sport balls, eyewear, timepieces, digital devices, bats, gloves, protective equipment and other equipment designed for sports activities.
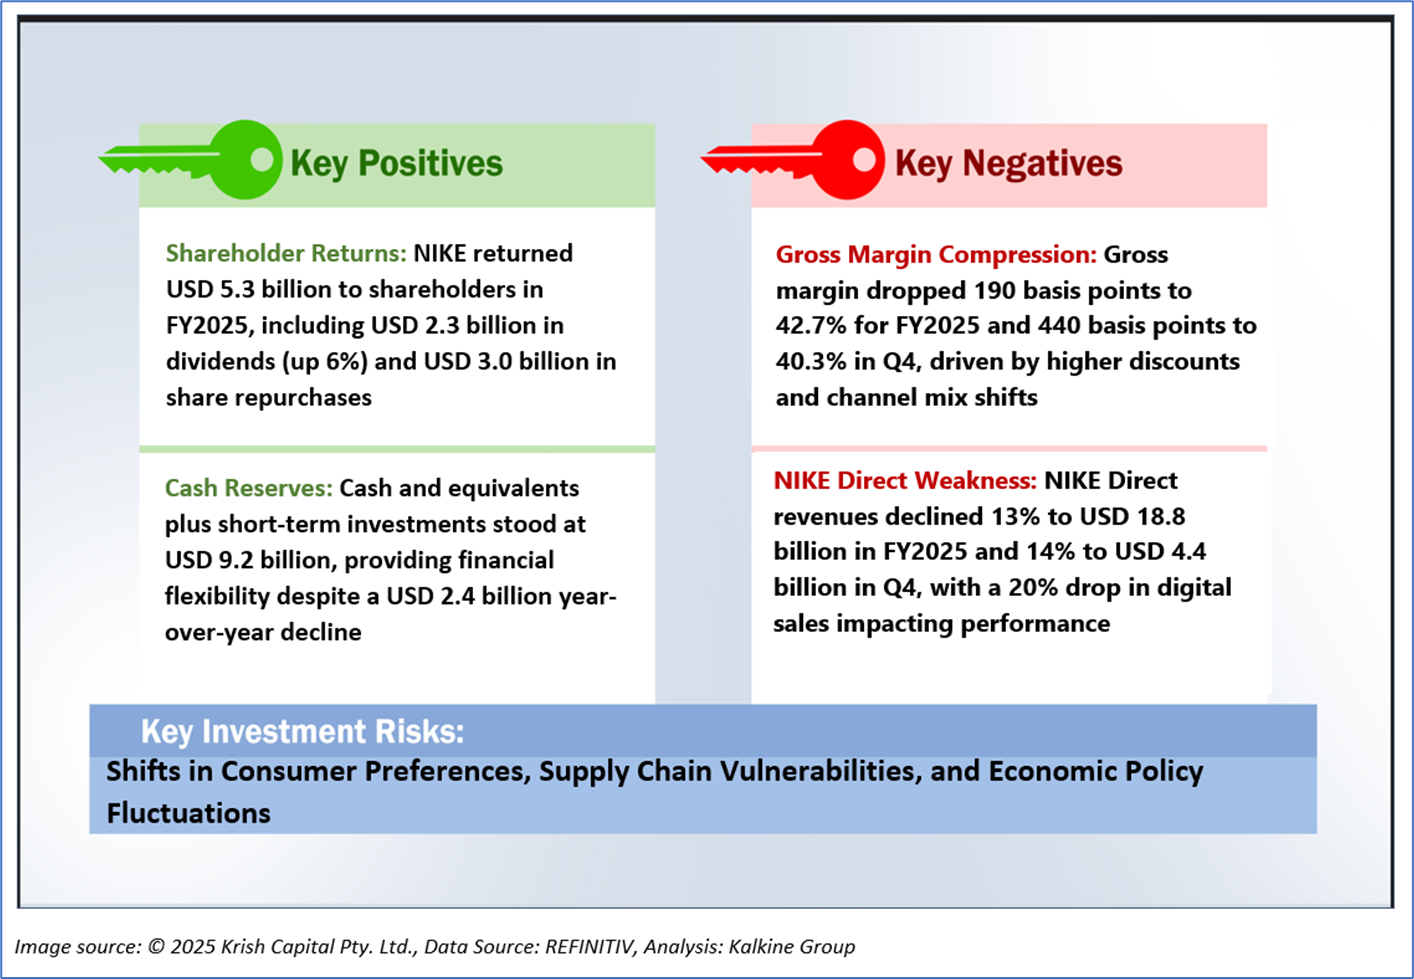
1.2 The Key Positives, Negatives, Investment Highlights and Risks
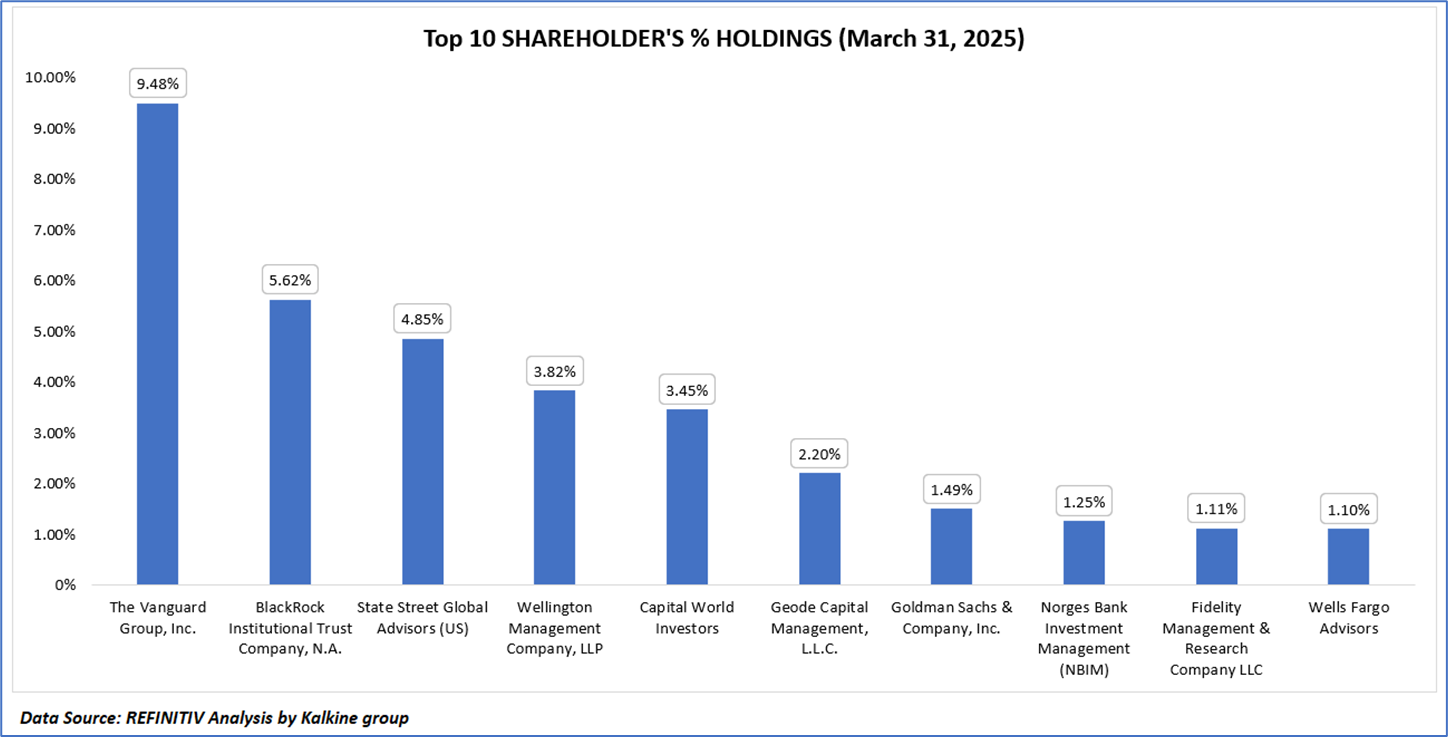
1.3 Top 10 Shareholders:
The top 10 shareholders together form ~34.37% of the total shareholding, indicating concentrated holding. The Vanguard Group, Inc. and BlackRock Institutional Trust Company, N.A. hold a maximum stake in the company at ~9.48% and ~5.62%, respectively.
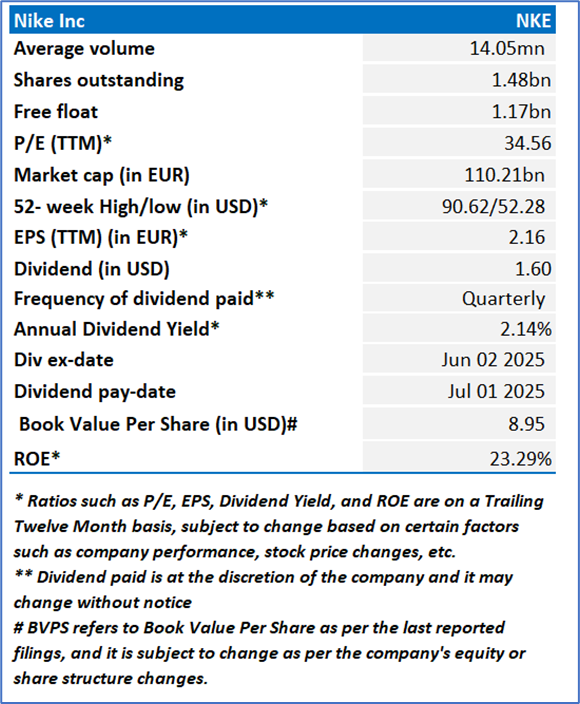
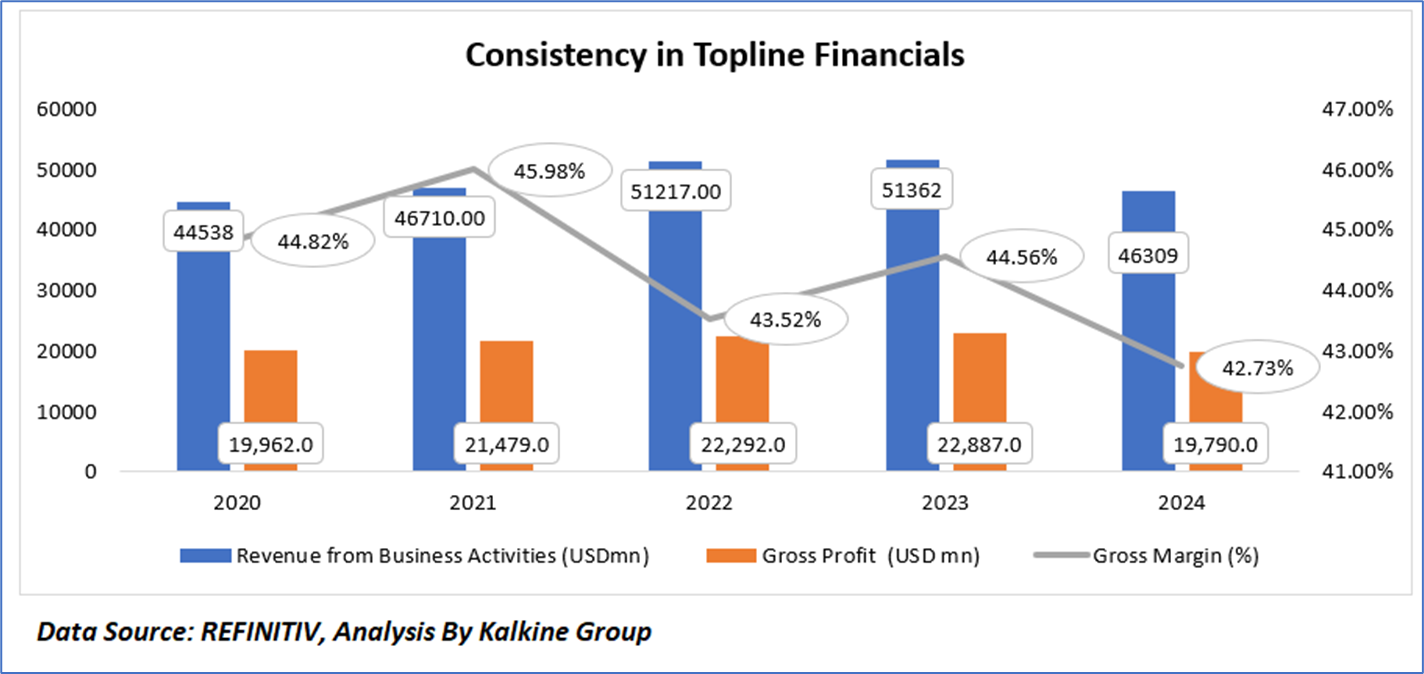
1.4 Key Metrics:
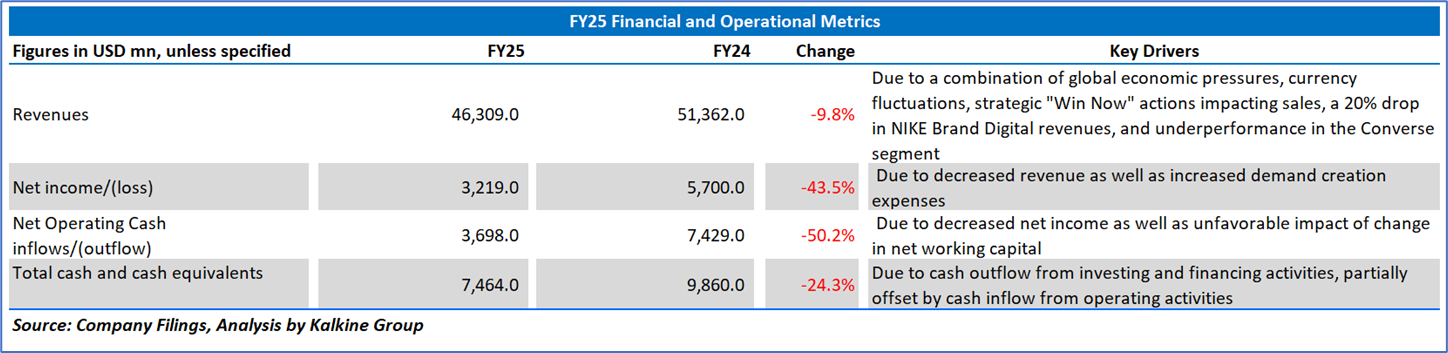
NIKE, Inc. (NYSE: NKE) exhibited a fluctuating revenue trajectory from 2020 to 2024, with revenue from business activities rising from USD 44,538 million in 2020 to a peak of USD 51,362 million in 2023, before declining to USD 46,309 million in 2024, reflecting a 9.8% drop year-over-year, likely influenced by global economic pressures, currency fluctuations, and strategic "Win Now" actions impacting sales. Gross profit followed a similar pattern, increasing from USD 19,962 million in 2020 to a high of USD 22,887 million in 2023, but contracting to USD 19,790 million in 2024, a 13.5% decrease, while the gross margin declined from 44.82% to 42.73% over the same period, driven by higher discounts, channel mix shifts, and increased inventory obsolescence reserves, suggesting a need for enhanced cost management and product pricing strategies to restore profitability amidst competitive and market challenges.
Section 2: Business Updates and Financial Highlights
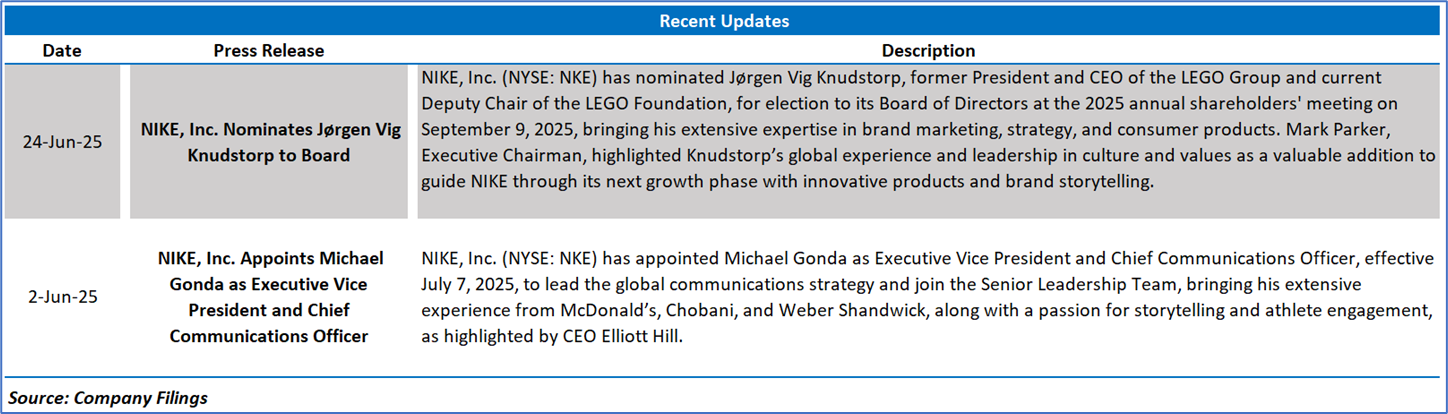
2.1 Recent Updates: The below picture gives an overview of the company’s recent activities, such as an announcement regarding dividend distribution.
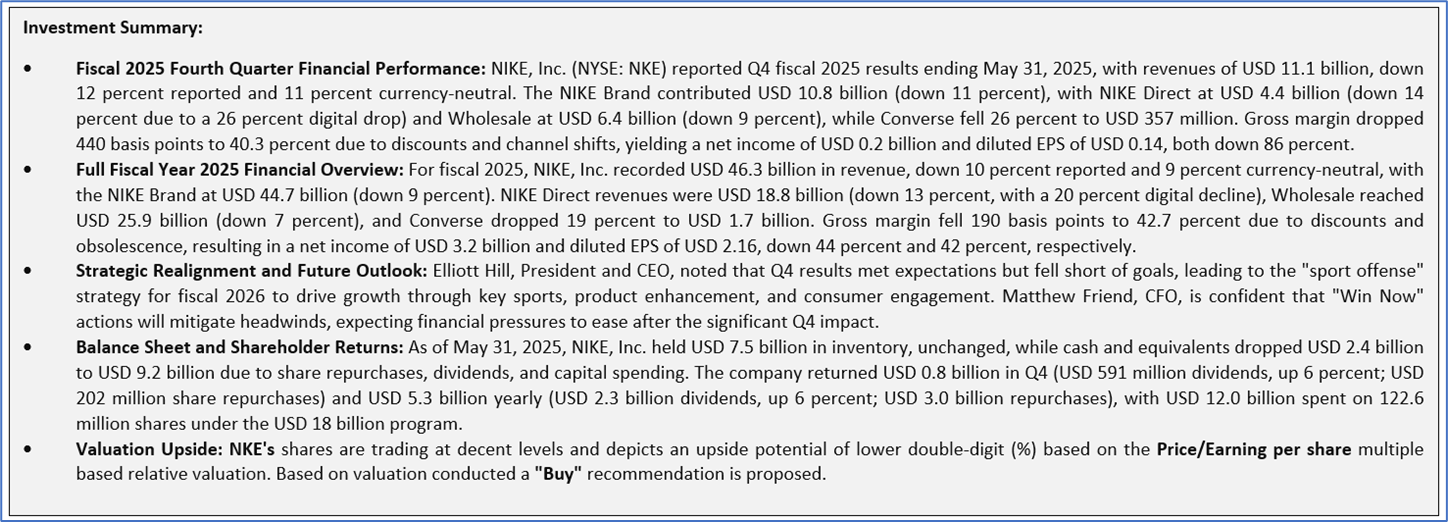
2.2 Insights into FY2025 Financial Performance:
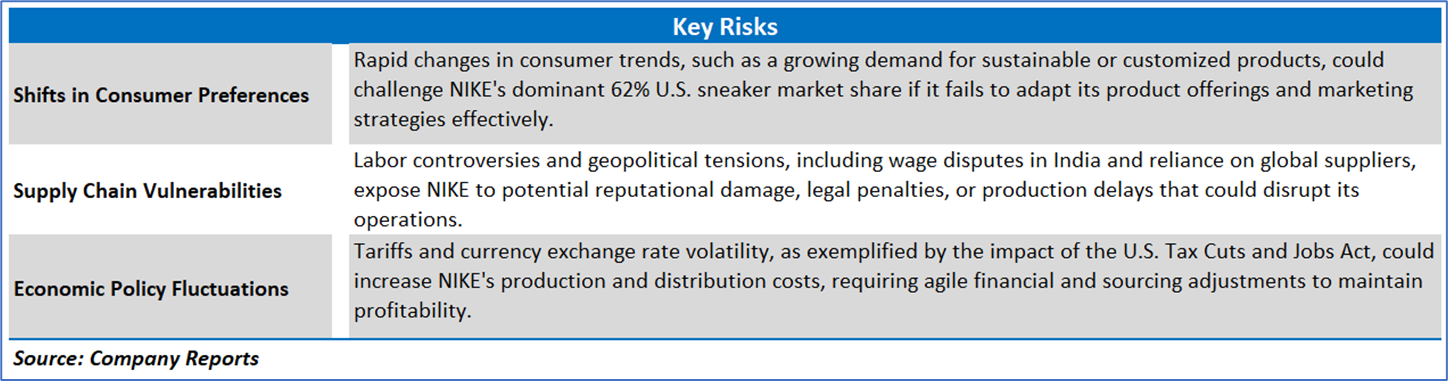
Section 3: Key Risks, Company Outlook:
Section 4: Stock Recommendation Summary:
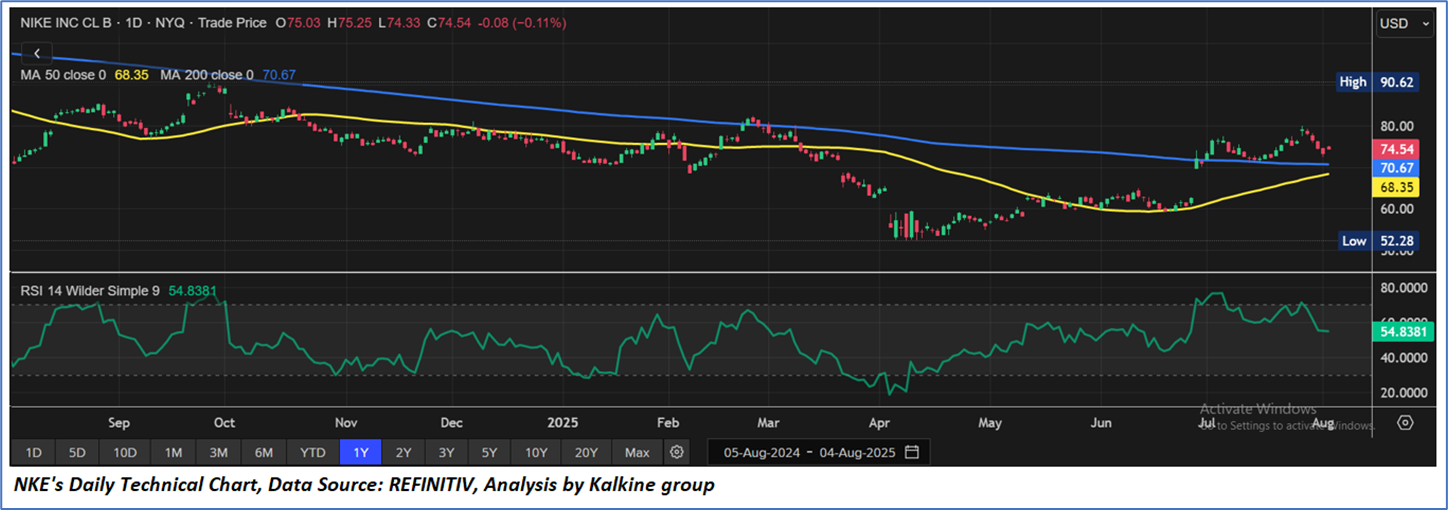
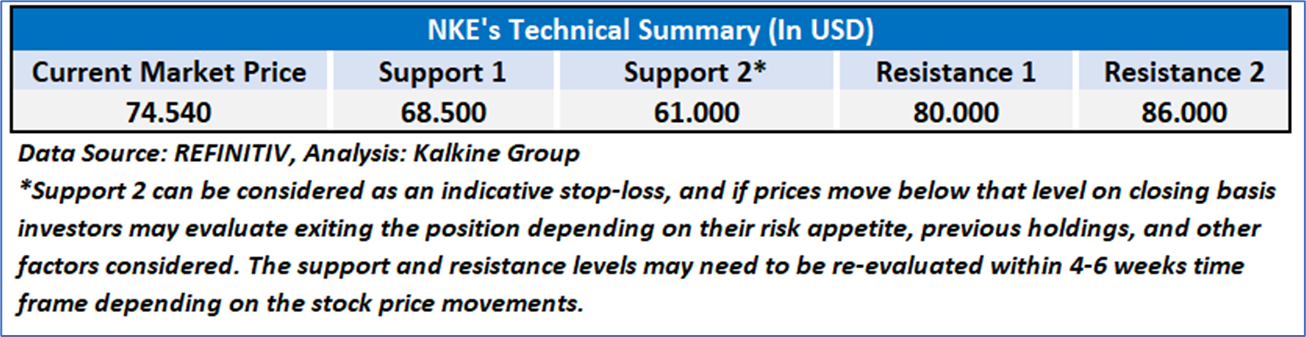
4.1 Price Performance and Technical Summary:
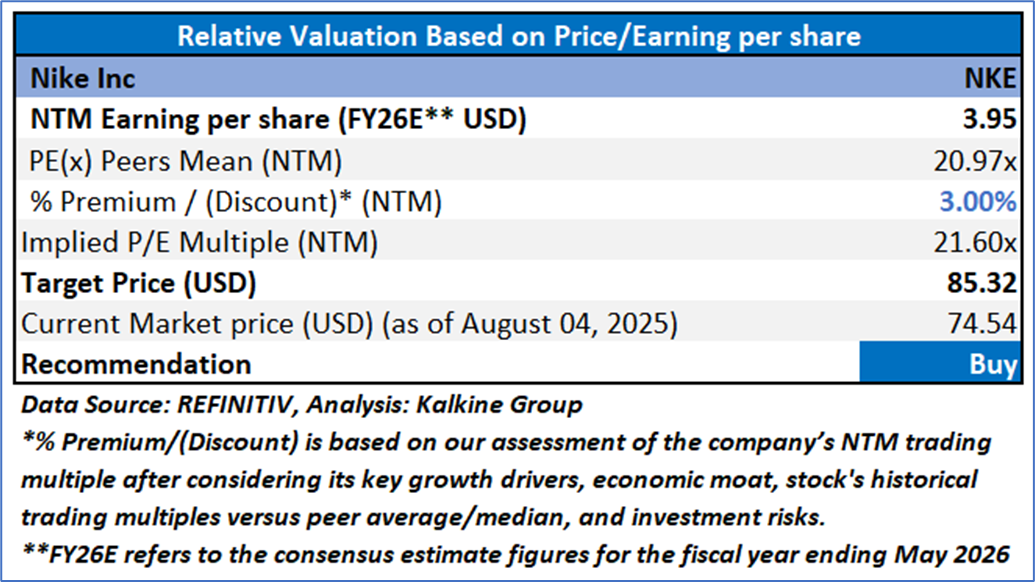
4.2 Fundamental Valuation
Valuation Methodology: Price/ Earnings Per Share Multiple Based Relative Valuation (Illustrative)

Note 1: Past performance is not a reliable indicator of future performance.
Note 2: The reference date for all price data, currency, technical indicators, support, and resistance levels as on August 04, 2025. The reference data in this report has been partly sourced from REFINITIV.
Note 3: Investment decisions should be made depending on an individual's appetite for upside potential, risks, holding duration, and any previous holdings. An 'Exit' from the stock can be considered if the Target Price mentioned as per the Valuation and or the technical levels provided has been achieved and is subject to the factors discussed above.
Note 4: Dividend Yield may vary as per the stock price movement.
Note 5: Kalkine reports are prepared based on the stock prices captured either from REFINITIV or Trading View. Typically, REFINITIV or Trading View may reflect stock prices with a delay which could be a lag of 25-30 minutes. There can be no assurance that future results or events will be consistent with the information provided in the report. The information is subject to change without any prior notice.
Technical Indicators Defined: -
Support: A level at which the stock prices tend to find support if they are falling, and a downtrend may take a pause backed by demand or buying interest.
Resistance: A level at which the stock prices tend to find resistance when they are rising, and the uptrend may take a pause due to profit booking or selling interest.
Stop-loss: In general, it is a level to protect further losses in case of any unfavorable movement in the stock prices.
This report (“Report”) has been issued by Kalkine Pty Limited (ABN 34 154 808 312) (Australian financial services licence number 425376) (“Kalkine”) and prepared by Kalkine and its related bodies corporate who are authorised to provide general financial product advice. Kalkine.com.au and its associated pages are published by Kalkine.
Any advice provided in this Report is general advice only and does not take into account your objectives, financial situation or needs. You should therefore consider whether the advice is appropriate for your objectives, financial situation and needs before acting upon it.
There may be a Product Disclosure Statement, Information Memorandum or other offer document (“Offer Document”) for the securities or other financial products referred in this Report. You should obtain a copy of the relevant Offer Document and consider it before making any decision about whether to acquire the security or financial product.
Kalkine strongly recommends that you seek advice from a financial adviser, stockbroker or other professional (including taxation and legal advice) before acting on any of the general advice in this Report or on the Kalkine website. Not all investments are appropriate for all people.
The information in this Report and on the Kalkine website has been prepared from a wide variety of sources, which Kalkine, to the best of its knowledge and belief, considers accurate. Kalkine has made every effort to ensure the reliability of the information contained in its reports (including this Report), newsletters and websites. All information represents our views at the date of publication and may change without notice.
The information in this Report does not constitute an offer to sell securities or other financial products or a solicitation of an offer to buy securities or other financial products. Our reports contain general recommendations to invest in securities and other financial products. Kalkine is not responsible for, and does not guarantee, the performance of, or returns on, any investments mentioned in this Report.
Kalkine does not issue, sell or deal in any financial products.
This Report may contain information on past performance of particular investments. Past performance is not a reliable indicator of future performance. Returns stated do not take into account transaction costs and taxes. To the extent permitted by law, and excluding any dishonesty or gross negligence by Kalkine, Kalkine disclaims and excludes all liability for any direct, indirect, implied, punitive, special, incidental or other consequential loss or damage arising from the use of or reliance on this Report, the Kalkine website and any information published on the Kalkine website without any warranties or representations by Kalkine to you. To the extent the law prohibits or limits this exclusion, Kalkine limits its liability to the resupply of services.
Please also read our Terms & Conditions and Financial Services Guide for further information. Employees and/or associates of Kalkine and its related entities may hold interests in the securities or other financial products covered in this Report or on the Kalkine website. Any such employees and associates are required to comply with certain, procedures and disclosures as required by law.
Kalkine Media Pty Ltd, an affiliate of Kalkine Pty Ltd, may have received, or be entitled to receive, financial consideration in connection with providing information about certain entity(s) covered on its website including entities covered in this Report.
Copyright 2025 Krish Capital Pty. Ltd. (ABN 61629651510). All Rights Reserved. No part of this report, or its content, may be reproduced in any form without our prior consent.
Past performance is not a reliable indicator of future performance.
 Please wait processing your request...