Company overview - Nearmap Ltd is an online PhotoMap content provider. The Company provides geospatial map technology for business, enterprises and government customers. Its segments include Australia, which is responsible for all sales and marketing efforts in Australia; United States, which is responsible for all sales and marketing efforts in the United States, and Corporate, which holds the intellectual property (IP) and product know-how that allows the Company to deliver its product offering, being online aerial photomapping. It offers solutions for various industries, such as architecture and engineering, construction, government, insurance, rail, property, roofing and solar. It provides site information, delivered to users' desktop through high-resolution PhotoMaps technology. Nearmap Insurance provides a desktop-based risk assessment solution. Nearmap Rail delivers visual analytics to mining, port and rail infrastructure. Its property solutions include Nearmap ART and Nearmap Property Tool.
.PNG)
NEA Details
Rise in global subscriptions and average revenue per subscription: Nearmap Ltd (ASX: NEA) reported 31% yoy (year on year) growth in revenue at $41.1 million while posting EBITDA of $6.0 million, which was delivered within guidance, for the financial year 2017. Further, statutory loss after tax reduced to $5.3 million against $7.1 million in FY16. The Company’s annualised contract value (ACV) has grown strongly by 29% to $47.0 million, led by portfolio expansion in both Australia and the United States. Global subscriptions have increased to over 7,800, with group average revenue per subscription (ARPS) increasing to almost $6,000. The company has developed and is deploying an expanded product suite of market leading technologies which will drive new growth opportunities. The strong performance of its US business positions NEA at a more advanced stage in its growth while Australian business has been strengthened with new leadership that brings focus to both sales and marketing. Group ACV churn fell from 13% to 10% reflecting the increasing value derived from its products by customers. Moreover, revenue growth, coupled with continued focus on cost management discipline aided in delivering EBITDA within guidance. Further, the strength and security of balance sheet following the recent capital raise gives the flexibility to invest in future growth opportunities.
.png)
Income statement summary; (Source: Company reports)
Continuous revenue growth and improving EBIT margins in Australia: Nearmap continued to deliver strong growth in Australia with 22% yoy revenue growth at $36.3 million in FY17. Notably, gross margins stayed above 90% signifying the operational leverage of the business model. ACV grew 16% yoy to $40.0 million while subscriptions grew 6% to 7,227 (30 June 2016: 6,827). Australian ACV growth continued in FY17, following a strong FY16 which included the right-sizing of a number of customer accounts and several material enterprise-customer upsells. Moreover, a renewed focus on customer retention saw reduction in ACV churn. Further, a new sales and marketing leadership team was hired in H2 FY17 to build a sustainable platform for future growth. The Australian portfolio is diversified by industry and by customer subscription size. Architecture, Construction and Engineering represented the largest single sector at 27% of the total ACV portfolio. Further, customer subscription sizes range from small businesses through to Australia’s largest enterprises (over one third of the total ACV portfolio).
.png)
P&L Summary – Australia; (Source: Company reports)
Revenue growth outpaces cost of revenue growth in US: The US business accounted for 11% of FY17 group revenue while contributed 33% to FY17 group revenue growth. Further, US ACV of $7.0M (converted to AUD) puts the Year 5 revenue run rate ahead of the Australian equivalent. While the growth to date has been achieved in the 2D market, oblique and 3D product capabilities provide further market expansion opportunities. The US portfolio is diversified across a range of industries with focus on Government, Solar and Architecture, Construction & Engineering industries, supplemented by significant wins in Insurance & Property. Importantly, NEA witnessed significant success with enterprise & government clients and 71% of the US ACV portfolio comprises customers with subscriptions >$15k, compared with 56% in Australia. For FY17, revenue from United States increased to USD$3.2 million from USD$0.7 million in FY16 and gross margin achieved breakeven level as revenue growth outpaces cost of revenue growth. ACV has more than tripled to USD$5.3 million (30 June 2016: USD$1.5M) while subscriptions were up 67% to 605 (30 June 2016: 363). Meanwhile, the shipment of the first full production hypercamera2 to the United States was a major milestone as this enabled NEA commence commercial oblique and 3D imagery capture in that market. Significantly, HyperCamera2 complies with applicable Federal Aviation Administration (FAA) safety requirements and this allowed the capturing to commence immediately. Importantly, shipment of the first full production HyperCamera2 enabled the commencement of full commercial capture, with significant United States and Australian coverage planned in calendar 2017.
.png)
P&L Summary – US; (Source: Company reports)
Launch of New Zealand pilot capture program: During the year, NEA has completed a one-off capture of New Zealand’s main economic areas, and has already secured the first commercial sales of the imagery to its Australian customers. The capture program was completed in March and covers approximately 72% of the New Zealand population. The launch was to address the existing Australian customer needs as they have significant business operations in New Zealand and require access to high quality location content of New Zealand similar to that which Nearmap has been providing them in Australia. Further, this capital-light pilot program allows the company to explore the expansion of Nearmap’s world leading technology further in the global location content market.
Growing market opportunity: The group has solid potential global market opportunity in traditional aerial imagery which is forecasted to rise at a CAGR of 13.5% to USD$3.3 billion by 2023. The group believes that their unique subscription platform can penetrate more customer applications and industries for which location content is used leading to a better addressable market than the traditional market. The group’s content capture and delivery platform, subscription model and ability to integrate with third party applications is leading to expand their presence in Australia and become a disruptor in the US.
Australian free cash flows continue to self-Fund US investment: The group’s cash holdings increased to $28.3M (30 June 2016: $12.2 million) as at June 30, 2017, primarily driven by the receipt of proceeds from the Group’s capital raise in November 2016. In November 2016, it had raised $20 million (28.6 million new shares issued at the offer price of $0.70) from the institutional investors. The funds were deployed for further product development and growth opportunities to expand the capture footprint in both Australia and the US, and to develop HyperCamera2 units for oblique imagery capture. During FY17, the AU segment generated free cash flows of $21.8 million, with cash receipts of $41.9 million offset by payments of $20.1 million for sales and marketing expenses, allocation of corporate expense payments, capture costs and related net GST payments. The US segment consumed free cash flows of $14.5 million, with cash receipts of $6.2 million offset by payments of $20.7 million on sales and marketing expenses etc.
.png)
Nearmap's net cash flow - FY17 (Source: Company reports)
Entering a next phase of growth: NEA is in a strong position as it enters the next phase in its growth and look ahead to FY18 focussed on executing further growth and rolling out the HyperCamera2 capture program. This patented technology enables it to deliver high resolution oblique imagery and 3D products to its customers, in addition to core 2D imagery. In the US, ACV portfolio is expected to double while gross margins are also expected to be positive and accelerated roll-out of HyperCamera2 focussed on capturing is in H1FY18. On the other hand, in Australia, double digit ACV growth is expected with constant margins coupled with incremental investment in targeted sales and marketing capability, focussed on maintaining a strong sales team contribution ratio.
.png)
Group ACV portfolio; (Source: Company reports)
Stock Performance: NEA stock has declined 13.8% on year to date basis while it is up 16.7% in the past one year (as on September 11, 2017). The company has a profitable business in Australia and continues to win customers in the US. Currently, NEA’s near-term success is tied to U.S where it has been investing to build a profitable business as the global aerial imagery market is forecasted to rise at a CAGR of 13.5% to USD$3.3 billion by 2023. NEA business is well positioned for growth given the expected benefits from the U.S. business supported by a strong balance sheet and established business model in Australia. We believe that the recent decline (down 10.5% in the last one month) proffers a good investment opportunity to enter at low levels. We give a “Buy” recommendation on the stock at the current price of $0.60
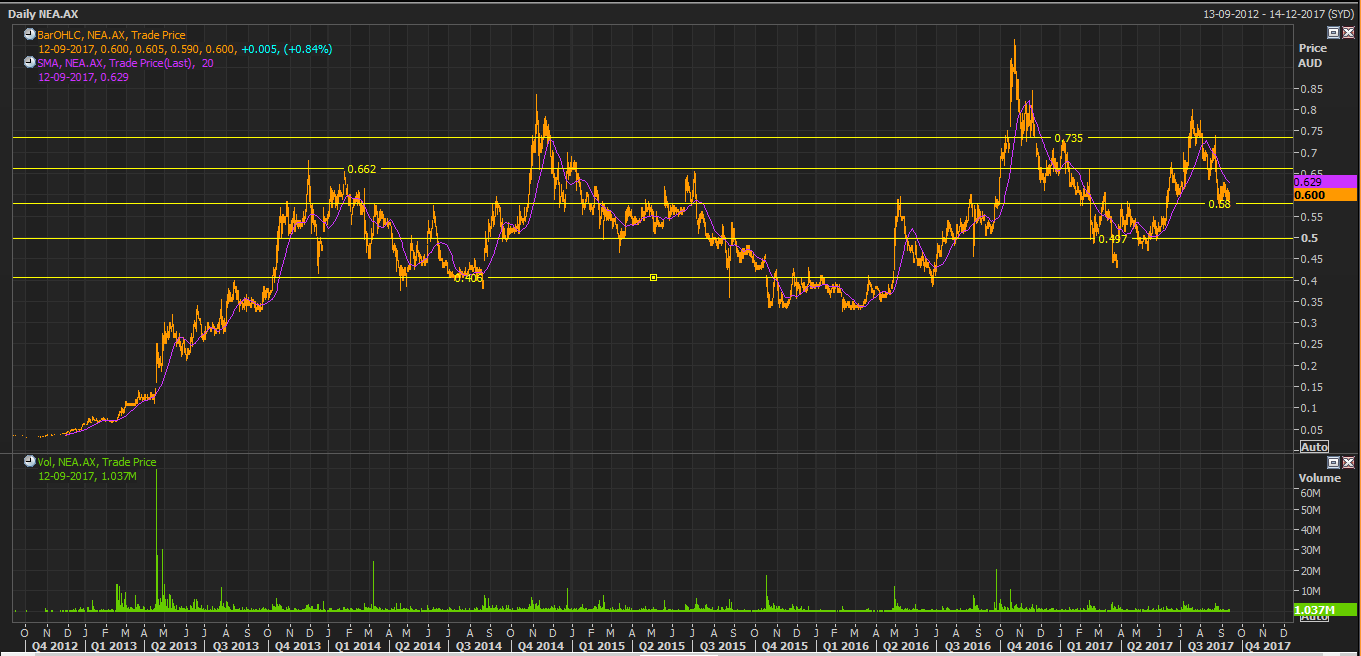
NEA Daily Chart (Source: Thomson Reuters)
Disclaimer
The advice given by Kalkine Pty Ltd and provided on this website is general information only and it does not take into account your investment objectives, financial situation or needs. You should therefore consider whether the advice is appropriate to your investment objectives, financial situation and needs before acting upon it. You should seek advice from a financial adviser, stockbroker or other professional (including taxation and legal advice) as necessary before acting on any advice. Not all investments are appropriate for all people. Kalkine.com.au and associated pages are published by Kalkine Pty Ltd ABN 34 154 808 312 (Australian Financial Services License Number 425376). The information on this website has been prepared from a wide variety of sources, which Kalkine Pty Ltd, to the best of its knowledge and belief, considers accurate. You should make your own enquiries about any investments and we strongly suggest you seek advice before acting upon any recommendation. Kalkine Pty Ltd has made every effort to ensure the reliability of information contained in its newsletters and websites. All information represents our views at the date of publication and may change without notice. To the extent permitted by law, Kalkine Pty Ltd excludes all liability for any loss or damage arising from the use of this website and any information published (including any indirect or consequential loss, any data loss or data corruption). If the law prohibits this exclusion, Kalkine Pty Ltd hereby limits its liability, to the extent permitted by law to the resupply of services. There may be a product disclosure statement or other offer document for the securities and financial products we write about in Kalkine Reports. You should obtain a copy of the product disclosure statement or offer document before making any decision about whether to acquire the security or product. The link to our Terms & Conditions has been provided please go through them and also have a read of the Financial Services Guide. On the date of publishing this report (mentioned on the website), employees and/or associates of Kalkine Pty Ltd do not hold positions in any of the stocks covered on the website. These stocks can change any time and readers of the reports should not consider these stocks as advice or recommendations.
Past performance is not a reliable indicator of future performance.
 AU
AU

 Please wait processing your request...