Kalkine has a fully transformed New Avatar.

Company overview - Nearmap Ltd is an online PhotoMap content provider. The Company provides geospatial map technology for business, enterprises and government customers. Its segments include Australia, which is responsible for all sales and marketing efforts in Australia; United States, which is responsible for all sales and marketing efforts in the United States, and Corporate, which holds the intellectual property (IP) and product know-how that allows the Company to deliver its product offering, being online aerial photomapping. It offers solutions for various industries, such as architecture and engineering, construction, government, insurance, rail, property, roofing and solar. It provides site information, delivered to users' desktop through high-resolution PhotoMaps technology. Nearmap Insurance provides a desktop-based risk assessment solution. Nearmap Rail delivers visual analytics to mining, port and rail infrastructure. Its property solutions include Nearmap ART and Nearmap Property Tool.
.PNG)
NEA Details
Strong First Half of FY17 Financial Performance: Nearmap Ltd (ASX: NEA) has reported about 38% growth in the revenue of $19,426K in the first half of FY17 as compared to the corresponding prior half year revenue of $14,141K. The total subscription revenue grew by 38%, up to $19,090K during the period from $13,800K in the prior corresponding period (pcp) which reflects the continuing customer growth in Australia and an acceleration of growth in the US. The nature of the subscription model determines that the first half of FY 17 incremental Annualized Contract Value (ACV) will drive the second half of FY 17 revenue growth. Moreover, in the 1H 2017, the company posted the gross margin of 82%, which is a 1.9 percentage point growth on pcp. NEA in 1H 17 has reported for 41% growth on pcp gross profit and there was only a 6% increase in expenses. The company posted the positive EBITDA in the 1H. NEA’s net loss after tax for the half year to December 31, 2016 fell 10% to $2,953K, on the prior half year loss of $3,295K. Additionally, there is a 35% growth in the group ACV to $41.2M. The strong ACV growth in the portfolio is driving increased cash receipts and revenue. NEA has 7,500 customers globally, which is 16% growth on pcp due to the momentum in the customer base of both new and retained. NEA has posted 16% growth in the group Average Revenue per Customer (ARPC) on pcp to $5,500. The ARPC highlights the value the customers place on the unique offering which includes more regular capture. In addition, NEA has posted group Sales Team Contribution Ratio of more than 90%. The incremental ACV as compared to sales and marketing investment as high contribution ratios in both territories demonstrate the effectiveness and scalability of sales and marketing.
.png)
1H 17 Financial Performance (Source: Company Reports)
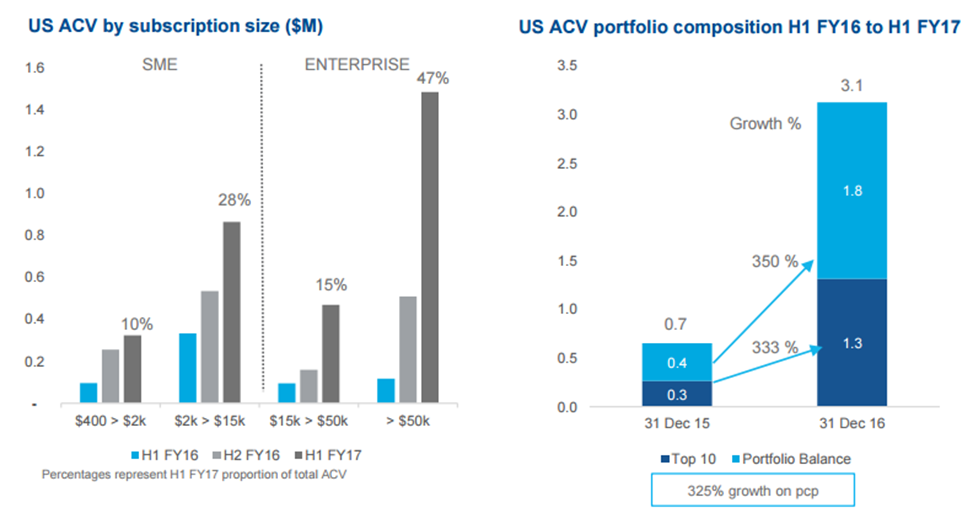
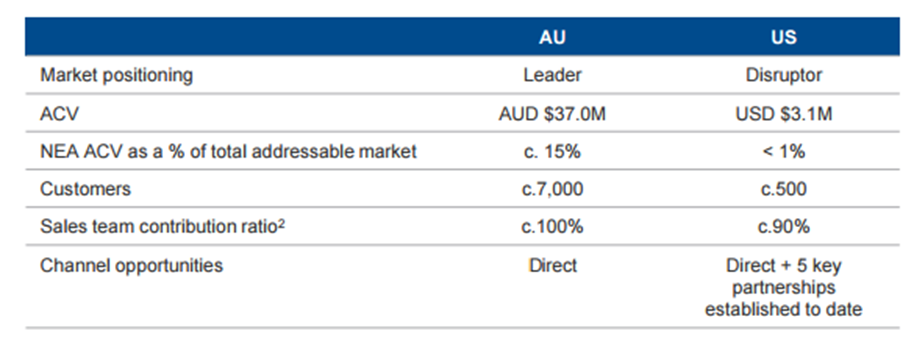
Growth in the key markets, Australia and US: The US revenue is gaining momentum as the ACV portfolio is expanding. The US business now accounts for 7% of group revenues and forms for 23% of group revenue growth when compared to pcp. In the US, the revenue growth driving gross margin improvements and the restructuring of US operations in FY16 and subsequent investment in sales and marketing capabilities are delivering efficient and scalable growth. Therefore, the second half FY16 sales and marketing expenses are lower than they were in the first half FY16 due to temporary restructuring of US operations. The group’s US ACV reached USD$3.1 million as of December 31, 2016 as compared to USD$0.7 million in the prior corresponding period. US Customers grew rapidly to 485 during the period as compared to 156 in the pcp. The group reported a US revenue of USD$1.0 million during the period from USD$0.2 million in pcp. But gross profit reached USD$(0.4) million but better than USD$(0.9) million in pcp. As per the Australia segment performance, they witnessed an ongoing revenue and EBIT growth. There is a 30% increase in the group’s Australia segment revenue as compared to pcp due to the both new customer wins and upsell to existing customers. The increased ACV has translated to revenue and there is consistency and predictability of gross margin, with stability of cost of sales (capture cost amortization). ACV surged 25% to $37.0 million from $29.6 million in the prior corresponding period. Customers improved 11% to 7,012 from 6,310 in the pcp. Accordingly, gross profit enhanced 32% to $16.2 million in the first half of 2017 from $12.3 million in pcp while EBIT surged 46% to $10.2 million from $7.0 million in pcp. The sales and marketing expenses continue to drop as a percentage of revenue (from 27% in H1 FY16 to 24% in H1 FY17) and shows the ongoing productivity improvements in sales and marketing. Additionally, the positive cash flows from Australian operations continue to fund investment in the US.
US Performance in the First Half of 2017 (Source: Company Reports)
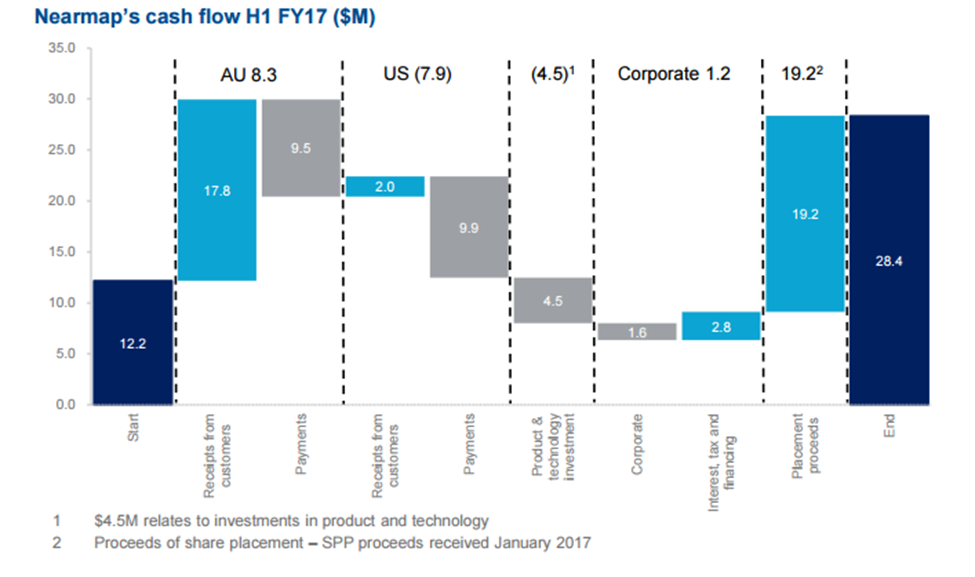
Funds Raised for Accelerated Growth: NEA in November 2016 had raised $20 million before costs (28.6 million new shares issued at the offer price of $0.70) from the institutional investors. The funds have been said to be used to expand the group's sales and marketing capabilities, to expand the capture footprint in both Australia and the US, and to develop HyperCamera2 units for oblique imagery capture. Therefore, the November 2016 capital raising provides funds to further invest in the product development and growth opportunities. However, the investment initiatives would have an impact on short term margins before delivering positive returns on the capital employed and long term cash flows. Meanwhile, the group had a cash balance of $28.4 million as of December 31, 2016 as compared to $12.2 million as of June 2016. This is indicative of a strong balance sheet, and the group does not have a debt.
Cash Flow Waterfall (Source: Company Reports)
FY 17 Outlook: NEA has affirmed the FY 17 EBITDA outlook, and expects the EBITDA for FY 17 to be in the range of $4.5M– 6.5M. NEA’s FY 17 key priorities are continued growth in Australia, drive strong growth in the US and technology investment to create new markets. The investment in sales and marketing will deliver continued growth in the customers and ACV. There will be accelerated growth in US through the improved performance and increased investment in the sales and marketing. NEA expanded investment in 3D product including roof modelling and shadow map APIs will drive further expansion of the addressable market. Moreover, the AU capture program investment will have multiple coverage per annum in developing areas. There is refreshed marketing campaigns designed to broaden the awareness and retain the existing customer base. The first HyperCamera2 captures of Australia are to be rolled out in H2 FY17 and the HyperCamera2 captures of a significant portion of the US capture area will be conducted in CY17. Therefore, the second half of FY17 will see the build of additional HyperCamera2 systems for oblique imagery capture in the US and Australia. The existing market for the oblique imagery will be served through product capability such as export and streaming.
Target Market Opportunity: The group has solid potential global market opportunity in traditional aerial imagery which is forecasted to rise at a CAGR of 13.5% to USD$3.3 billion by 2023. The group believes that their unique subscription platform can penetrate more customer applications and industries for which location content is used leading to a better addressable market than the traditional market. The group’s content capture and delivery platform, subscription model and ability to integrate with third party applications is leading to gain their presence in Australia and has been a disruptor in the US.
Market Opportunity (Source: Company Reports)
Stock Performance: NEA stock has fallen over 37.68% in this year to date (as of March 27, 2017) as investors were expecting a better expansion of the group’s products in the USA and Australia. On the other hand, in the first half of FY 17, there is an ongoing positive trend in the key operational metrics, which led into continued revenue and EBIT growth in Australia and in the US. The group’s cost management led to a second successive period of positive EBITDA. NEA business is positioned for growth given their solid potential opportunity supported by a strong balance sheet with enhanced proceeds of the November capital raise, clear strategy and established business model. The recent decline in the stock price can be leveraged as an investment opportunity. We give a “Buy” recommendation on the stock at the current price of – $ 0.44
.png)
NEA Daily Chart (Source: Thomson Reuters)
Disclaimer
The advice given by Kalkine Pty Ltd and provided on this website is general information only and it does not take into account your investment objectives, financial situation or needs. You should therefore consider whether the advice is appropriate to your investment objectives, financial situation and needs before acting upon it. You should seek advice from a financial adviser, stockbroker or other professional (including taxation and legal advice) as necessary before acting on any advice. Not all investments are appropriate for all people. Kalkine.com.au and associated pages are published by Kalkine Pty Ltd ABN 34 154 808 312 (Australian Financial Services License Number 425376).The information on this website has been prepared from a wide variety of sources, which Kalkine Pty Ltd, to the best of its knowledge and belief, considers accurate. You should make your own enquiries about any investments and we strongly suggest you seek advice before acting upon any recommendation. Kalkine Pty Ltd has made every effort to ensure the reliability of information contained in its newsletters and websites. All information represents our views at the date of publication and may change without notice. To the extent permitted by law, Kalkine Pty Ltd excludes all liability for any loss or damage arising from the use of this website and any information published (including any indirect or consequential loss, any data loss or data corruption). If the law prohibits this exclusion, Kalkine Pty Ltd hereby limits its liability, to the extent permitted by law to the resupply of services. There may be a product disclosure statement or other offer document for the securities and financial products we write about in Kalkine Reports. You should obtain a copy of the product disclosure statement or offer document before making any decision about whether to acquire the security or product. The link to our Terms & Conditions has been provided please go through them and also have a read of the Financial Services Guide. On the date of publishing this report (mentioned on the website), employees and/or associates of Kalkine Pty Ltd currently hold positions in: BHP, BKY, KCN, PDN, and RIO. These stocks can change any time and readers of the reports should not consider these stocks as advice or recommendations.
 Please wait processing your request...