Kalkine has a fully transformed New Avatar.
Company Overview: Navigator Global Investments Limited, formerly HFA Holdings Limited, is a holding company. The Company is engaged in the provision of investment management products and services to investors globally via Lighthouse Investment Partners, LLC (Lighthouse). The Company has one segment, being the United States-based Lighthouse Group, which operates as a global absolute return funds manager for the United States and Cayman Island-based investment vehicles. Lighthouse is an investment manager dedicated to managing multi-manager hedge funds for diversification and absolute return. Lighthouse has offices in New York, Chicago, Palm Beach Gardens, London and Hong Kong. Lighthouse has an investor base that spans North America, Europe and Asia, and includes high net worth individuals, family offices, endowments, foundations, trusts, investment banks, benefit plans, pension funds, healthcare and insurance companies.
.png)
NGI Details
Record EBITDA of US$37.7 Million: Navigator Global Investments Limited (ASX: NGI) provides investment management products and services to investors globally through wholly-owned subsidiary Lighthouse Investment Partners, LLC. It has recently presented its business prospects at the Annual General Meeting and highlighted about its key business drivers, FY19 performance, and other initiatives. According to the presentation, the Group earned a record EBITDA (Earnings, before Interest, Taxes, Depreciation and Amortisation) of US$37.7 million, up 10% on 2018. During the year, NPAT (Net Profit After Tax) of the company went up by 306% to US$26.84 million from the loss of US$13.56 million. This resulted in basic EPS to go up by 306% to 16.55 US cents per share from a loss per share of 8.05 US cents per share in FY18. MAS acquisition and integration activities resulted in a significant rise in the scale of operations leading to higher operating expenses by $19.4 million compared to 2018. As at 30 September 2019, the group had AUM of US$13.53 billion, out of which Commingled Funds were US$ 4.60 billion and Single Investor Customised Solutions were US $8.93 billion. It was primarily impacted by continued outflows from the MAS (Mesirow Advanced Strategies) transitioned assets during the period.
Significant volatility and market dislocation led to negative investment results across portfolios, particularly in the global long/short space, but investment performance saw an improvement in the second half of the financial year. The company generated management fee revenue of US$105.4 million in FY19, up by 40% on the prior year. This additional revenue was driven by rising MAS assets, higher average AUM on other assets offset by a reduction in the average annual management fee rate. The company also reported a solid balance sheet with trade and other receivables of US$19.4 million (predominantly comprising management and performance fees receivable from funds and clients) and cash of US$29 million, largely generated from its operating activities.
During the period of FY15 - FY19, the company witnessed a compound annual growth rate of 13.27% in revenue and 6.9% in EBITDA. Navigator Group expects to deliver a full year FY20 EBITDA of approximately US$33.5 million consistent with the US$17.6 million of EBITDA achieved in the second half of the previous financial year. The company is also focusing on other initiatives, including platform services, corporate responsibility and sustainability and remuneration review, which might support its long-term growth prospects. We presume that favourable business prospects, healthy balance sheet, decent cash management and shareholders’ returns might help the company to gain traction among the market participants.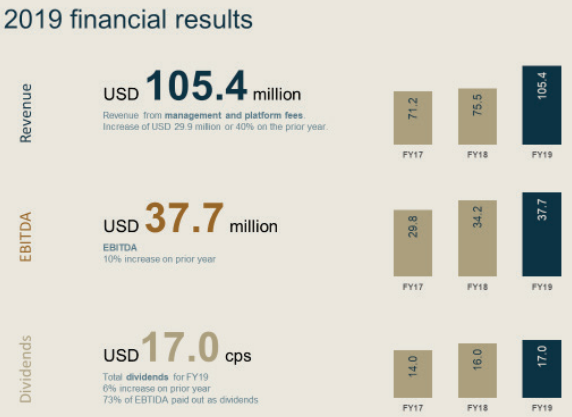
Financial Performance (Source: Company Reports)
Top 10 Shareholders: The following table provides a broader overview of the top 10 shareholders in Navigator Global Investments Limited..png)
Top 10 Shareholders (Source: Thomson Reuters)
Key Margins: During the year, net margin of the company stood at 23.4%, higher than the industry median of 20.2%. This indicates that the company is efficiently managing its costs and capable of converting its top-line into the bottom-line. Return on Equity (RoE) stood at 12.5% as compared to the industry median of 6.2%, indicating that the company is delivering decent returns to its shareholders. During the year, current ratio of the company stood at 12.27x, higher than the industry median of 1.47x, and, therefore, it can be said that NGI has better capabilities to meet its short-term obligations.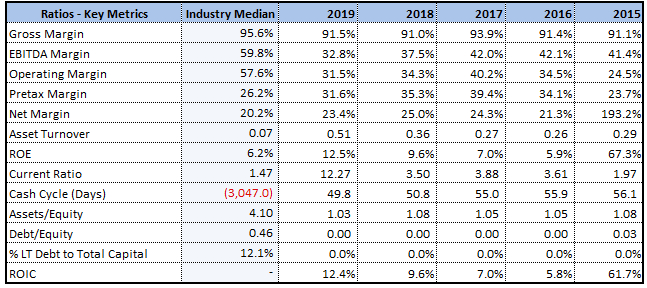
Key Metrics (Source: Thomson Reuters)
Major Assets under Management: The company has two major funds under its AUM- Commingled funds and Customised solutions. With respect to Commingled funds, Lighthouse manages a number of multi-strategy and strategy- focused funds. The funds utilise Lighthouse's proprietary managed accounts that own as well as control assets and liabilities and authorise the external fund managers to trade assets within certain guidelines.
Customised solutions, on the other hand, offers the ability to access the benefits of the managed account structure in their own customised portfolio. During the year, the combined performance went up by USD 0.05 billion to USD 14.19 billion. However, net outflows amounted to USD 2.58 billion.
Acquisition of Client Relationships from MAS: The company entered into an agreement to acquire substantially all of the client assets of MAS and there was a transition of $5.4 billion of AUM to Lighthouse. NGI expects a rise in EBITDA to continue, and the consideration that may be paid in the future would be determined under earnout payment terms over seven years. This was calculated as an agreed percentage of EBITDA generated by the transitioned assets above a floor amount, below which no payment would be made.
Composition of Revenue: During the year, revenue of the company went up by 28% to US$114.86 million from US$89.57 million. This was mainly due to an increase in management fee revenue by 40%. Notably, the average management fee for FY19 stood at 0.68% p.a., which represents the blended net management fee rate across all AUM. However, an increase in revenue from reimbursement of fund operating expenses by 35% and 12% rise in revenue from the provision of office space and services also supported an increase in total revenues. This, however, was offset by a decline in performance fee revenue by 85%.
Growth of Dividends in the last 5 years: In the time span of 5 years from FY15 to FY19, dividend of the company went up to 17 US cents per share from 10.5 US cents per share in FY15. This increase in the dividends reflects that the company is focusing on delivering returns to its shareholders. During the year, EBITDA of the company went up by 10% to US$37.7 million from US$29.8 in FY17 leading the board to declare an unfranked dividend of 9.0 US cents per share in addition to the interim dividend of 8.0 US cents per share. This brings the total dividends to 17.0 US cents per share, up by 6% on the prior year. The FY2019 combined interim and final dividends equate to a pay-out ratio of 73% of EBITDA, up from 58% in FY15. 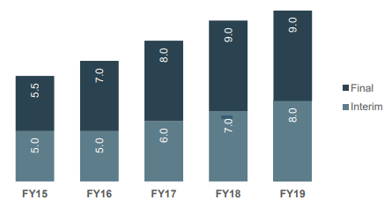
5-Year Dividend Growth (Source: Company Reports)
What to Expect Going Forward: NGI will continue to promote the managed account platform as it considers it to be a better model for investing in hedge funds. It is also focusing on improving the efficiencies by which the portfolios seek their objectives by finding the best mix of talent globally; improving access to research, data, and analysis and reducing its overall costs. Moreover, the company is expecting full-year FY20 EBITDA of around US$33.5 million. However, this takes into account 1) year-to-date actual results to 31 October 2019, 2) impacts of cost rationalisation, and 3) known subscriptions and redemptions for the December 2019 quarter. The company believes hedge funds, and more specifically portfolios focused on alpha-oriented managers with limited market and factor exposures, prove their worth across a range of potential market outcomes.
The company expects to have increased opportunities across the globe owing to a large win in February 2019 from the Middle East. In the shorter term, the company expects to see good opportunities in Asia, particularly Japan and the Middle East. It is further focusing on building new relationships while deepening the existing ones. NGI continues to rationalise its cost structure by identifying the level of overall resources needed for the business and anticipates severance costs of around $0.8 million. It further expects a reduction to employee expenses of around $1.2 million or 9.7% in 2H of the financial year as compared to 1H and approximately $3.5 million or 12% for FY20 as compared to FY19. With respect to MAS Asset acquisition, it anticipates some additional redemptions on the remaining legacy MAS AUM by the end of the calendar year, bringing the total AUM to approximately $2.1 billion. Apart from the cash inflows of over $300 million on platform from existing clients, it anticipates further inflows in the first quarter of the 2020 calendar year.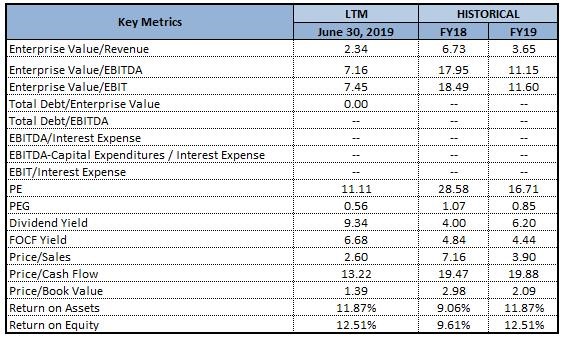
Key Valuation Metrics (Source: Thomson Reuters)
Valuation Methodology: P/BV Based Valuation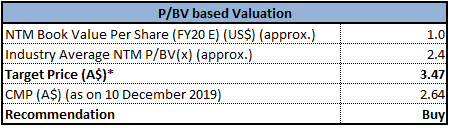
P/BV Based Valuation (Source: Thomson Reuters), 1 USD equals ~1.464 AUD (as on 10 December 2019)
Note: All forecasted figures and peers have been taken from Thomson Reuters, NTM-Next Twelve Months
Stock Recommendation: As per ASX, the stock of NGI gave a negative return of 32.24% in the past 6 months and a return of 1.13% in the last one month. The stock is currently trading close to its 52-weeks low levels of $2.290, proffering a decent opportunity for accumulation. The management of the company is of the view that the current capital management policy of shelling out a dividend of between 70-80% of EBITDA continues to strike the right balance between rewarding shareholders and ensuring that the company can retain sufficient resources in order to reap the benefits of any growth opportunities which may arise. The company is in the midst of in-depth discussions with the global asset owners with respect to utilising its platform. Given the backdrop of decent fundamentals, long-term business prospects, higher RoE than industry median, paying dividends consistently, we have valued the stock by using a relative valuation method, i.e., P/BV multiple and arrived at a target price of lower double-digit growth (in % term). Hence, we recommend a “Buy” rating on the stock at the current market price of $2.64, down by 1.859% on December 10, 2019. 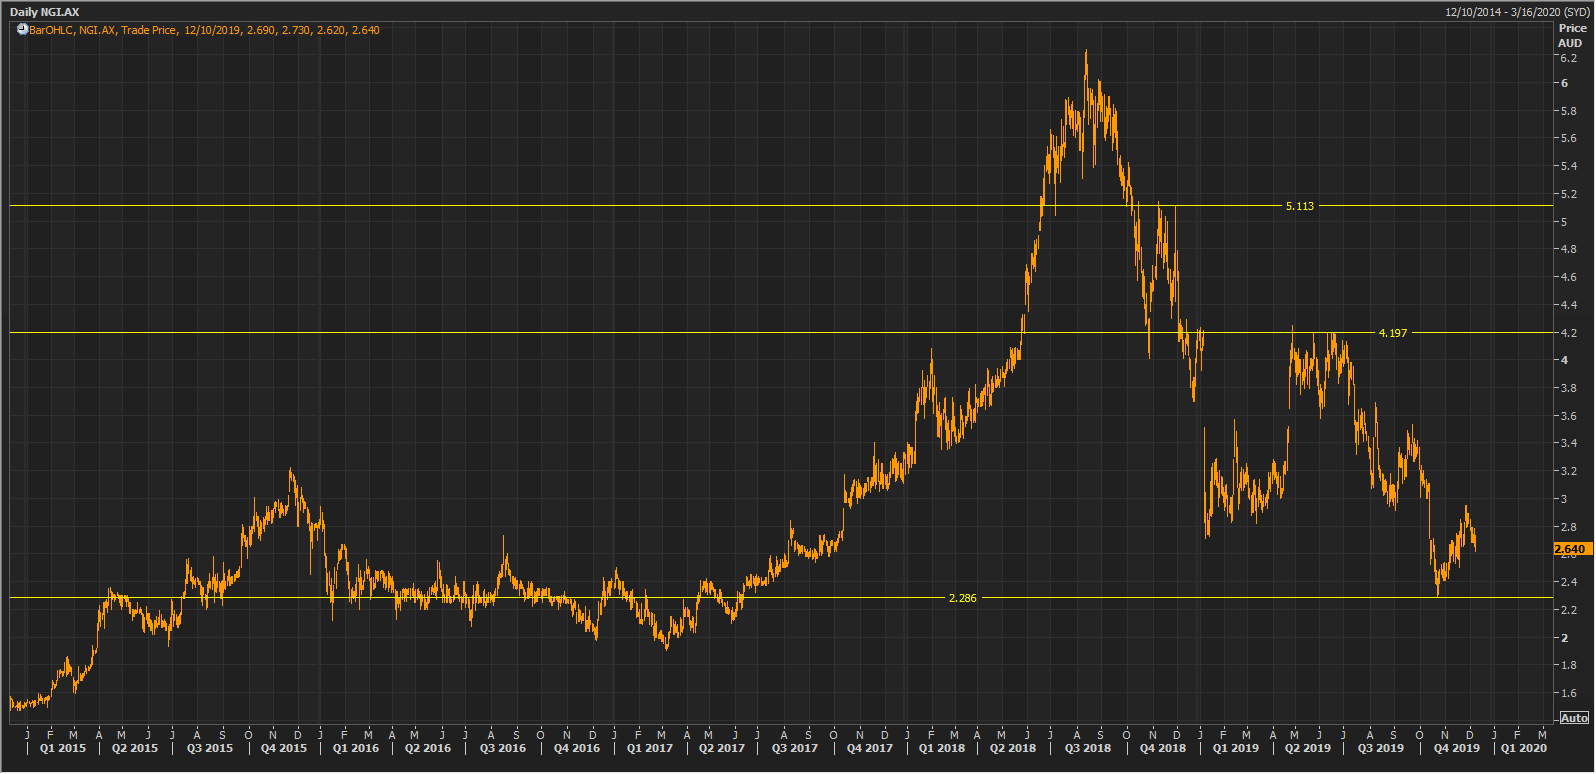
NGI Daily Technical Chart (Source: Thomson Reuters)
Disclaimer
The advice given by Kalkine Pty Ltd and provided on this website is general information only and it does not take into account your investment objectives, financial situation or needs. You should therefore consider whether the advice is appropriate to your investment objectives, financial situation and needs before acting upon it. You should seek advice from a financial adviser, stockbroker or other professional (including taxation and legal advice) as necessary before acting on any advice. Not all investments are appropriate for all people. Kalkine.com.au and associated pages are published by Kalkine Pty Ltd ABN 34 154 808 312 (Australian Financial Services License Number 425376). The information on this website has been prepared from a wide variety of sources, which Kalkine Pty Ltd, to the best of its knowledge and belief, considers accurate. You should make your own enquiries about any investments and we strongly suggest you seek advice before acting upon any recommendation. Kalkine Pty Ltd has made every effort to ensure the reliability of information contained in its newsletters and websites. All information represents our views at the date of publication and may change without notice. To the extent permitted by law, Kalkine Pty Ltd excludes all liability for any loss or damage arising from the use of this website and any information published (including any indirect or consequential loss, any data loss or data corruption). If the law prohibits this exclusion, Kalkine Pty Ltd hereby limits its liability, to the extent permitted by law to the resupply of services. There may be a product disclosure statement or other offer document for the securities and financial products we write about in Kalkine Reports. You should obtain a copy of the product disclosure statement or offer document before making any decision about whether to acquire the security or product. The link to our Terms & Conditions has been provided please go through them and also have a read of the Financial Services Guide. On the date of publishing this report (mentioned on the website), employees and/or associates of Kalkine Pty Ltd do not hold positions in any of the stocks covered on the website. These stocks can change any time and readers of the reports should not consider these stocks as personalised advice.
Past performance is not a reliable indicator of future performance.
 Please wait processing your request...