Kalkine has a fully transformed New Avatar.
Company Overview: Navigator Global Investments Limited, formerly HFA Holdings Limited, is a holding company. The Company is engaged in the provision of investment management products and services to investors globally via Lighthouse Investment Partners, LLC (Lighthouse). The Company has one segment, being the United States-based Lighthouse Group, which operates as a global absolute return funds manager for the United States and Cayman Island-based investment vehicles. Lighthouse is an investment manager dedicated to managing multi-manager hedge funds for diversification and absolute return. Lighthouse has offices in New York, Chicago, Palm Beach Gardens, London and Hong Kong. Lighthouse has an investor base that spans North America, Europe and Asia, and includes high net worth individuals, family offices, endowments, foundations, trusts, investment banks, benefit plans, pension funds, healthcare and insurance companies.
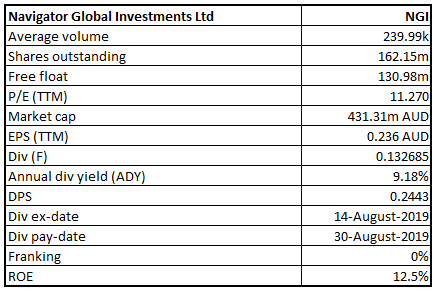
NGI Details
Decent Performance in FY19: Navigator Global Investments Limited (ASX: NGI) is primarily engaged in the provision of investment management products and services to the investors globally with the help of a wholly-owned subsidiary named Lighthouse Investment Partners, LLC. As on November 12, 2019, the market capitalisation of Navigator Global Investments Limited stood at ~A$431.31 million. Looking at the performance over the period covering FY17 to FY19, the company witnessed a CAGR growth of 22.5% in asset under management (AUM) with FY17 figure of US$9.5 billion and FY19 AUM of US$14.2 billion. Management fee revenue CAGR in terms of US dollars, for the period covering FY17 to FY19, stood at 21.7%. During the year ended 30 June 2019, the company generated total revenue amounting to US$114.867 million, up 28% on FY18 revenue of US$89.57 million. It was mainly supported by decent growth in management fee revenue, received revenue from reimbursement of fund operating expenses, and revenue from provision of office space and services. EBITDA stood at US$37.652 Mn in FY19, exhibiting a decent growth of 10% on Y-o-Y basis. It further added that management fee revenue growth was witnessed primarily from customised solutions business. The company added that significant volatility and market dislocation witnessed in the quarter ended December 2018 led to negative investment results throughout the portfolios, primarily in global long/short space, though not nearly as bad as was witnessed in the markets. There was an improvement in the investment performance in 2H FY19. The hedge fund strategies broadly performed well throughout the half, which led to a generation of positive returns in the upward trending markets, while at the same time, the capital was protected in periods of market stress like witnessed in the month of May 2019.
The Board of Directors declared an unfranked final dividend amounting to US 9 cents per share (with 100% conduit foreign income credits), which was payable on August 30, 2019. When it gets added to an interim dividend amounting to US 8.0 cents per share, the total for the year comes out to be 17.0 US cents per share, reflecting an increase of 6% on the YoY basis. The FY19 combined interim and final dividends reflect a payout ratio of 73% of EBITDA. The Directors of the company are satisfied that current capital management policy of shelling out dividends between 70-80% of EBITDA continues to strike the right balance between rewarding the shareholders and ensuring the company can retain enough resources in order to reap the benefits of growth opportunities which might arise going forward.
There are expectations that higher than industry RoE, decent capabilities to garner revenues, focus on delivering returns to the shareholders, and a robust balance sheet might attract the attention of market players moving forward.
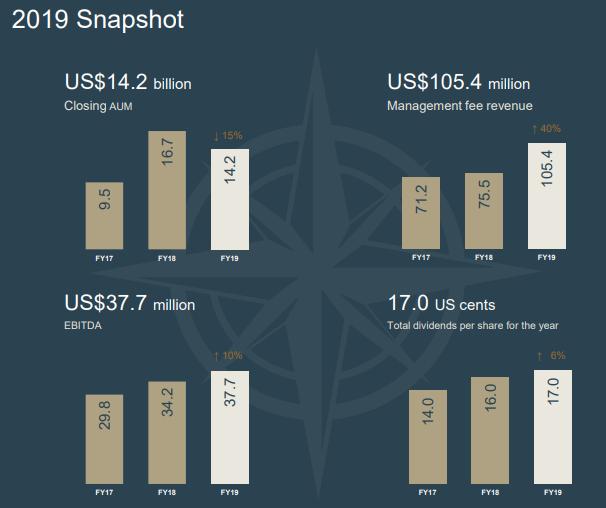
FY19 Snapshot (Source: Company Reports)
Top 10 Shareholders: The following table provides a broader overview of the top 10 shareholders in Navigator Global Investments Limited:
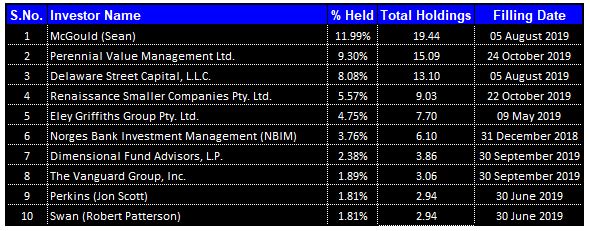
Top 10 Shareholders (Source: Thomson Reuters)
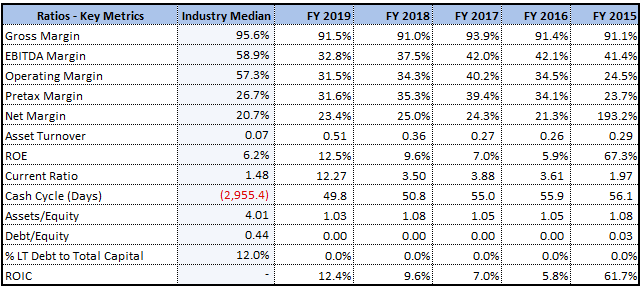
Net Margins Higher than Industry Median: The company has posted a net margin of 23.4% in FY19, which is higher than the industry median of 20.7% and, therefore, it can be said that NGI is possessing decent capabilities to convert its top-line into the bottom-line. Notably, the company’s gross margin in FY19 stood at 91.5%, which reflects a marginal rise from FY18 figure of 91%. The company’s RoE stood at 12.5% in FY19, which is higher than the industry median of 6.2% and, therefore, it can be said that NGI has delivered better returns to its shareholders. In FY19, the company’s current ratio stood at 12.27x in FY19, which is higher than the industry median of 1.48x, showing a decent liquidity position to meet its short-term obligations in a better way than the broader industry. Also, respectable levels of liquidity might support it in making deployments towards strategic business objectives, which can help it in achieving long-term growth.
Key Metrics (Source: Thomson Reuters)
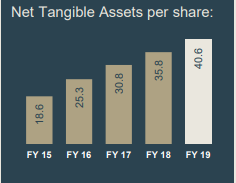
Robust Balance Sheet: At the end of June 2019, Navigator Global Investments Limited had cash of US$29.0 million, and the company has explained the sources and uses of cash in FY19. The cash generated from the operating activities stood at US$22.6 million in FY19 and, during the same period, $27.5 million was paid in the form of dividends to the shareholders. In FY19, $1.6 Mn was paid for the investments, while $1.5 Mn was paid for plant & equipment. Net tangible assets per share as on June 30, 2019 was reported at US 40.63 cents as compared to US 35.79 cents at the end of FY18. Net tangible assets per share grew at a CAGR of ~21.5% over the period of FY15-FY19.
Net Tangible Assets per share trend (Source: Company Reports)
Management Fee Revenue Rose 40%: The company posted management fee revenue amounting to US$105.4 million for FY19, which reflects an increase of 40% on a YoY basis. The primary driver of a rise in the management fees was an increase in average total AUM. This was because of the combination of $5.4 Bn of MAS assets that transitioned on July 1, 2018 ($3.1 Bn as at June 30, 2019), as well as the deferred effects of Lighthouse’s record 2018 financial year where $1.3 Bn of net inflows were achieved into Lighthouse products. Both of the factors jointly resulted in a 51% rise in the average AUM for FY19 as compared to the previous year.
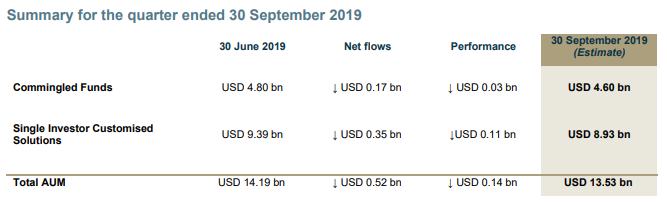
A Quick look at AUM update for September 2019: The company stated that, in early March 2018, the company entered into an agreement for the acquisition of substantially all of client assets of MAS, which is the multi-manager hedge fund division of Mesirow Financial. The transaction was closed on July 1, 2018, and there was a transition of $5.4 Bn of assets under management to Lighthouse. Recently, the company made an announcement that, at the end of September 2019, total AUM figure stood at USD 13.53 billion. The company stated that net outflows from Customised Solutions related entirely to MAS redemptions. However, despite the MAS redemptions, the acquisition remains accretive to NGI, and the company will continue to rationalise its cost structure based on assets that remain from MAS.
Summary for the quarter ended September 2019 (Source: Company Reports)
NGI Focuses on Global Distribution Opportunities: The company is expecting opportunities for new and increased mandates across the globe, and there was a large mandate win in the month of February 2019 from the Middle East. The company has been maintaining its focus on global distribution opportunities, and it continues to work on building new relationships, and at the same time, deepening the existing ones. In the shorter term, company is expecting good opportunities in Asia, primarily in Japan as well as the Middle East as the most promising markets.
What to Expect from NGI Moving Forward: The company will continue to promote its managed account platform, as it gives a better model for investing in hedge funds. Its approach, infrastructure, and risk management system provide a structural advantage, which is rare when it comes to the alternative asset management sector. The company believes that hedge funds, and especially portfolios, which are focused on alpha-oriented managers with a limited market and factor exposures, prove their worth across the range of potential market outcomes. The company’s focus is to improve efficiency by which the portfolios seek their objectives by finding the best mix of talent globally, improving access to research, data, and analysis, as well as reducing the overall costs.
The company’s total revenue has witnessed a CAGR growth of 13.27% in the time span of FY15- FY19 and, therefore, it can be said that NGI is possessing respectable capabilities to garner revenues. It can be said that respectable capabilities to generate revenues might help it in achieving decent growth moving forward.
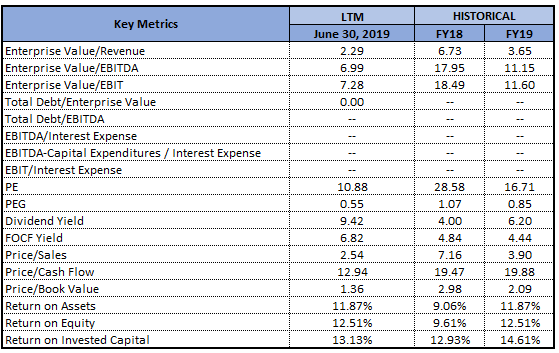
Key Valuation Metrics (Source: Thomson Reuters)
Valuation Methodology: Price to book value based valuation
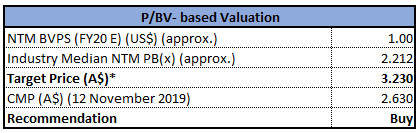
Price to book value based valuation (Source: Thomson Reuters), *1 United States Dollar equals 1.46 Australian Dollar as on November 12, 2019
Note: All forecasted figures and peers have been taken from Thomson Reuters, NTM: Next Twelve Months
Stock Recommendation: The Board considers EBITDA as the most relevant measure of the company’s overall financial performance. By looking at the nature of operations and taking into account of timing differences arising from trade receivables and payables, EBITDA was largely consistent with cash flows, which were generated by operating activities. In FY19, EBITDA rose 10% on a YoY basis, and the company’s Board has delivered a rise in dividend paid to the shareholders. The company’s dividend per share has witnessed a CAGR growth of 12.8% in the time span of FY15- FY19 and, therefore, it can be said that NGI has been focusing on delivering returns to the shareholders. Based on the foregoing, we have valued the stock using a relative valuation method, i.e., price to book value multiple, and arrived at a target price of lower double-digit growth (in % term). Hence, we give a “Buy” recommendation on the stock at the current market price of A$2.630 per share (down 1.128% on 12 November 2019).
.png)
NGI Daily Technical Chart (Source: Thomson Reuters)
Disclaimer
The advice given by Kalkine Pty Ltd and provided on this website is general information only and it does not take into account your investment objectives, financial situation or needs. You should therefore consider whether the advice is appropriate to your investment objectives, financial situation and needs before acting upon it. You should seek advice from a financial adviser, stockbroker or other professional (including taxation and legal advice) as necessary before acting on any advice. Not all investments are appropriate for all people. Kalkine.com.au and associated pages are published by Kalkine Pty Ltd ABN 34 154 808 312 (Australian Financial Services License Number 425376). The information on this website has been prepared from a wide variety of sources, which Kalkine Pty Ltd, to the best of its knowledge and belief, considers accurate. You should make your own enquiries about any investments and we strongly suggest you seek advice before acting upon any recommendation. Kalkine Pty Ltd has made every effort to ensure the reliability of information contained in its newsletters and websites. All information represents our views at the date of publication and may change without notice. To the extent permitted by law, Kalkine Pty Ltd excludes all liability for any loss or damage arising from the use of this website and any information published (including any indirect or consequential loss, any data loss or data corruption). If the law prohibits this exclusion, Kalkine Pty Ltd hereby limits its liability, to the extent permitted by law to the resupply of services. There may be a product disclosure statement or other offer document for the securities and financial products we write about in Kalkine Reports. You should obtain a copy of the product disclosure statement or offer document before making any decision about whether to acquire the security or product. The link to our Terms & Conditions has been provided please go through them and also have a read of the Financial Services Guide. On the date of publishing this report (mentioned on the website), employees and/or associates of Kalkine Pty Ltd do not hold positions in any of the stocks covered on the website. These stocks can change any time and readers of the reports should not consider these stocks as personalised advice.
Past performance is not a reliable indicator of future performance.
 Please wait processing your request...