Kalkine has a fully transformed New Avatar.
Company Overview: Navigator Global Investments Limited, formerly HFA Holdings Limited, is a holding company. The Company is engaged in the provision of investment management products and services to investors globally via Lighthouse Investment Partners, LLC (Lighthouse). The Company has one segment, being the United States-based Lighthouse Group, which operates as a global absolute return funds manager for the United States and Cayman Island-based investment vehicles. Lighthouse is an investment manager dedicated to managing multi-manager hedge funds for diversification and absolute return. Lighthouse has offices in New York, Chicago, Palm Beach Gardens, London and Hong Kong. Lighthouse has an investor base that spans North America, Europe and Asia, and includes high net worth individuals, family offices, endowments, foundations, trusts, investment banks, benefit plans, pension funds, healthcare and insurance companies.
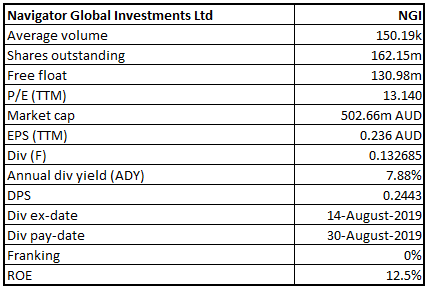
NGI Details
Record EBITDA for NGI: Navigator Global Investments Limited (ASX: NGI) is primarily engaged in the provision of investment management products and services to investors globally through wholly-owned subsidiary Lighthouse Investment Partners, LLC. The market capitalisation of the company stood at ~A$502.66 million as of 15 October 2019. The company declared its annual result for the year ended June 30, 2019, in which it earned a record EBITDA of US$37.7 million, up 10% on FY18. The company’s top management stated that there are continuous opportunities for new and increased mandates, and it is more focused on global distribution opportunities, and will continue to work on building new relationships, while deepening existing ones. During the year, the operating expenses were higher by $19.4 million as compared to 2018. This implies a significant increase in scale to the operations throughout all major expense areas from July 1 transition of MAS client relationships, as well as costs relating specifically to MAS transition activities. The company is focused towards delivering on the investment objectives for clients and to maintain a high quality of service. As at June 30, 2019, the company had an asset under management (AUM) of US$14.2 billion. During the year ended June 30, 2019, management fee revenue was $105.4 million for the year, reflecting a rise of 40% on a YoY basis. The key driver of the increase in management fees was the increase in average total AUM. This was due to a combination of $5.4 billion of MAS assets, which transitioned on 1 July 2018, and deferred effects of Lighthouse’s record 2018 financial year where the company achieved $1.3 billion of net inflows into Lighthouse products. As a result of these factors, there was an increase of 51% in average AUM for the 2019 financial year on a YoY basis. The company’s performance fee revenue for the year amounted to $1.1 million, reflecting a fall of $6.5 million as compared to the previous financial year. This reduction is consistent with the lower investment performance, which was achieved this year throughout the portfolios.
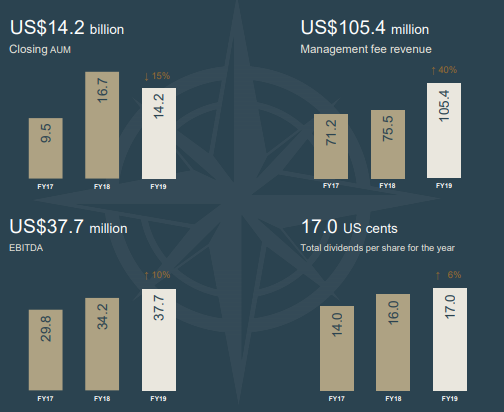
FY19 Financial Highlights (Source: Company Reports)
Top 10 Shareholders: The following table provides a broader overview of the top 10 shareholders in Navigator Global Investments Limited.
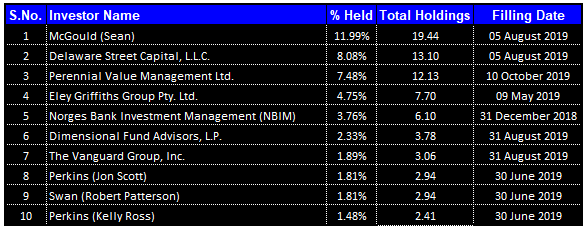
Top 10 Shareholders (Source: Thomson Reuters)
Better Position of Margins: The operating margin of the company showed an improvement and went up from 24.5% in FY15 to 31.5% in FY19, implicating that the company is making enough money from its ongoing business to pay for its variable costs. RoE stood at 12.5% in FY19 as compared to 6.2% of the industry median, which implies that the company is capable of generating returns for its shareholders. Net margin of the company stood at 23.4% in FY19, which is higher than the industry median of 20.2%, which shows that the company is more efficient in converting sales into a profit.
.png)
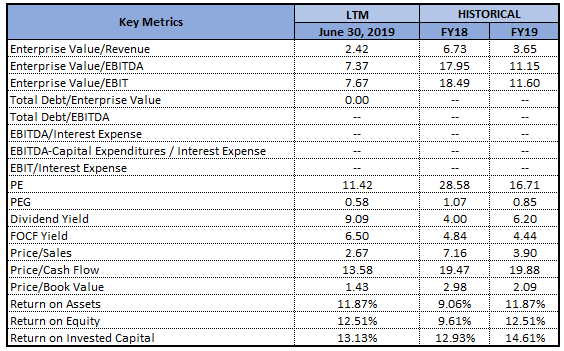
Key Metrics (Source: Thomson Reuters)
Quick Overview of Net Fund Flows: During the year, AUM was reduced due to the net outflows. A higher than normal level of outflows was experienced throughout Lighthouse and MAS (Mesirow Advanced Strategies), resulting in combined net outflows of $2.6 billion. The majority of the decrease in AUM was driven by anticipated redemptions from the transitioned MAS relationships, which totaled $2.3 billion across the year.
Analysis of 5-year Performance: The Board of the company considers EBITDA as the most relevant measure of the company’s overall financial performance. Considering the nature of the operations and taking into account the timing differences arising from the trade receivables and payables, EBTIDA was largely consistent with cash flows generated by the operating activities. The following image shows key numbers of NGI for the span of previous five years:
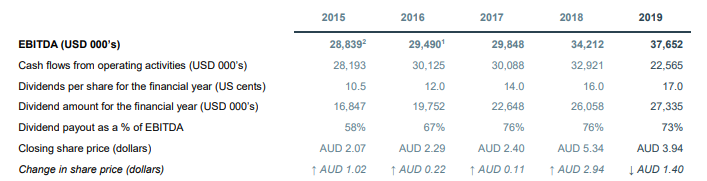
5-year historical performance (Source: Company Reports)
As shown, EBITDA for 2019 witnessed a rise of 10% on a YoY basis, and the Board has managed to deliver an increase in dividend paid to the shareholders, which could attract the attention of the market participants.
Update on AUM and Investment Performance: Navigator Global Investments Limited has recently provided an update on its assets under management (or AUM) for the quarter ended September 2019. As per the release, the company’s total AUM stood at USD13.53 billion, out of which USD4.60 billion relates to commingled funds and USD8.93 billion is related to Single Investor Customised Solutions.
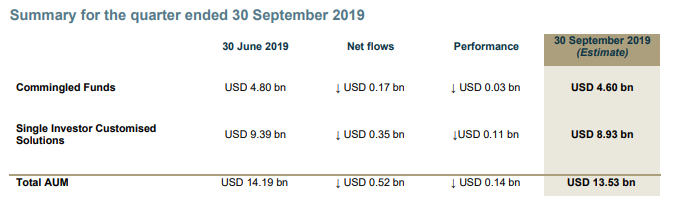
Total AUM (Source: Company Reports)
The company stated that net outflows from customised solutions was related entirely to the MAS redemptions, with net outflow amounting to USD350 million, implying an off-setting net inflow from Lighthouse Customised Solutions which amounted to USD80 million. It was mentioned that despite of the MAS redemptions, the acquisition remains accretive to Navigator Global Investments Limited and the company would continue to rationalise cost structure based on the assets which remain from MAS.
Growth Trajectory Continues in Dividends: The Board determined an unfranked final dividend of 9 cents per share (with 100% conduit foreign income credits), which was paid on 30 August 2019 with an interim dividend of 8 cents per share bringing the total dividend to 17 cents per share, increase of 6% from the prior year. FY19 combined interim and final dividends resulted in the pay-out ratio of 73% of EBITDA, which stands within the company’s current capital management policy.
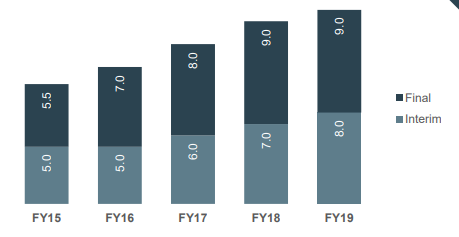
Dividends (Source: Company Reports)
The Directors of the company are satisfied that current capital management policy of shelling out a dividend in the range of 70-80% of EBITDA strikes right balance between rewarding shareholders and ensuring that the company can retain sufficient resources in order to take advantage of the growth opportunities that might arise.
Key Types of Investments: The company holds two key types of investments, i.e., investment in Lighthouse funds and investment in external entities. The company might hold investments in Lighthouse funds for numerous reasons like to meet regulatory commitments, contractual requirement of a customised client mandate, or to seed a new product which would be offered to the external investors in the future. During the period, holdings in Lighthouse funds rose by $1.8 million to $12.7 million. The company also invests in numerous external entities and, it was added that, the investments are each relatively small and strategic in nature and might result in interesting synergistic opportunities for Lighthouse.
What to Expect from NGI: The company would continue to promote its managed account platform, as it believes that it provides a better model for investing in the hedge funds. The company’s approach, i.e., infrastructure, and risk management system together give the structural advantage, which is rare when it comes to alternative asset management sector. The company is of the belief that hedge funds, and more specifically portfolios which are focused towards alpha-oriented managers with the limited market and factor exposures, prove their worth throughout the range of the potential market outcomes. The company focuses on improving efficiency by which the portfolios seek their objectives by finding the best mix of talent globally, improving access to research, data, and analysis as well as reducing the overall costs.
There are expectations that the company’s capabilities to garner revenues and build cash levels might support its growth over the long-term. Additionally, the decent position of dividend-related fundamentals and focus on delivering returns to its shareholders (as evident from its FY19’s RoE, which is higher than industry median) might help it in gaining traction among the market participants.
Key Valuation Metrics (Source: Thomson Reuters)
Valuation Methodologies:
Method 1: P/B- based Valuation
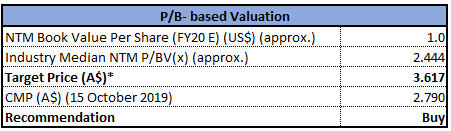
P/B- based Valuation (Source: Thomson Reuters), *1 US Dollar= ~1.48 Australian Dollars (as at 15 October 2019)
Method 2: P/E- based Valuation
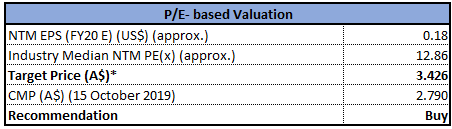
P/E- based Valuation (Source: Thomson Reuters), *1 US Dollar= ~1.48 Australian Dollars (as at 15 October 2019)
Note: All forecasted figures and peers have been taken from Thomson Reuters, NTM: Next Twelve Months
Stock Recommendation: The company's stock was down 10% on October 15, 2019 owing to the release of its September 2019 quarter AUM (estimated). Its total AUM at the end of September 2019 was US$13.53 billion, which implies a fall from June 2019 AUM figure of US$14.19 billion. This looks to be a short-term to medium-term impact while the strategic acquisition is expected to be accretive to the company as NGI continues to rationalise the overall cost structure. Over the span of previous three months, the stock of NGI has witnessed a fall of 19.48%, while in the time frame of past one month, the stock has fallen by 6.34%. As per ASX, the stock price of NGI is trading closer to its 52-week lower levels and, therefore, it can be said that NGI is offering a decent opportunity for accumulation. On the analysis front, the company’s top line has witnessed a CAGR growth of 13.27% in the time span of FY15- FY19 and, therefore, it can be said that the company has decent capabilities to generate revenues, which might help it in achieving growth in the long-term. Between the same time span, the company’s cash receipts have witnessed a CAGR growth of 9.62% and, therefore, it can be said that NGI has decent capabilities to build cash levels. Given the backdrop of aforesaid facts coupled with a decent outlook in the long run, we have valued the stock using two relative valuation methods, i.e., P/E and P/BV multiples, and arrived at a target price of lower double-digit growth (in % term)). Hence, we give a “Buy” recommendation on the stock at the current price of A$2.790 per share.
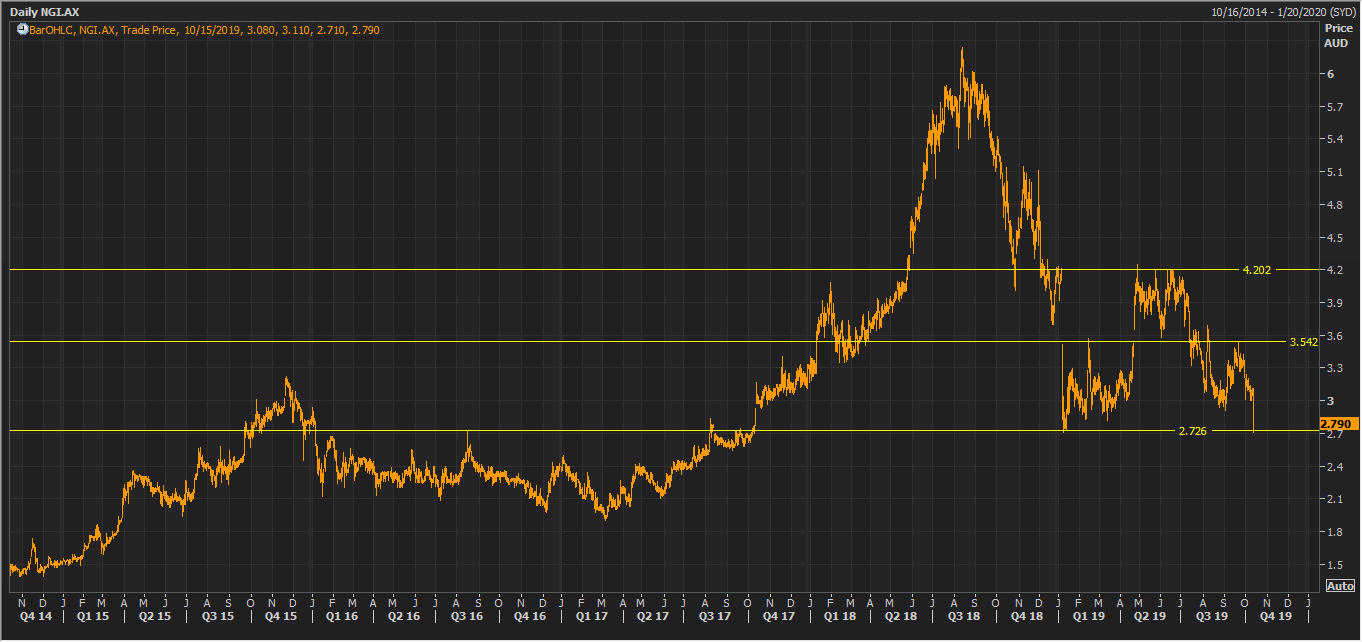
NGI Daily Technical Chart (Source: Thomson Reuters)
Disclaimer
The advice given by Kalkine Pty Ltd and provided on this website is general information only and it does not take into account your investment objectives, financial situation or needs. You should therefore consider whether the advice is appropriate to your investment objectives, financial situation and needs before acting upon it. You should seek advice from a financial adviser, stockbroker or other professional (including taxation and legal advice) as necessary before acting on any advice. Not all investments are appropriate for all people. Kalkine.com.au and associated pages are published by Kalkine Pty Ltd ABN 34 154 808 312 (Australian Financial Services License Number 425376). The information on this website has been prepared from a wide variety of sources, which Kalkine Pty Ltd, to the best of its knowledge and belief, considers accurate. You should make your own enquiries about any investments and we strongly suggest you seek advice before acting upon any recommendation. Kalkine Pty Ltd has made every effort to ensure the reliability of information contained in its newsletters and websites. All information represents our views at the date of publication and may change without notice. To the extent permitted by law, Kalkine Pty Ltd excludes all liability for any loss or damage arising from the use of this website and any information published (including any indirect or consequential loss, any data loss or data corruption). If the law prohibits this exclusion, Kalkine Pty Ltd hereby limits its liability, to the extent permitted by law to the resupply of services. There may be a product disclosure statement or other offer document for the securities and financial products we write about in Kalkine Reports. You should obtain a copy of the product disclosure statement or offer document before making any decision about whether to acquire the security or product. The link to our Terms & Conditions has been provided please go through them and also have a read of the Financial Services Guide. On the date of publishing this report (mentioned on the website), employees and/or associates of Kalkine Pty Ltd do not hold positions in any of the stocks covered on the website. These stocks can change any time and readers of the reports should not consider these stocks as personalised advice.
Past performance is not a reliable indicator of future performance.
 Please wait processing your request...