Kalkine has a fully transformed New Avatar.

Company Overview: Mosaic Brands Limited (ASX: MOZ) is engaged in retailing of women’s apparel and accessories in Australia and New Zealand. The company was founded in 1977 with two women’s fashion stores and is Australia’s largest specialty women’s fashion group with nine well-established brands and operates approximately 1,400 stores. Whilst the group sells across different brands it was determined, based on similarities, to aggregate into one segment. The similarities include marketing as well as the production and distribution processes..png)
MOZ Details
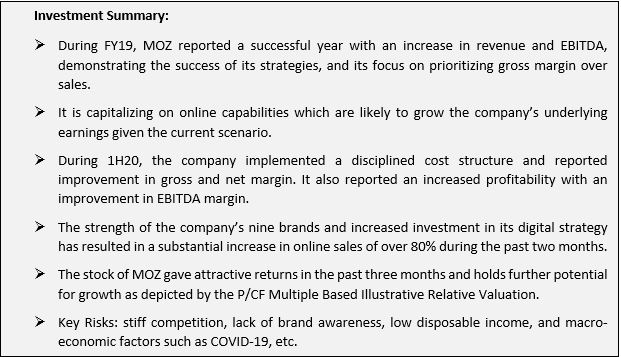
Success of Strategies and Strong Balance Sheet: Mosaic Brands Limited (ASX: MOZ) is engaged in retailing of women’s apparel and accessories in Australia and New Zealand. As on 23 June 2020, the market capitalization of the company stood at ~$81.81 million. During FY19, the company reported a successful year with an increase of 136.8% in revenue to $881.9 million, up from $372.4 million in FY18. Despite a difficult trading environment, the company reported an increase in underlying EBITDA by 22% to $45.5 million. The increase in EBITDA demonstrates the success of the company’s strategies, and particularly its focus on prioritizing gross margin over sales. The improvement in results with an uncertain global and domestic economic climate marked a significant achievement for the company. In the same time span, the company cemented annualized cost savings of $70 million and reported NPAT of $8.2 million. The group retains a high diversity with an expanded range of products. It is capitalizing on online capabilities which are likely to grow the company’s underlying earnings given the current scenario. The rapidly changing digital strategy of the group is a step forward in the area of growth. The company’s balance sheet is in decent shape, with a positive operating cash flow of $23.5 million for the year and net cash of $7.1 million at year-end. The strong financial position of the company and an increase in underlying profitability enabled the Board to declare a fully franked dividend of 14.5 cents per share, reflecting an increase of 11.5% over the previous year’s dividends of 13 cents.
During 1H20, the company continued to witness improvement in its performance with its investment in instore experience. Despite being affected by the external factors, the company managed to capture an increasing proportion of its customers’ share of wallet. MOZ well-managed its operational expenses and offered a wider range of product categories to its customers aligned with the brands’ quality and value proposition.
The multi brand group is focused on attracting skilled people to ensure the group has the breadth and depth of management to support sustainable growth. As a result of the acquisition of five women’s brands from Specialty Fashion Group, the company became a pre-eminent specialist fashion group and transformed into one of the dominant retail fashion groups in Australia and New Zealand. The company is focused on increasing the store network footprint across all the brands and driving digital expansion.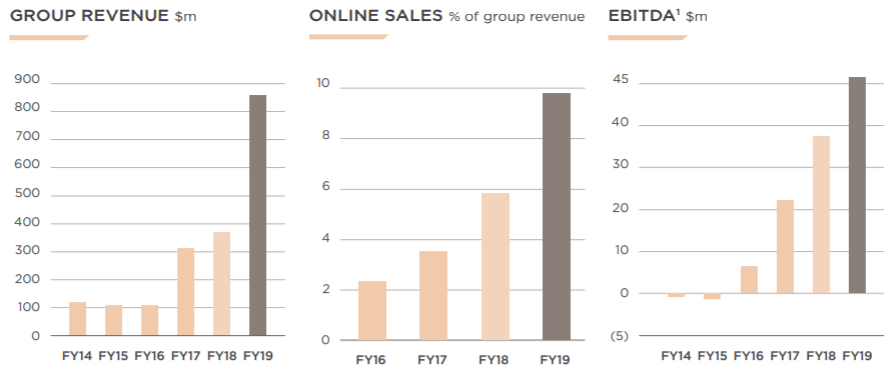
FY19 Financial Highlights (Source: Company Reports)
Details of Top 10 Shareholders: The following table provides an overview of the top 10 shareholders of Navigator Global Investments Limited. Alceon Group Pty. Ltd. is the largest shareholder in the company, with the percentage holding of 35.97%.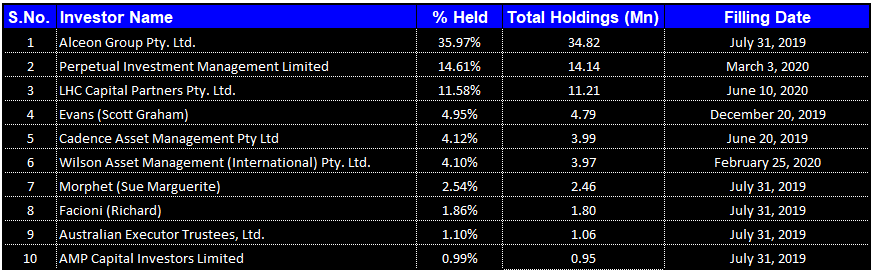
Top 10 Shareholders (Source: Refinitiv, Thomson Reuters)
Well Management of Costs and Increasing Returns to Shareholders: During 1H20, gross margin of the company stood at 59.2%, higher than the industry median of 17.5% and a net margin of the company witnessed an increase over the prior half and stood at 2.8%. Higher gross margin and improvement in net margin indicates that the company is well managing its costs and is capable of converting its revenue into profits. In the same time span, EBITDA margin of the company went up to 8.6% from 3.4% in 2H19, indicating increased profitability. During the half-year, Return on Equity of the company was 11.7%, higher than the industry median of 9.7%. This shows that the company is well managing the capital of its shareholders and is capable of generating profits internally. In the same time span, Assets/Equity Ratio of the company stood at 6.9x, and Debt/Equity Ratio was 1.89x. 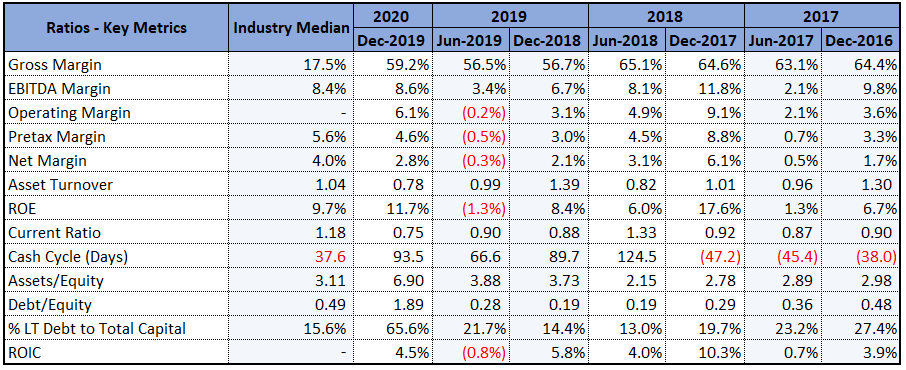
Key Margins (Source: Refinitiv, Thomson Reuters)
Decent Increase in NPAT and Expansion in Footprint: During 1H20, the company reported revenue of $413.8 million with an increase of 36% in EBITDA to $32 million. In the same time span, the company witnessed an increase of 47.5% in NPAT to $14.3 million, up from $9.5 million in 1H 2019. Notwithstanding the external impacts of bushfires in the later half, the company demonstrated resilience. MOZ has a decent balance sheet with an efficient multi-channel strategy, which will lead to further growth, capturing an increasing proportion of its customers’ share of wallet. During the half year, operating expenses remained well-managed, with savings of $24.4 million and online sales for the group continued to increase and contributed 10.1% of total sales. The nine brands of the company have highly engaged relationships with customers. The group’s database has over 4.4 million names, representing 75% of its target demographic. The balance sheet remains in decent shape, with the positive operating cash flow of $12.5 million and a return to positive net assets, and net cash of $4.5 million.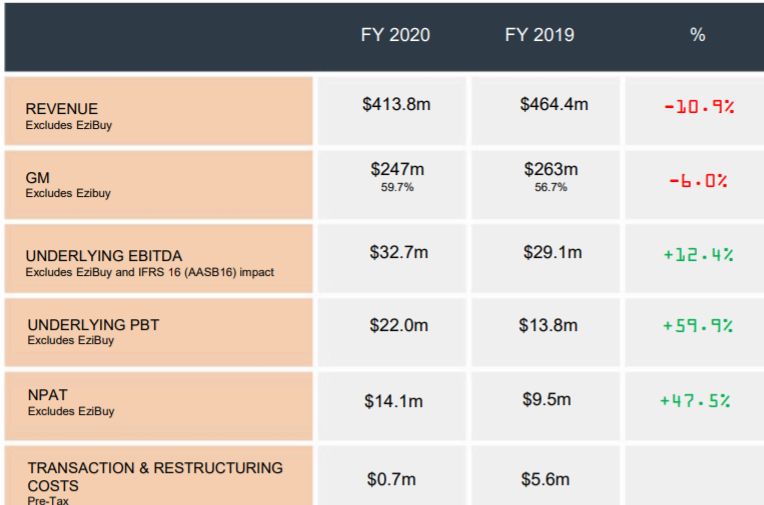
Half Yearly Financial Highlights (Source: Company Reports)
Key Risks: The group is exposed to several risks, including commodity price risk, counterparty credit risk, currency risk, liquidity risk, interest rate risk, stiff competition, lack of brand awareness, and low disposable income. The group’s main interest rate risk arises from loans and borrowings with variable rates. The group has seen a drop in store traffic and revenue, a direct result of the community’s response to the COVID-19 outbreak and the government’s social distancing recommendations. However, the company reported a progressive re-opening of its retail fashion stores. The trial openings have allowed the company to gain valuable insights for customer behavior. These insights can guide the company’s decisions to improve all aspects of customers’ journey from product collections to emotional engagement and experience.
Future Expectations and Growth Opportunities: The strength of the company’s nine brands and increased investment in its digital strategy have resulted in a substantial increase in online sales of over 80% during the past two months. This performance reflects substantial work during this challenging time to accelerate the strategy to expand the range of products offered and grow customer acquisition. The company expects short term disruptions because of the global pandemic but expects to return to profit in FY2021. The group will continue to benefit from its strategy of prioritizing gross margin, through cost price improvements and a disciplined approach to discounting. The Board believes that the strategic actions taken by management to weather the impact of the virus will continue to deliver sustainable earnings growth.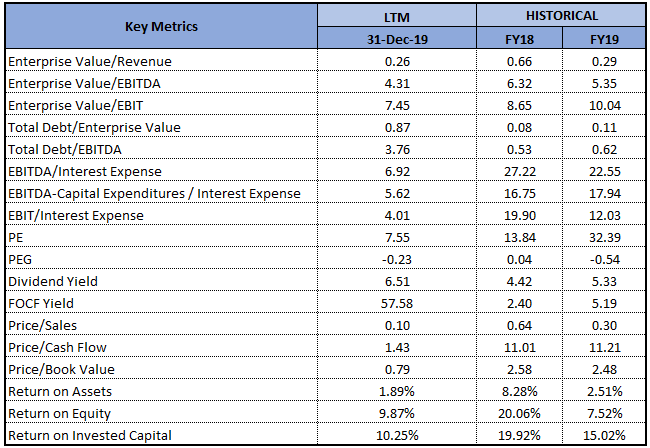
Key Valuation Metrics (Source: Refinitiv, Thomson Reuters)
Valuation Methodology: Price to Cash Flow Multiple Based Relative Valuation (Illustrative).png)
Price to Cash Flow Multiple Based Relative Valuation (Source: Refinitiv, Thomson Reuters)
Note: All the forecasted figures are taken from Thomson Reuters, NTM: Next Twelve Months
Stock Recommendation: Over the past five years, MOZ has grown to be one of the largest fashion retail groups in Australia. The company has a long track record of building and developing brands and has the opportunities to expand the business. The additional stores and multi-brand strategy of the company are expected to grow the underlying earnings of the group. MOZ retains a decent balance sheet and is financially stable, generating cash and providing a solid platform for future expansion. As per ASX, the stock of MOZ is trading at attractive levels, close to its 52-weeks’ low level of $0.195, proffering a decent opportunity for the investors to enter the market. The stock of MOZ gave a return of 181.67% in the past three months and a return of 3.68% in the past one month. We have valued the stock using the price to cash flow multiple based illustrative relative valuation method and have arrived at a target upside of lower double-digit (in percentage terms). For the said purposes, we have considered Accent Group Ltd (ASX: AX1), Myer Holdings Ltd (ASX: MYR), etc. as peers. Considering the current trading levels, attractive returns in the past three months, and decent long-term outlook, we recommend a ‘Speculative Buy’ rating on the stock at the current market price of $0.83, down by 1.775% on 23 June 2020.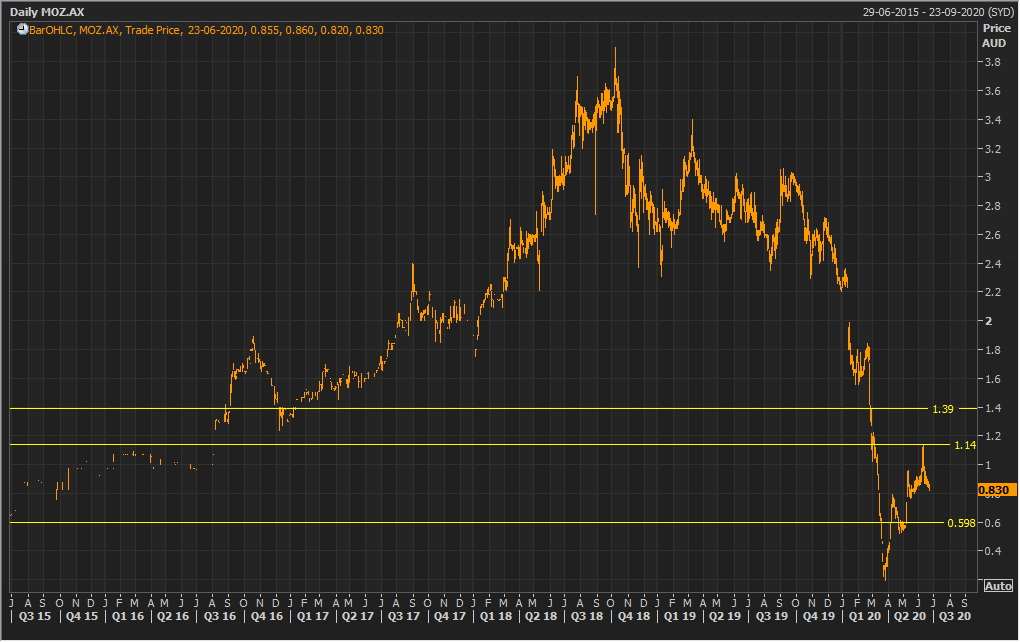
MOZ Daily Technical Chart (Source: Refinitiv, Thomson Reuters)
Disclaimer
The advice given by Kalkine Pty Ltd and provided on this website is general information only and it does not take into account your investment objectives, financial situation or needs. You should therefore consider whether the advice is appropriate to your investment objectives, financial situation and needs before acting upon it. You should seek advice from a financial adviser, stockbroker or other professional (including taxation and legal advice) as necessary before acting on any advice. Not all investments are appropriate for all people. Kalkine.com.au and associated pages are published by Kalkine Pty Ltd ABN 34 154 808 312 (Australian Financial Services License Number 425376). The information on this website has been prepared from a wide variety of sources, which Kalkine Pty Ltd, to the best of its knowledge and belief, considers accurate. You should make your own enquiries about any investments and we strongly suggest you seek advice before acting upon any recommendation. Kalkine Pty Ltd has made every effort to ensure the reliability of information contained in its newsletters and websites. All information represents our views at the date of publication and may change without notice. To the extent permitted by law, Kalkine Pty Ltd excludes all liability for any loss or damage arising from the use of this website and any information published (including any indirect or consequential loss, any data loss or data corruption). If the law prohibits this exclusion, Kalkine Pty Ltd hereby limits its liability, to the extent permitted by law to the resupply of services. There may be a product disclosure statement or other offer document for the securities and financial products we write about in Kalkine Reports. You should obtain a copy of the product disclosure statement or offer document before making any decision about whether to acquire the security or product. The link to our Terms & Conditions has been provided please go through them and also have a read of the Financial Services Guide. On the date of publishing this report (mentioned on the website), employees and/or associates of Kalkine Pty Ltd do not hold positions in any of the stocks covered on the website. These stocks can change any time and readers of the reports should not consider these stocks as personalised advice.
 Please wait processing your request...