Global Commodity Market Wrap-Up
Last week, the metals market showed mixed results as investors remained cautious amid fading momentum and easing geopolitical tensions. Precious metals saw limited safe-haven demand, with gold slipping 0.68% and silver falling 0.26%. On the industrial metals front, copper declined 0.20%, lead rose 0.07%, and zinc gained 0.01%, reflecting selective buying in some areas. This varied performance reflects the ongoing uncertainty in the global economic outlook. With key central bank decisions on the horizon and geopolitical risks still present, the metals market is likely to remain volatile as traders watch for further developments.
Natural gas prices dropped 12.25% last week amid supply pressures and weaker seasonal demand. Crude oil fell 1.06%, driven by concerns over trade tensions and OPEC’s production strategy. U.S. sugar declined 3.15%, reflecting broader softness in agricultural commodities. These movements highlight ongoing supply-demand imbalances and the market’s sensitivity to economic and geopolitical factors. Market participants are closely monitoring global developments and policy changes that may influence prices in the coming days.
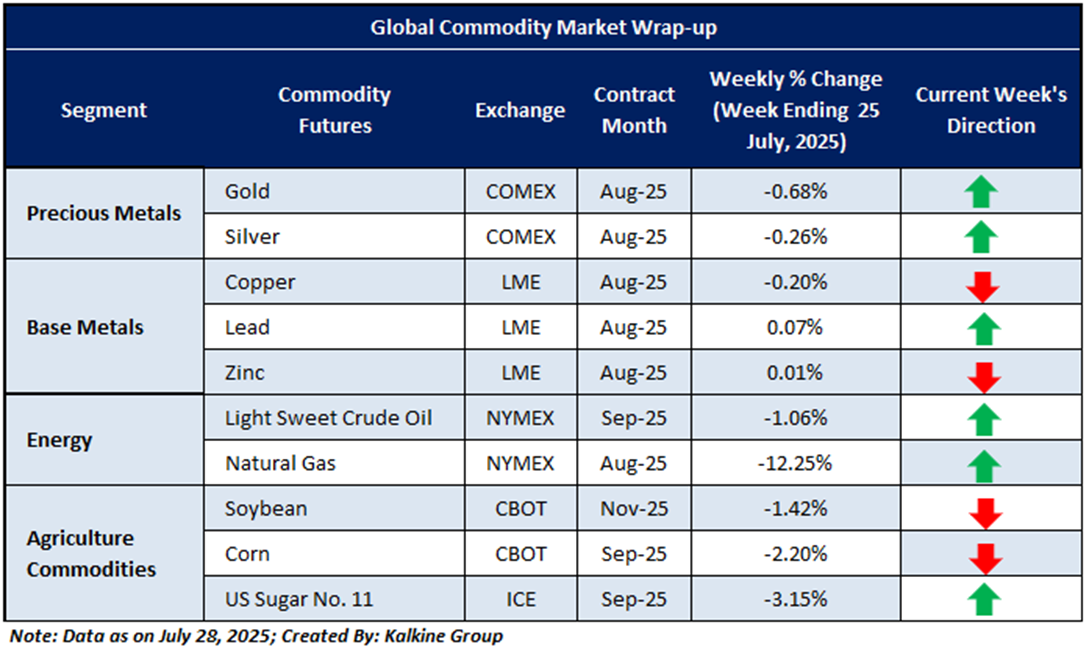
Global commodity prices showed mixed performance last week as markets balanced macroeconomic uncertainty with evolving supply dynamics. Precious metals saw limited movement, with gold and silver consolidating near recent highs amid cautious sentiment and shifting rate expectations. Crude oil declined due to concerns over global demand and trade tensions, while natural gas prices dropped sharply amid oversupply worries. Copper also faced a decline, reflecting economic growth concerns. Agricultural commodities traded sideways, supported by stable demand and favorable weather conditions in key producing regions. Market sentiment remained cautious, with attention on upcoming economic data and geopolitical developments.
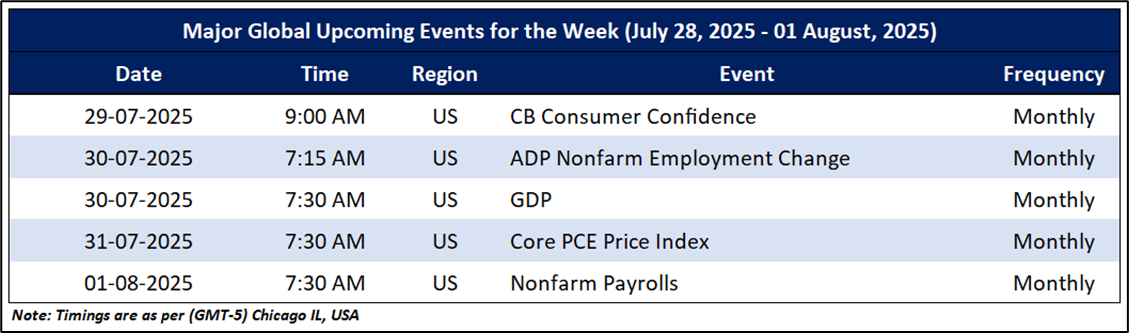
The upcoming Micro and Macroeconomic events that may impact on market sentiments include an update CB Consumer Confidence, ADP Nonfarm Employment Change, GDP, Core PCE Price Index and Nonfarm Payrolls.
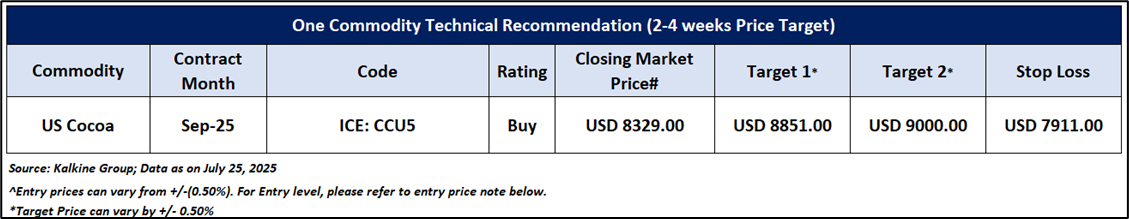
Having understood the global commodities’ performance over the past week, taking cues from major global economic events, and based on technical analysis, noted below is the recommendation with generic insights, entry price, target prices, and stop-loss US Cocoa September Future (ICE: CCU5) for the next 2-4-week duration:
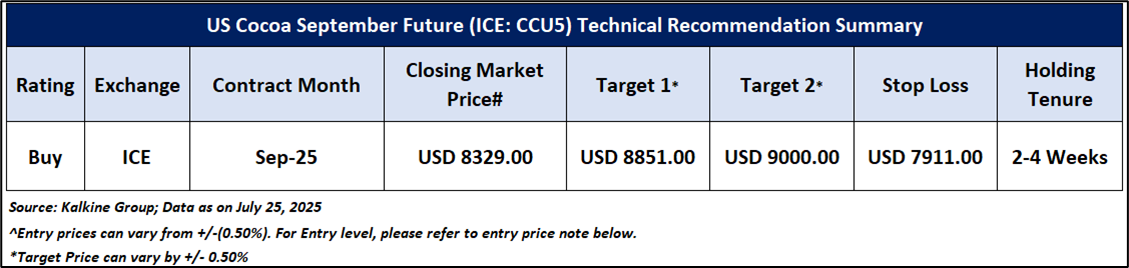
US Cocoa September Future (ICE: CCU5)
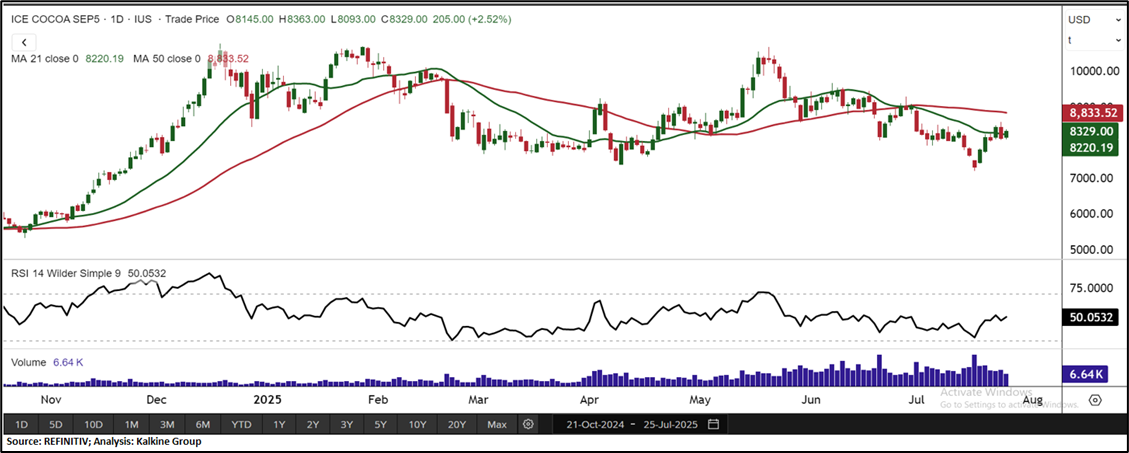
Price Action and Technical Indicator Analysis: September Cocoa futures are showing early signs of a potential reversal, trading above a key horizontal trendline with a bullish candlestick pattern. The 21-period Simple Moving Average, rising beneath current prices, provides near-term support and suggests the possibility of continued bullish momentum. The RSI at 50.05 reflects neutral sentiment, with a hint of bullish divergence. Holding above the support zone could maintain the current price level, while a breakout above immediate resistance might confirm a reversal, potentially leading to further price movement in upcoming sessions. Market participants will likely monitor these levels closely for direction.
Now the next crucial resistance levels appear to be at USD 8851.00 and USD 9000.00, and prices may test these levels in the coming periods (2-4 weeks).
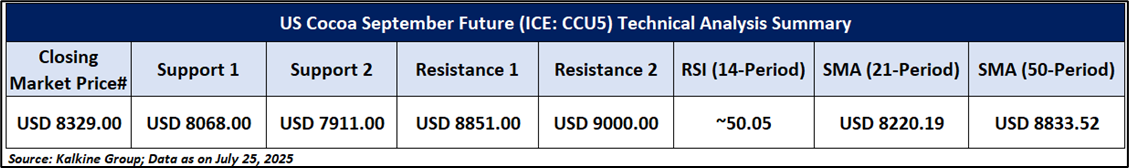
As per the above-mentioned price action and technical indicators analysis, US Cocoa September Future (ICE: CCU5) is looking technically well-placed for a ‘Buy’ rating. Investment decisions should be made depending on an individual’s appetite for downside potential, risks, and any previous holdings. This recommendation is purely based on technical analysis, and fundamental analysis has not been considered in this report. Technical summary of the ‘Buy’ recommendation is as follows:
Upcoming Major Global Economic Events
Market events occur on a day-to-day basis depending on the frequency of the data and generally include an update on employment, inflation, GDP, WASDE report, consumer sentiments, etc. Noted below are the upcoming week's major global economic events that could impact commodities’ prices:
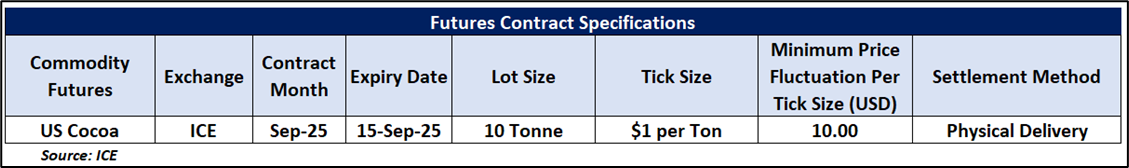
Futures Contract Specifications
Disclaimers
Related Risks: Based on the technical analysis, the risks are defined as per risk-reward ratio (~0.80:1.00), however, returns are generated within a 2-4 weeks’ time frame. This may be looked at by Individuals with sufficient risk appetite looking for returns within short investment duration. The investment recommendations provided in this report are solely based on technical parameters, and the fundamental performance of the commodities has not been considered in the decision-making process. Other factors which could impact commodity prices include market risks, regulatory risks, interest rates risk, currency risks, and social and political instability risks etc.
Note 1: Past performance is not a reliable indicator of future performance.
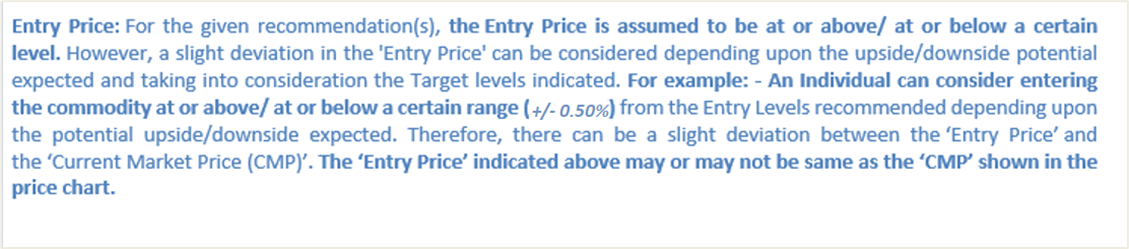
Note 2: Individuals can consider exiting from the commodity if the Target Price mentioned as per the Technical Analysis has been achieved and subject to the factors discussed above.
Note 3: How to Read the Charts?
The Green colour line reflects the 21-period moving average while the red line indicates the 50- period moving average. SMA helps to identify existing price trend. If the prices are trading above the 21-period and 50-period moving average, then it shows prices are currently trading in a bullish trend.
The Black colour line in the chart’s lower segment reflects the Relative Strength Index (14-Period) which indicates price momentum and signals momentum in trend. A reading of 70 or above suggests overbought status while a reading of 30 or below suggests an oversold status.
The Blue colour bars in the chart’s lower segment show the volume of the commodity. Commodity with high volumes is more liquid compared to the lesser ones. Liquidity in commodity helps in easier and faster execution of the order.
The Orange colour lines are the trend lines drawn by connecting two or more price points and used for trend identification purposes. The trend line also acts as a line of support and resistance.
Technical Indicators Defined: -
Support: A level at which the stock prices tend to find support if they are falling, and a downtrend may take a pause backed by demand or Selling interest. Support 1 refers to the nearby support level for the stock and if the price breaches the level, then Support 2 may act as the crucial support level for the stock.
Resistance: A level at which the stock prices tend to find resistance when they are rising, and an uptrend may take a pause due to profit booking or Selling interest. Resistance 1 refers to the nearby resistance level for the stock and if the price surpasses the level, then Resistance 2 may act as the crucial resistance level for the stock.
Stop-loss: It is a level to protect further losses in case of unfavourable movement in the stock prices.
Risk Reward Ratio: The risk reward ratio is the difference between an entry point to a stop loss and profit level. This report is based on ~80% Stop Loss of the Target 1 from the entry point.
The reference date for all price data, volumes, technical indicators, support, and resistance levels is 25th July 2025. The reference data in this report has been partly sourced from REFINITIV.
Note: Trading decisions require a thorough analysis by individuals. Technical reports, in general, chart out metrics that may be assessed by individuals before any commodity evaluation. The above are illustrative analytical factors used for evaluating the commodity; other parameters can be looked at along with additional risks per side.
This report (“Report”) has been issued by Kalkine Pty Limited (ABN 34 154 808 312) (Australian financial services licence number 425376) (“Kalkine”) and prepared by Kalkine and its related bodies corporate who are authorised to provide general financial product advice. Kalkine.com.au and its associated pages are published by Kalkine.
Any advice provided in this Report is general advice only and does not take into account your objectives, financial situation or needs. You should therefore consider whether the advice is appropriate for your objectives, financial situation and needs before acting upon it.
There may be a Product Disclosure Statement, Information Memorandum or other offer document (“Offer Document”) for the securities or other financial products referred in this Report. You should obtain a copy of the relevant Offer Document and consider it before making any decision about whether to acquire the security or financial product.
Kalkine strongly recommends that you seek advice from a financial adviser, stockbroker or other professional (including taxation and legal advice) before acting on any of the general advice in this Report or on the Kalkine website. Not all investments are appropriate for all people.
The information in this Report and on the Kalkine website has been prepared from a wide variety of sources, which Kalkine, to the best of its knowledge and belief, considers accurate. Kalkine has made every effort to ensure the reliability of the information contained in its reports (including this Report), newsletters and websites. All information represents our views at the date of publication and may change without notice.
The information in this Report does not constitute an offer to sell securities or other financial products or a solicitation of an offer to buy securities or other financial products. Our reports contain general recommendations to invest in securities and other financial products. Kalkine is not responsible for, and does not guarantee, the performance of, or returns on, any investments mentioned in this Report.
Kalkine does not issue, sell or deal in any financial products.
This Report may contain information on past performance of particular investments. Past performance is not a reliable indicator of future performance. Returns stated do not take into account transaction costs and taxes. To the extent permitted by law, and excluding any dishonesty or gross negligence by Kalkine, Kalkine disclaims and excludes all liability for any direct, indirect, implied, punitive, special, incidental or other consequential loss or damage arising from the use of or reliance on this Report, the Kalkine website and any information published on the Kalkine website without any warranties or representations by Kalkine to you. To the extent the law prohibits or limits this exclusion, Kalkine limits its liability to the resupply of services.
Please also read our Terms & Conditions and Financial Services Guide for further information. Employees and/or associates of Kalkine and its related entities may hold interests in the securities or other financial products covered in this Report or on the Kalkine website. Any such employees and associates are required to comply with certain, procedures and disclosures as required by law.
Kalkine Media Pty Ltd, an affiliate of Kalkine Pty Ltd, may have received, or be entitled to receive, financial consideration in connection with providing information about certain entity(s) covered on its website including entities covered in this Report.
Copyright 2025 Krish Capital Pty. Ltd. (ABN 61629651510). All Rights Reserved. No part of this report, or its content, may be reproduced in any form without our prior consent.
Past performance is not a reliable indicator of future performance.
 Please wait processing your request...