Kalkine has a fully transformed New Avatar.

Company Overview: Australia based mining service company, Mineral Resources Limited (ASX: MIN) comprises world-class portfolio of mining operations across multiple commodities, including lithium and iron ore. Services include crushing, supply chain services, site services, marketing and shipping, pit mining, processing and port operations. Mine sites of the company include Goldfields and Pilbara region of Western Australia, specifically Iron Valley, Koolyanobbing, Wodgina and Mt Marion. Koolyanobbing and Iron Valley focus on iron ore production, whereas Wodgina and Mt Marion focus on lithium.
.png)
MIN Details
Top-line Grew at a CAGR of 5.49% over FY13-19:: Perth-based leading mining services provider, Mineral Resources Limited (ASX: MIN) operates in the iron ore and hard-rock lithium sectors in Western Australia. It is the world’s largest crushing contractor and a leading pit-to-port mining services provider. It is counted among the top five lithium miners with joint ownership of the largest hard rock lithium deposit. It is also Australia’s fifth largest iron ore producer.
Looking at the past performance over FY13 to FY19, total revenue of the company has grown with a CAGR (compounded annual growth rate) of 5.49%. Group’s total revenue improved from $1,097.0 Mn in FY13 to $1,512.0 Mn in FY19.
The first half FY20 performance has placed the company into a strong position to deliver value to its shareholders while delivering outcomes in-line with its long-term goals. Particularly, the Wodgina transaction with Albemarle, helping MIN to return a net cash positive position. Moreover, its iron ore division driven by the Koolyanobbing business continued to perform well, underpinned by retaining existing contracts and winning new contracts, cementing the company’s position as an important service provider of choice to Tier 1 mining companies.
Under its guidance for FY20, the company has maintained a neutral stance over the impact of coronavirus on its operation and has avoided any change in its future estimates..png)
Historical Financial Performance of MIN (Source: Company Reports)
H1FY20 Key Highlights for the period ended December 31, 2019: Statutory earnings before interest, tax, depreciation and amortisation (EBITDA) for the period was reported at $1,575 million, which included a $1,290 million gain on the disposal of a 60% interest in the Wodgina Lithium Project. Revenue for the period was reported at $987 million, an increase of 78% on the previous corresponding period. Underlying EBITDA for the period was reported at $330 million, an increase of 224% on the prior corresponding period (pcp), reflecting strong growth in the Mining Services segment and record iron ore sales. The improvement in revenue and EBITDA for the period was driven by achievement of 95% growth in underlying EBITDA in mining services, driven by the ramp-up of Koolyanobbing as well as growth in external contracts; and strong iron ore prices along with record iron ore exports of 6.7 million wet tonnes, an increase of 70% on pcp, due to the Koolyanobbing ramp up.
Statutory net profit after tax (NPAT) (inclusive of $114 million of post-tax impairment charges ($164 million pre-tax) in relation to capitalised exploration and mine development expenditure, plant and equipment and stockpiles) for the period was reported at $884 million and underlying NPAT for the period was reported at $129 million, an increase of 279% on the previous corresponding period. Depreciation and amortisation for the period were reported at $92 million, an increase of 102% on pcp, driven by an expanded fleet for increased production along with increased amortisation of capitalised strip activity at Koolyanobbing as a result of a revised mine plan.
The Board of Directors declared a fully franked interim dividend of 23.0 cents per share, which is a rise of 77% on pcp..png)
H1FY20 Key Metrics (Source: Company Reports)
Reduction in Inventories by $20 Mn: Under balance sheet, inventories decreased by $20 million, mainly due to reallocation of Wodgina stockpiles to non-current assets after the decision to put the project into care and maintenance, sale of remaining Wodgina DSO stock and sale of Iron Valley fines stock. This reduction was partially offset by increased Koolyanobbing inventories from the ramp-up activity. Trade and other receivables decreased by $11 million, due to the timing of iron ore shipment invoicing, partially offset by the recognition of the Wodgina disposal completion adjustment.
MIN reported an increase of $643 million in its non-current receivables and inventory, reflecting accounting for the company’s interest in the Kemerton hydroxide facility and reallocation of Wodgina stockpiles..png)
H1FY20 Balance Sheet (Source: Company Reports)
Cash Position of $1,307 Mn on December 31, 2019: The group held cash and cash equivalents of $1,307 million as on December 31, 2019 as compared to $265 million on June 30, 2019. Net cash from operating activities before interest and tax for the period was reported at $317 million, up $295 million on pcp, reflecting a stronger underlying EBITDA and in-line with underlying EBITDA of $330 million. Net cash from investing activities for the period was reported at $974 million, an increase of $1,462 million on pcp, relating to cash proceeds from completion of the sale of a 60% interest in Wodgina to Albemarle in the period. The company reported capital outlays of amount $192 million on key investment projects including the acquisition of Parker Range tenements from Cazaly Resources Limited; completion of Wodgina spodumene concentrate plant and related infrastructure; and mining assets and stripping activity to support the group’s commodity projects as well as accommodate expansions at Koolyanobbing and Iron Valley..png)
H1FY20 Cash Flow Statement (Source: Company Reports)
Top 10 Shareholders: The top 10 shareholders have been highlighted in the table, which together form around 49.37% of the total shareholding. Ellison (Christopher James) and Airlie Funds Management Pty Ltd hold maximum interest in the company at 11.60% and 7.09%, respectively. On February 17, 2020, Greencape Capital Pty Ltd and Challenger Limited became substantial holders to the company with an interest of 5.12% each..png)
Top 10 Shareholders (Source: Thomson Reuters)
A Quick Look at Key Metrics: Its gross margin and net margin for H1FY20 stood at 98.6% and 89.6%, better than the industry median of 45.6% and 14.3%, respectively, implying decent fundamentals for the company. ROE for H1FY20 stood at 49.8%, better than the industry median of 4.7%, implying that the company generated a better return for its shareholders. Its current ratio for H1FY20 stood at 2.23x, better than the industry median of 1.70x, which implies that the company is in a better position to address its short-term obligations..png)
Key Metrics (Source: Thomson Reuters)
What to expect: As per the release, the company has highlighted that coronavirus impact on MIN’s business is difficult to gauge currently, therefore it has stayed with its previously stated guidance. Mining services’ EBITDA for FY20 has been estimated to be in the range of $280 - $300 million.
The exports of iron ore from Koolyanobbing (100% ownership) has been estimated to be in the range of 8.5 – 9.0Mt (40% Lump product), and operating costs to be in-line with the second half of FY19 at $75/wmt. Exports of iron ore from Iron Valley (100% ownership) has been estimated to be in the range of 6.0 – 6.5Mt (40% Lump product), and operating costs to be more than FY19 by 15% at $75/wmt. Exports of spodumene concentrate from Mt Marion (50% ownership) has been estimated to be in the range of 360 – 380Kt (70% SC6 product), and operating costs to be in-line with the second half of FY19 at $594/wmt.
H2FY20 Mining Services Outlook: Similar growth pace for crushing is expected as in first half, where Koolyanobbing ramp up is expected at 11Mtpa run rate, and replacement NextGen plant (15 Mtpa capacity) is expected to net an additional 5 Mtpa. Steady growth is expected in the processing segment. Contract mining is expected to grow at the same rate as in the first half of around 30%.
H2FY20 Commodities Outlook: Export from Iron Valley is expected to be in the range of 2.5 - 3.0Mt (50% Lump product), and the year end run rate is expected to be 8Mtpa. Export from Koolyanobbing is expected to be in the range of 5.4 – 5.9Mt (50% Lump product), and the year end run rate is expected to be 11Mtpa. MIN is expected to maintain steady state run at Mt Marion with export in the range of 170-190Kt (70% of 6% product). Wodgina has been placed into care and maintenance until market demand improves..png)
Key Valuation Metrics (Source: Thomson Reuters)
Valuation Methodology: Price to Earnings Multiple Based Relative Valuation
.png)
Price to Earnings Multiple Approach (Source: Thomson Reuters), NTM-Next Twelve Months
Note: All forecasted figures and peers have been taken from Thomson Reuters
Technical Analysis:
Monthly Chart: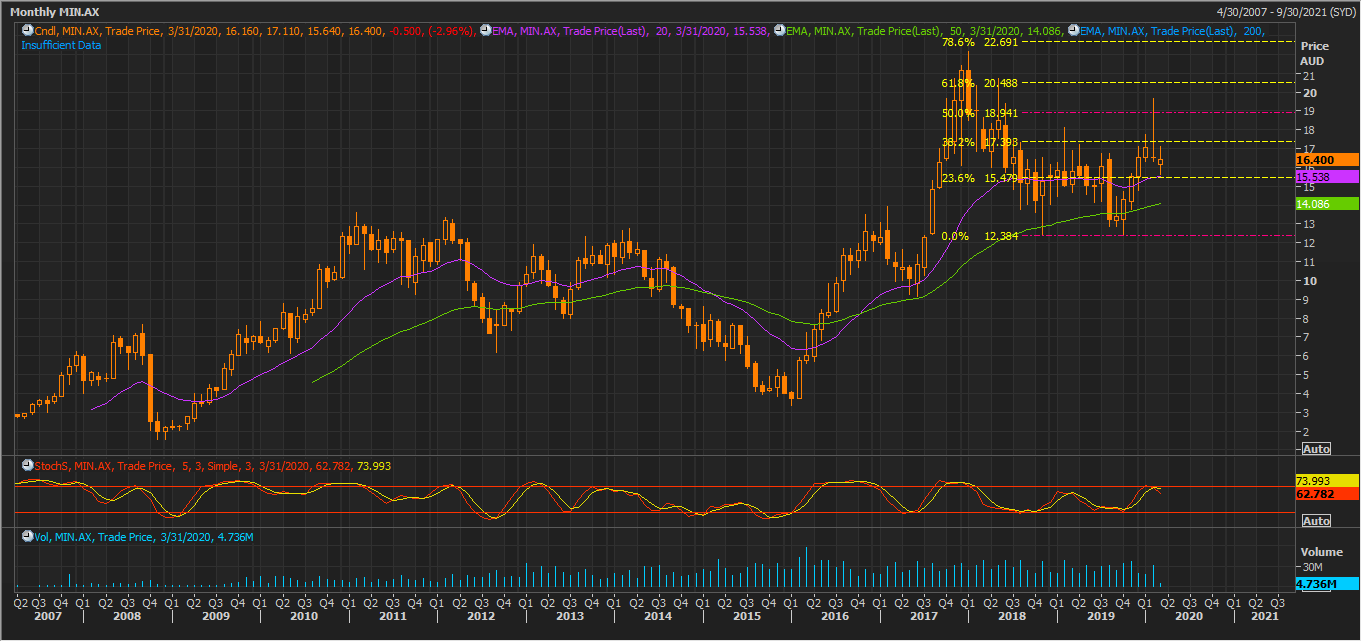
(Source: Thomson Reuters)
Weekly Chart: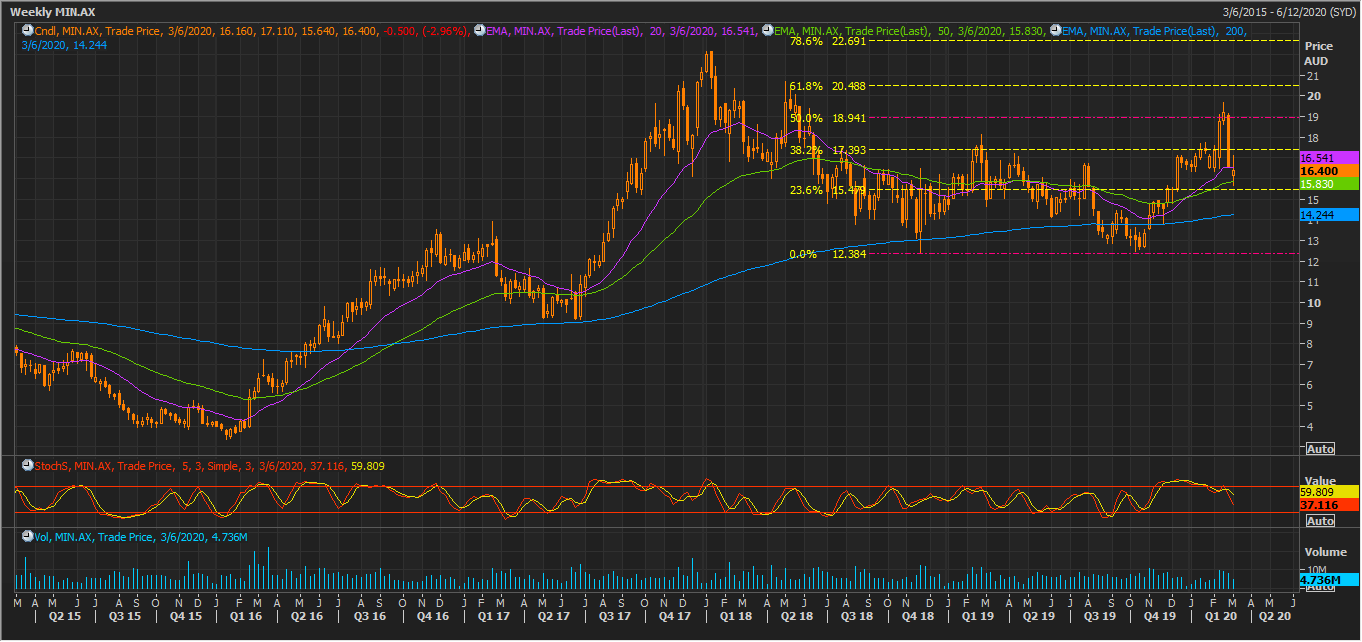
(Source: Thomson Reuters)
On monthly chart, the stock is trading above 20 EMA and 50 EMA, indicating bull trend. On weekly chart, the stock is above 200 EMA, which again points towards bullish trend. Moreover, a ‘spinning top’ candlestick pattern can be observed above the 50 EMA, which suggests end of momentum for the bears and probability for a bounce back. The stock is expected to test the level of ~$18.941 in the coming times.
Note: EMA – Exponential Moving Average
Stock Recommendation: MIN’s stock posted a positive one-year return of 10.10%, and in the span of six months, it posted a return of 26.78%. It is currently trading above the average of its 52-week high and low price of $19.680 and $12.440, respectively. The company’s record capital investment of almost $900 million in FY19 has laid the foundation for a sustainable business for the next 30 to 50 years with world-class lithium assets and a regenerated iron ore business. Considering the company’s business operation, first-half FY20 performance, profitability margins, outlook provided and current trading levels, we have valued the stock using a price to earnings based relative valuation method and arrived at a target price of lower double-digit growth (in % terms). Hence, we give a “Buy” recommendation on the stock at the current market price of $16.40, down 2.959% on March 04, 2020.
.jpg)
MIN Daily Technical Chart (Source: Thomson Reuters)
Disclaimer
The advice given by Kalkine Pty Ltd and provided on this website is general information only and it does not take into account your investment objectives, financial situation or needs. You should therefore consider whether the advice is appropriate to your investment objectives, financial situation and needs before acting upon it. You should seek advice from a financial adviser, stockbroker or other professional (including taxation and legal advice) as necessary before acting on any advice. Not all investments are appropriate for all people. Kalkine.com.au and associated pages are published by Kalkine Pty Ltd ABN 34 154 808 312 (Australian Financial Services License Number 425376). The information on this website has been prepared from a wide variety of sources, which Kalkine Pty Ltd, to the best of its knowledge and belief, considers accurate. You should make your own enquiries about any investments and we strongly suggest you seek advice before acting upon any recommendation. Kalkine Pty Ltd has made every effort to ensure the reliability of information contained in its newsletters and websites. All information represents our views at the date of publication and may change without notice. To the extent permitted by law, Kalkine Pty Ltd excludes all liability for any loss or damage arising from the use of this website and any information published (including any indirect or consequential loss, any data loss or data corruption). If the law prohibits this exclusion, Kalkine Pty Ltd hereby limits its liability, to the extent permitted by law to the resupply of services. There may be a product disclosure statement or other offer document for the securities and financial products we write about in Kalkine Reports. You should obtain a copy of the product disclosure statement or offer document before making any decision about whether to acquire the security or product. The link to our Terms & Conditions has been provided please go through them and also have a read of the Financial Services Guide. On the date of publishing this report (mentioned on the website), employees and/or associates of Kalkine Pty Ltd do not hold positions in any of the stocks covered on the website. These stocks can change any time and readers of the reports should not consider these stocks as personalised advice.
 Please wait processing your request...