Kalkine has a fully transformed New Avatar.

Company Overview: Microsoft Corporation is a technology company. The Company develops, licenses, and supports a range of software products, services and devices. The Company's segments include Productivity and Business Processes, Intelligent Cloud and More Personal Computing. The Company's products include operating systems; cross-device productivity applications; server applications; business solution applications; desktop and server management tools; software development tools; video games, and training and certification of computer system integrators and developers. It also designs, manufactures, and sells devices, including personal computers (PCs), tablets, gaming and entertainment consoles, phones, other intelligent devices, and related accessories, that integrate with its cloud-based offerings. It offers an array of services, including cloud-based solutions that provide customers with software, services, platforms, and content, and it provides solution support and consulting services.
.png)
MSFT Details
Microsoft Corporation (NASDAQ: MSFT) has a portfolio of products that encompasses wide horizon of offerings and has expanded from artificial intelligence to IoT. The company represents to be one of the largest cloud computing companies in the world; and now holds approximately 15% of the cloud market share as per last quarter update, and is second behind Amazon and currently above the giant companies like IBM, Google, and Alibaba. The company also has big players like Coca-Cola, FedEx, Ford, Walmart, as its cloud or AI customers. MSFT had introduced Microsoft 365 about a couple of years ago and this is a multi-billion dollar business now with Eli Lilly and Rio Tinto as some of the customers. Microsoft has sewed together a network with messaging, meetings, video conferencing, and web-based collaboration capabilities into a single integrated user platform. Its Productivity and Business Processes, Intelligent Cloud and More Personal Computing support the entire operation. Overall, expansion across cloud computing, gaming and IoT has given an edge to Microsoft Corporation. The double digit EV/EBITDA figure for MSFT is above that of many peers such as Apple and Facebook; and EBITDA and operating margins are also at higher levels when compared to other tech giants and industry medians. Looking at the forward 24 months EPS of about $5.5, a double digit growth is expected in stock price in next 12 - 24 months.
.png)
Financial Ratios (Source: Company Reports and Thomson Reuters)
Robust Performance in the First Quarter 2019: MSFT had a strong start to the FY 19 as the company delivered record revenue and profit. The revenue grew 19% over corresponding period of last fiscal year, and 18% in constant currency to $29.1 billion. Gross margin dollars expanded by 18% during the first quarter of 2019. The operating income was up by 29% (28% in constant currency). Further, the earnings per share rose 36% (33% in constant currency) to $1.14. The net income grew 34% to $8.8 billion during the first quarter 2019. Moreover, during the first quarter of FY19, the capex including financed leases increased to $4.3 billion sequentially, on the back of ongoing investment to meet demand for the cloud services. Cash paid for property, plant and equipment amounted to $3.6 billion while free cash flow was $10.1 billion. The free cash flow was down about 2% (year on year basis) at the back of higher capex indicated for cloud business. There was a 10% rise in cash flow from operations on a year-on-year basis driven by billings and collections, while first annual TCJA payment impacted the scenario a bit. Realized gains for mark-to-market scenario as per the new accounting rules helped other income to be at $266 million (above expectations).
.png)
First Quarter 2019 Financial Performance (Source: Company Reports)
Strong Segment performance in First Quarter of FY 19: During the first quarter of FY 19, the revenue from Productivity and Business Processes grew 19% and 18% in constant currency to $9.8 billion, which was above the company’s expectation on the back of both the on-premises and cloud businesses. Office commercial products and cloud services revenue grew 17% and 16% in constant currency on the back of 36% and 35% in constant currency rise in Office 365 commercial revenue due to continued Office 365 commercial growth and about 3 points of growth from increase in demand, ahead of an increase in price with the launch of Office 2019. Office consumer products and cloud services revenue grew 16% and 17% in constant currency due to continuous rise in Office 365 consumer subscribers to 32.5 million. LinkedIn revenue was up significantly by 33% owing to improved engagements as highlighted by LinkedIn sessions’ growth (34%); and Dynamics products and cloud services witnessed a 20% revenue growth due to 51% and 49% in constant currency growth in Dynamics 365 revenue.
.png)
Performance for Productivity and Business Processes (Source: Company Reports)
Moreover, during the first quarter of FY 19, the revenue in Intelligent Cloud rose 24% to $8.6 billion, again better than expected, on the back of demand for the hybrid offerings. Server products and cloud services revenue grew 28% and 28% in constant currency due to 76% growth in the Azure revenue, which is in line with the company’s expectations due to robust growth across both consumption and per-user base businesses. Enterprise Services revenue was up 6% and revenue in More Personal Computing grew 15% to $10.7 billion. This benefitted from the gaming scenario. Windows OEM revenue rose 3% due to 8% rise in OEM Pro revenue; while Windows commercial products and cloud services saw a 12% rise in revenue due to an increased volume of multi-year agreements. There was a 44% rise in Gaming revenue backed by software and services and hardware related performances. Xbox software and services revenue grew 36% and also 36% in constant currency driven mainly from third-party title strength. Search advertising revenue (without traffic acquisition costs) witnessed a 17% rise with support from Bing rate growth and higher volume across the U.S. as well as international markets. Further, a 14% rise was noted in surface revenue as Surface Book 2 as well as Surface Go performed well. There was a 10% expansion of segment gross margin while gross margin percentage was lower owing to sales mix.
Capital Management and Acquisition of GitHub: MSFT has returned over $6 billion to its stockholders in the form of dividends and share repurchases in the first quarter of FY19. This has reflected a rise of 27% compared to the first quarter of FY18. On acquisition and strategic moves’ front, MSFT expects to complete the acquisition of GitHub shortly, and the transaction is to be minimally dilutive to FY19 and FY20 EPS on a non-GAAP basis. It is expected to be accretive to operating income in FY20, on a non-GAAP basis.
Second Quarter 2019 Outlook: For the second quarter of 2019, FX is expected to decrease COGS and operating expense growth by about 1 point. For the commercial business, MSFT is expecting decent performance in the second quarter due to strong growth in the bookings. A 19% growth is anticipated for Commercial unearned revenue on a y-o-y basis while Commercial cloud gross margin percentage is expected to expand (though some drop compared to previous years may be noted with revenue mix towards Azure services). Margin improvement is driven by revenue mix, the timing of infrastructure spend and seasonality. CapEx is anticipated to be in line with the first quarter while Productivity and Business Processes might witness revenue of $9.95 billion - $10.15 billion. Office commercial and Dynamics is expected to post double-digit growth (backed by cloud performance) and Office consumer is anticipated to continue its momentum while channel inventories may slightly impact revenues. LinkedIn revenue is expected to continue to grow strongly. For More Personal Computing, the company expects revenue in the range of $12.8 billion-$13.2 billion. OEM Pro revenue growth is expected to be in line with the commercial PC market; and Windows commercial products and cloud services will experience strong performance. Revenue for Surface will accelerate with recent launches of Surface Pro 6 and Surface Laptop 2. Gaming might see some moderation in revenue growth compared to prior year comparable that witnessed the launch of Xbox One X. Third-party title and overall platform strength will maintain revenue growth for Software and services segment. Additionally, MSFT during the second quarter 2019, expects COGS to be in the range of $12.2 billion to $12.4 billion and operating expenses to be in the range of $9.8 billion to $9.9 billion. Other income and expense are expected to be approximately $50 million; and in the second quarter 2019, the effective tax rate is projected to be slightly above the full year estimate of 17%.
Outlook for FY 19: MSFT expects a 1 point fluctuation for revenue growth with stable forex rates; and COGS and operating expenses are expected to be relatively low given the FX scenario. The operating expenses for FY 19 with the addition of GitHub may witness a high single digit rise. Growth excluding GitHub is expected to be in line with the company’s prior guidance (~7%) while operating margin is expected to be up on year on year basis. For FY 19, the capex’s growth rate is anticipated to moderate.
Stock Recommendation: MSFT stock is trading at a price of $104.27, and has support at $94.13 level and resistance at $114. The company has delivered strong performance for the first quarter of 2019 and will continue to grow strongly henceforth. Given that the group can witness a high single digit to low double digit topline growth and consistent bottom-line growth, and move towards evolved digitization and cloud computing space, we have a “Buy” on the stock at the current price of $104.27.
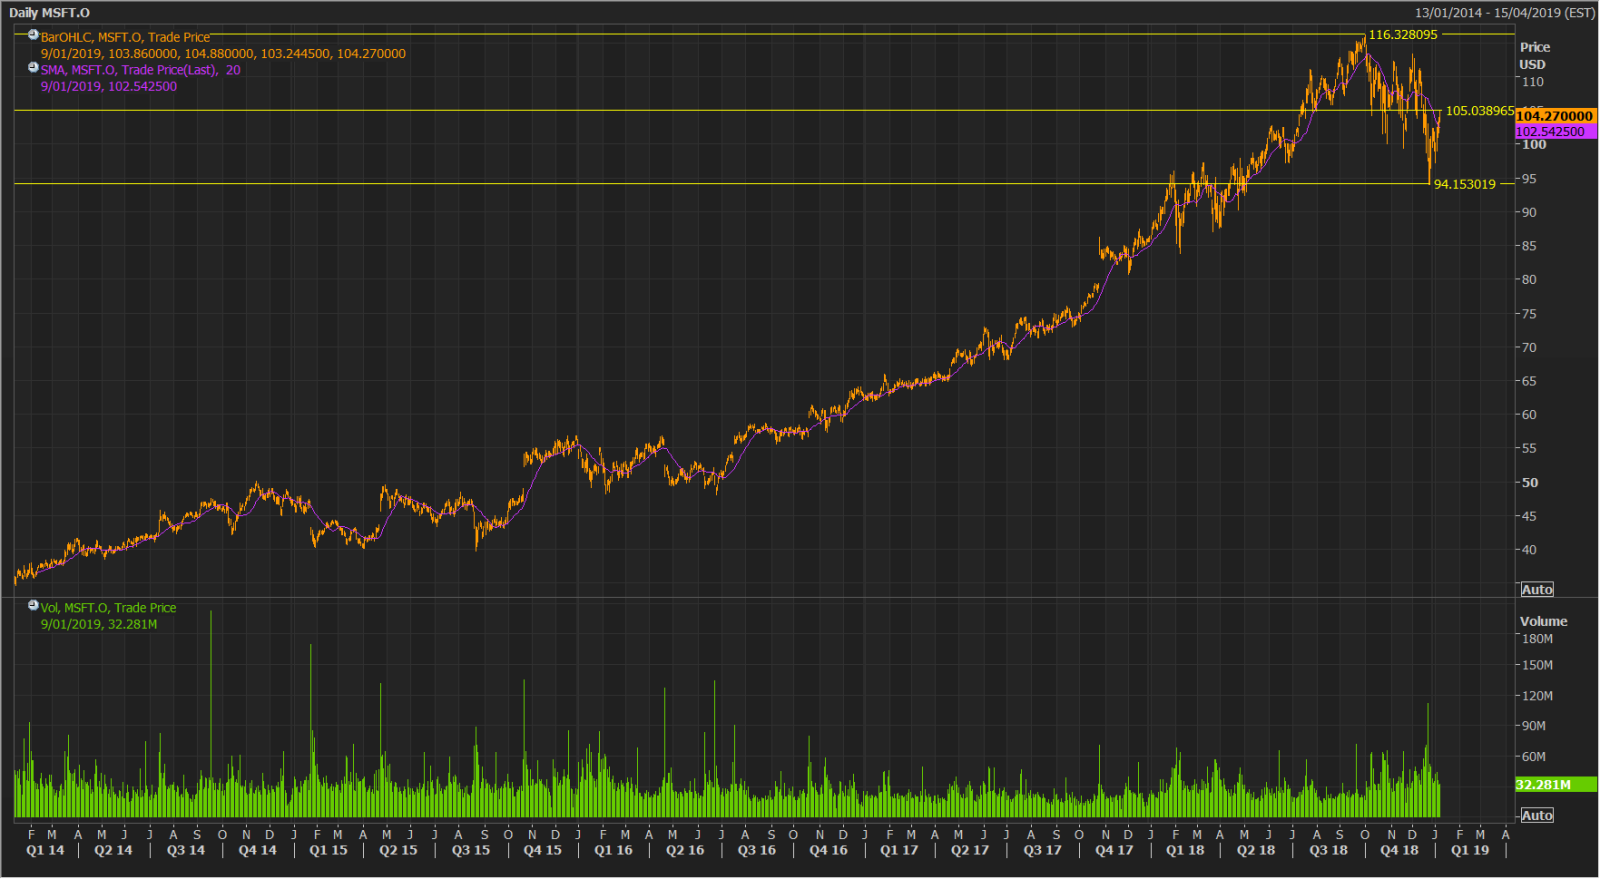
MSFT Daily Chart (Source: Thomson Reuters)
Disclaimer
The advice given by Kalkine Pty Ltd and provided on this website is general information only and it does not take into account your investment objectives, financial situation or needs. You should therefore consider whether the advice is appropriate to your investment objectives, financial situation and needs before acting upon it. You should seek advice from a financial adviser, stockbroker or other professional (including taxation and legal advice) as necessary before acting on any advice. Not all investments are appropriate for all people. Kalkine.com.au and associated pages are published by Kalkine Pty Ltd ABN 34 154 808 312 (Australian Financial Services License Number 425376). The information on this website has been prepared from a wide variety of sources, which Kalkine Pty Ltd, to the best of its knowledge and belief, considers accurate. You should make your own enquiries about any investments and we strongly suggest you seek advice before acting upon any recommendation. Kalkine Pty Ltd has made every effort to ensure the reliability of information contained in its newsletters and websites. All information represents our views at the date of publication and may change without notice. To the extent permitted by law, Kalkine Pty Ltd excludes all liability for any loss or damage arising from the use of this website and any information published (including any indirect or consequential loss, any data loss or data corruption). If the law prohibits this exclusion, Kalkine Pty Ltd hereby limits its liability, to the extent permitted by law to the resupply of services. There may be a product disclosure statement or other offer document for the securities and financial products we write about in Kalkine Reports. You should obtain a copy of the product disclosure statement or offer document before making any decision about whether to acquire the security or product. The link to our Terms & Conditions has been provided please go through them and also have a read of the Financial Services Guide. On the date of publishing this report (mentioned on the website), employees and/or associates of Kalkine Pty Ltd do not hold positions in any of the stocks covered on the website. These stocks can change any time and readers of the reports should not consider these stocks as advice or recommendations.
 Please wait processing your request...