Section 1: Company Overview, Shariah Compliance Standards and Fundamentals
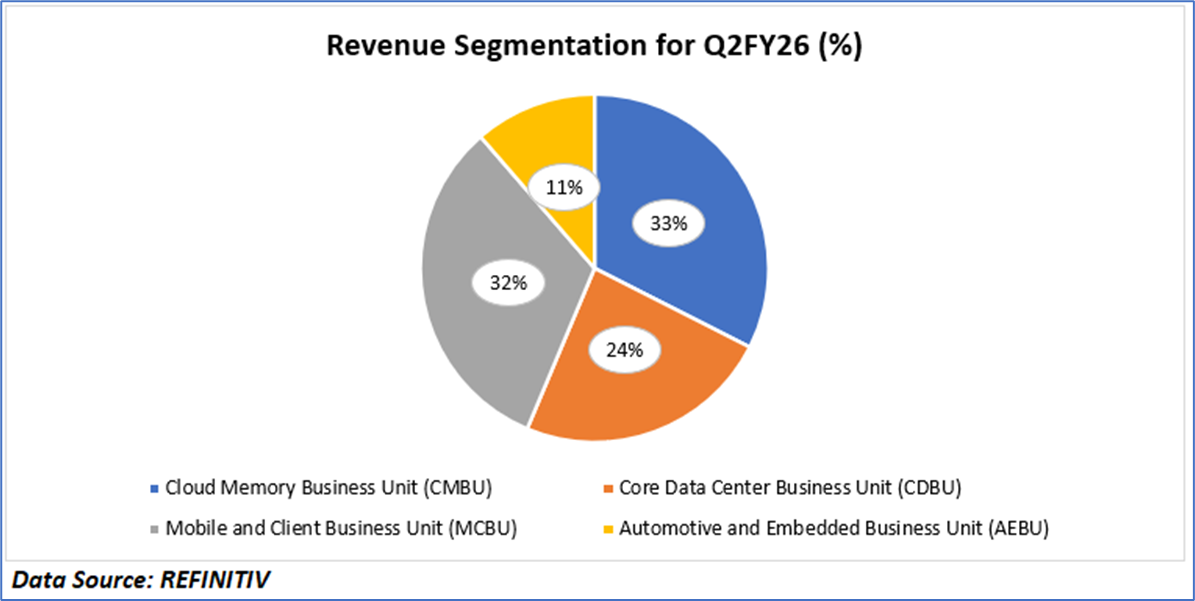
Section 1.1: Micron Technology, Inc. (NASDAQ: MU) provides memory and storage solutions. The Company delivers a portfolio of high-performance dynamic random-access memory (DRAM), NAND, and NOR memory and storage products through its Micron and Crucial brands. The Company's products enable advancing in artificial intelligence (AI) and compute-intensive applications. Its segments include Cloud Memory Business Unit (CMBU), Core Data Center Business Unit (CDBU), Mobile and Client Business Unit (MCBU) and Automotive and Embedded Business Unit (AEBU).
Kalkine’s ‘The Shariah Compliance Report’ covers the Investment Highlights, Shariah-compliance standards, Key Financial Metrics, Risks, and Technical Analysis along with the Valuation, Target Price, and Recommendation on the stock.

Section 1.2: What are the Key Metrics for Shariah Compliance to be Considered?
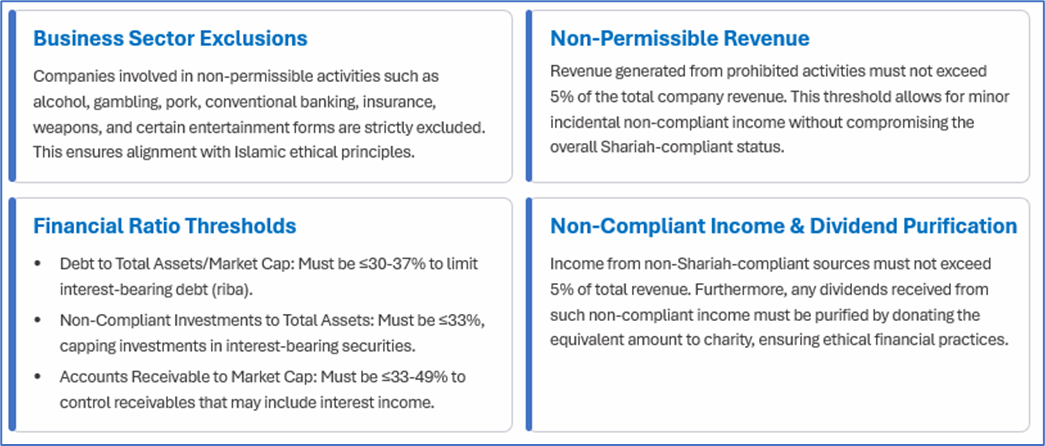
The Shariah Compliance Report aims to identify equities that align with Shariah and ethical principles, providing valuable insights on financial metrics, business activities and compliance with Islamic finance norms.
Key Shariah Screening Criteria and Thresholds
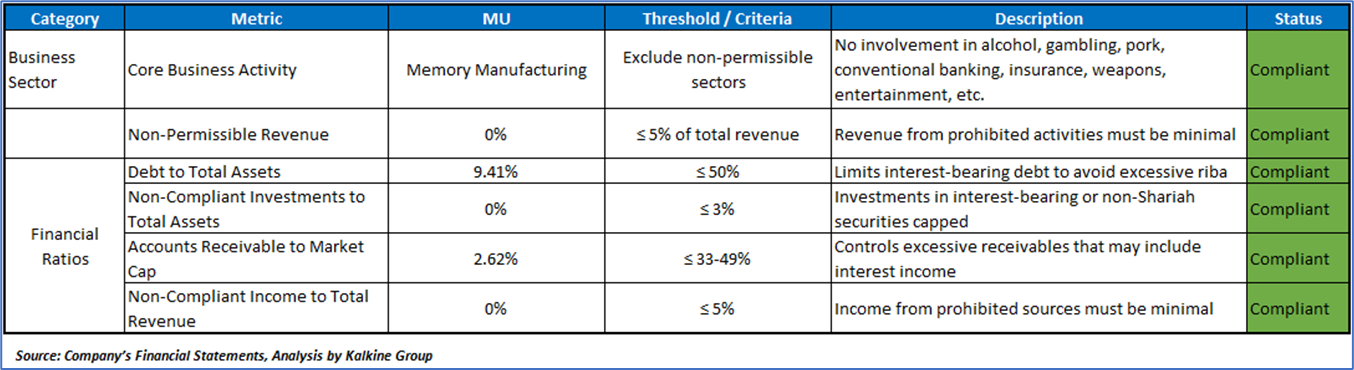
Shariah Metrics for Micron Technology, Inc. (NASDAQ: MU):
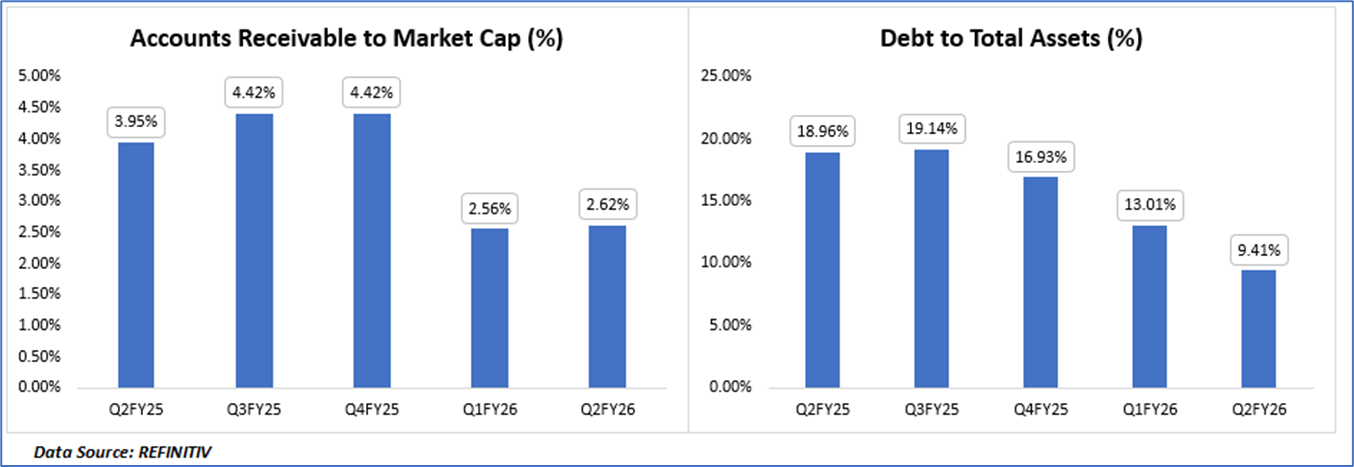
Revenue Segmentation of MU in Q2FY26 & Historical Compliance of Financial Ratios:
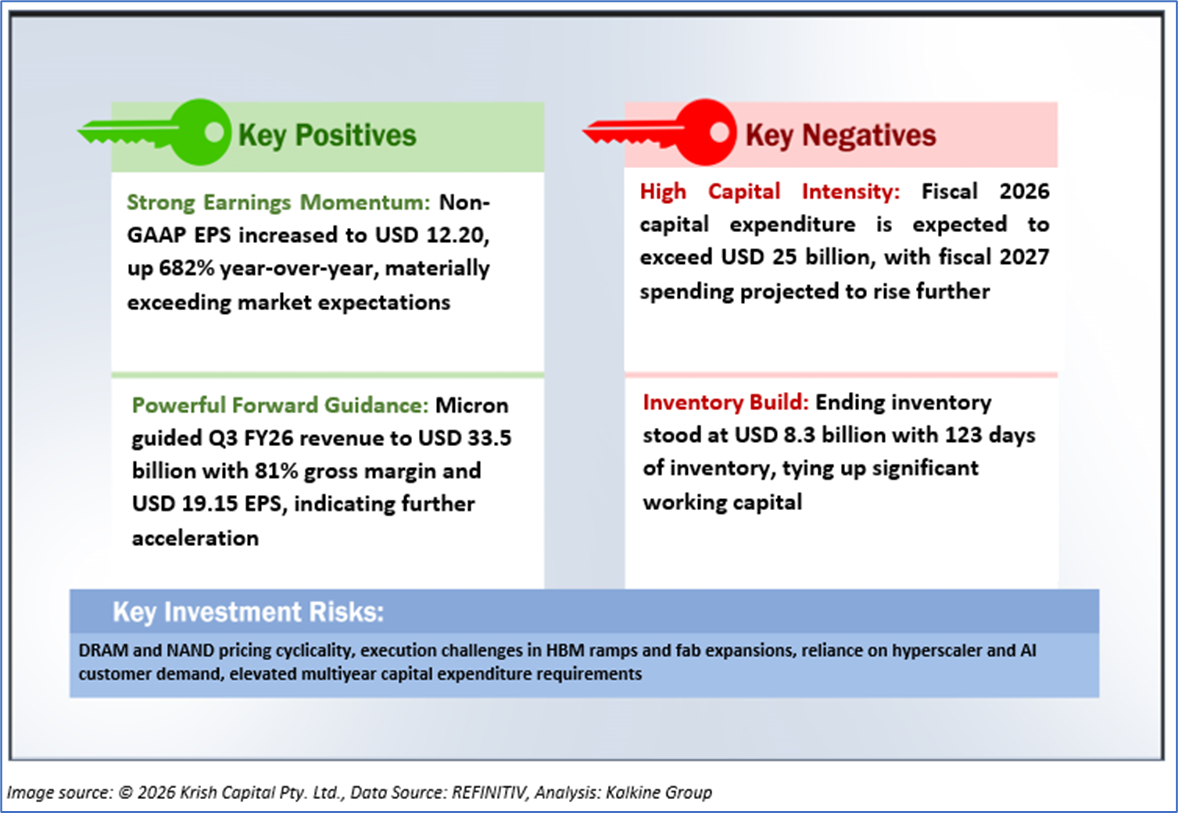
1.3 The Key Positives, Negatives, and Investment summary
1.4 Top 10 shareholders:
The top 10 shareholders together form ~38.23% of the total shareholding, signifying concentrated shareholding. The Vanguard Group, Inc., and BlackRock Institutional Trust Company, N.A. are the biggest shareholders, holding the maximum stake in the company at ~9.03% and ~5.67%, respectively.
1.5 Key Metrics:
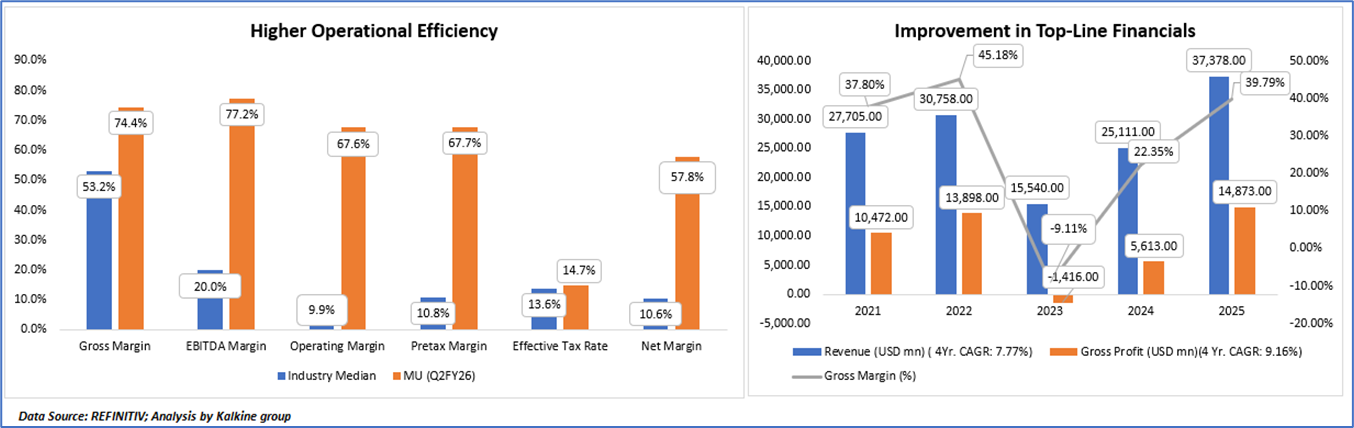
- Revenue Growth and Cyclical Recovery Profile: Micron Technology has demonstrated a resilient multi-year revenue trajectory despite operating in a highly cyclical memory industry. Revenue increased from USD 27,705 million in FY2021 to USD 37,378 million in FY2025, representing a 4-year CAGR of 7.77%. After peaking at USD 30,758 million in FY2022, revenue declined sharply to USD 15,540 million in FY2023 amid a severe memory downturn, inventory corrections, and weak end-market demand. However, the company recovered strongly to USD 25,111 million in FY2024 and further accelerated to USD 37,378 million in FY2025, reflecting a powerful upcycle driven by improving DRAM/NAND pricing, AI-related demand, and tighter industry supply conditions.
- Gross Profit Expansion and Margin Rebound: Gross profit trends highlight Micron’s high operating leverage to industry pricing cycles. Gross profit rose from USD 10,472 million in FY2021 to USD 13,898 million in FY2022, before collapsing to a gross loss of USD 1,416 million in FY2023 during the industry downturn. Recovery thereafter was substantial, with gross profit rebounding to USD 5,613 million in FY2024 and surging to USD 14,873 million in FY2025, implying a 4-year CAGR of 9.16% despite the cyclical trough. Gross margin followed a similar path, rising from 37.80% in FY2021 to 45.18% in FY2022, turning negative at (9.11%) in FY2023, then recovering sharply to 22.35% in FY2024 and 39.79% in FY2025. This underscores Micron’s strong earnings sensitivity to pricing normalization and supply-demand tightening.
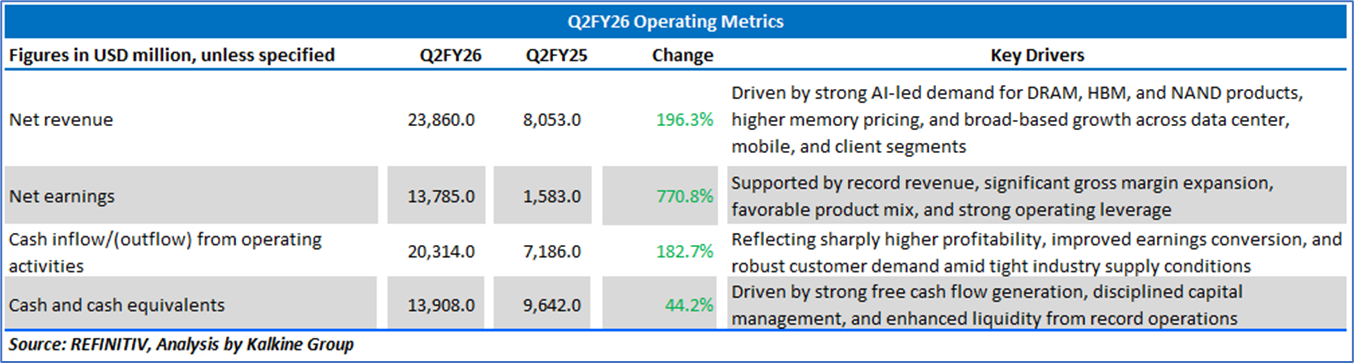
- Q2 FY26 Profitability Significantly Above Industry Benchmarks: Micron’s Q2 FY26 margins indicate the company is currently operating at exceptional cyclical highs, materially above industry median levels. Gross margin stood at 74.4% versus the 53.2% industry median, while EBITDA margin reached 77.2% compared with 20.0% for peers. Operating margin of 67.6% versus 9.9%, pretax margin of 67.7% versus 10.8%, and net margin of 57.8% versus 10.6% demonstrate extraordinary profitability strength. These results suggest Micron is benefiting from premium pricing, favorable product mix such as HBM and AI memory, disciplined cost structure, and strong execution during a tight supply environment. The effective tax rate of 14.7% remained broadly aligned with the 13.6% industry median, indicating earnings quality was driven primarily by operating fundamentals rather than tax benefits.
- Business Model Strength and AI Upside: Micron’s recent performance indicates that the company has moved beyond a traditional commodity memory narrative toward a more strategic AI infrastructure supplier. Growth in HBM, server DRAM, enterprise SSDs, and high-performance memory solutions is structurally improving revenue quality and profitability. This evolution may reduce the severity of future downcycles relative to historical memory cycles, particularly if AI demand remains durable and long-dated.
Section 2: Business Updates and Financial Highlights
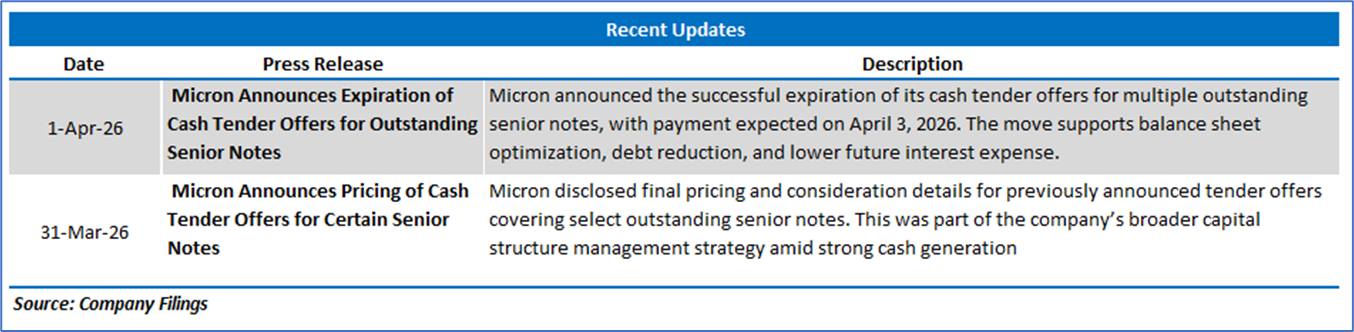
2.1 Recent Updates:
The below picture gives an overview of the recent updates:
2.2 Insights of Q2FY26:
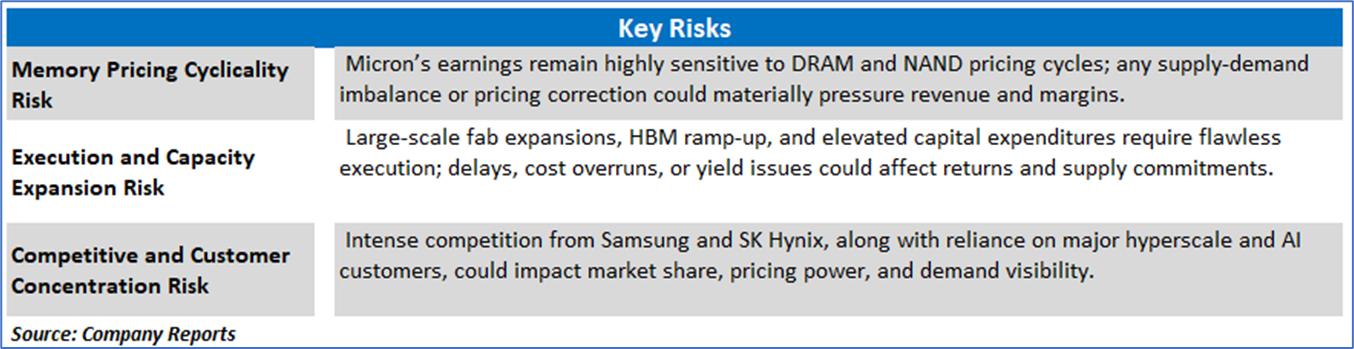
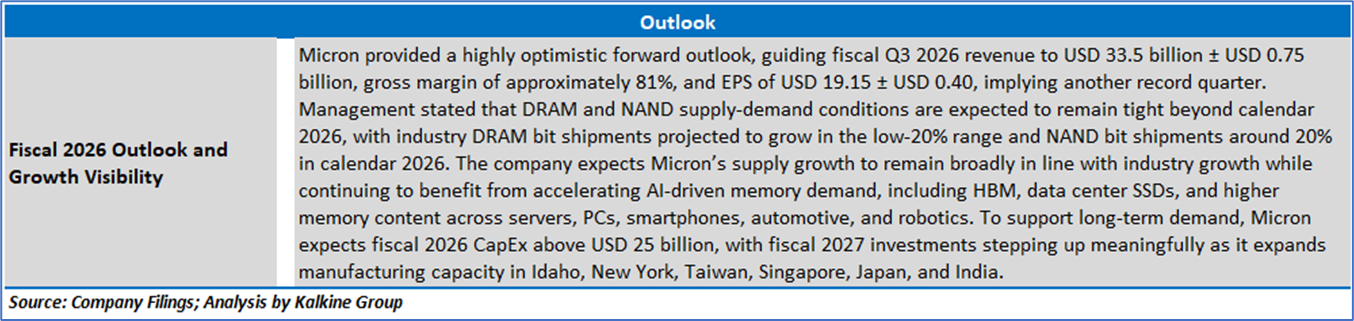
Section 3: Key Risks and Outlook:
Section 4: Stock Recommendation Summary:
4.1 Technical Summary:
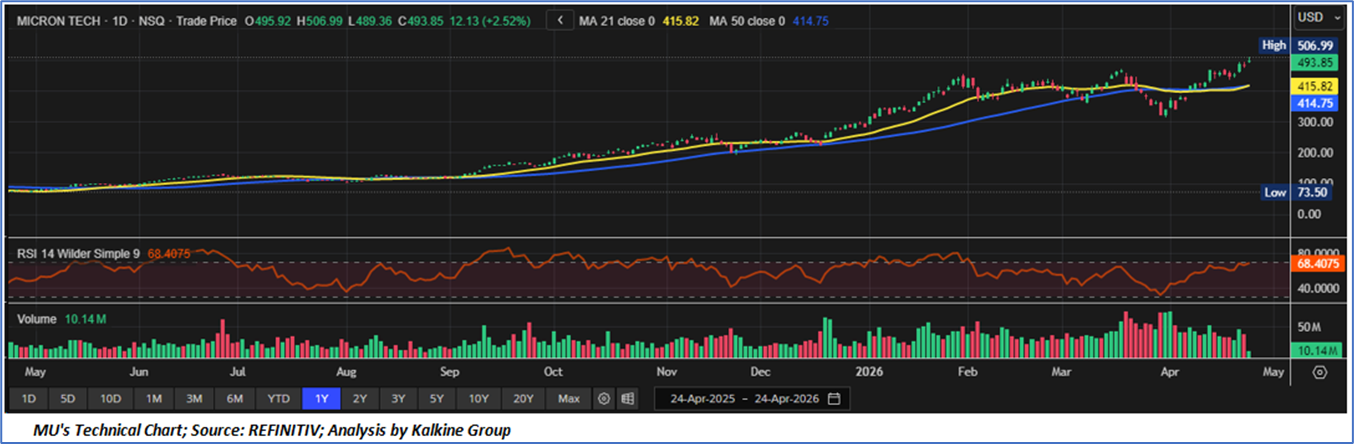
- Primary Trend Strength and Breakout Continuation: MU remains in a powerful long-term uptrend, with price advancing to USD 493.85 and trading firmly above both the 21-day moving average at USD 415.82 and the 50-day moving average at USD 414.75. The stock has recently broken above prior consolidation resistance and is now approaching the recent swing high near USD 506.99, confirming continuation of bullish price structure marked by persistent higher highs and higher lows. The tight clustering of the 21-day and 50-day averages below price suggests strong trend support, while the sustained separation between spot price and moving averages reflects accelerated upside momentum rather than late-stage breakdown risk.
- Momentum, Participation and Internal Market Health: Momentum conditions remain robust, with the 14-day RSI near 68.41, indicating strong bullish participation while still marginally below classic overbought thresholds. This suggests upside momentum is elevated but not yet decisively exhausted. Volume trends have remained constructive throughout the advance, with recurring participation spikes on breakout sessions and no clear evidence of heavy institutional distribution during pullbacks. The ability of MU to maintain elevated RSI readings while consolidating gains signals internal strength and continued demand sponsorship, consistent with leadership behavior in strong secular trends.
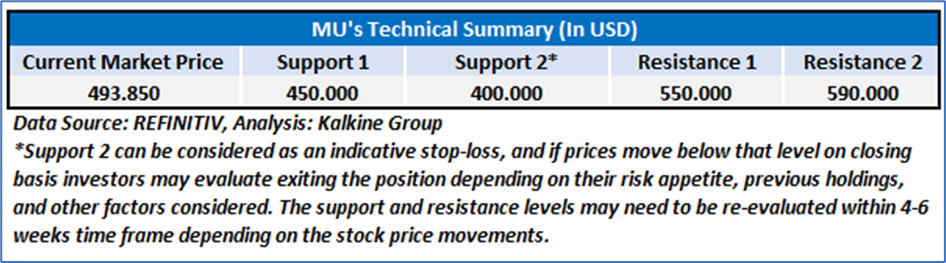
- Key Levels, Tactical Setup and Forward Bias: From a tactical perspective, immediate resistance is located at the recent high near USD 506.99; a decisive breakout above this level could open the path toward the USD 530–550 extension zone. On the downside, first support is visible near USD 460–470, followed by stronger dynamic support at the 21-day / 50-day moving average cluster near USD 415. As long as MU remains above this support band, the prevailing bias remains firmly bullish. While short-term consolidation or profit-taking is possible given the extended run, the broader technical structure continues to favor trend continuation over reversal, supported by strong momentum and sustained price leadership.
4.2 Fundamental Valuation
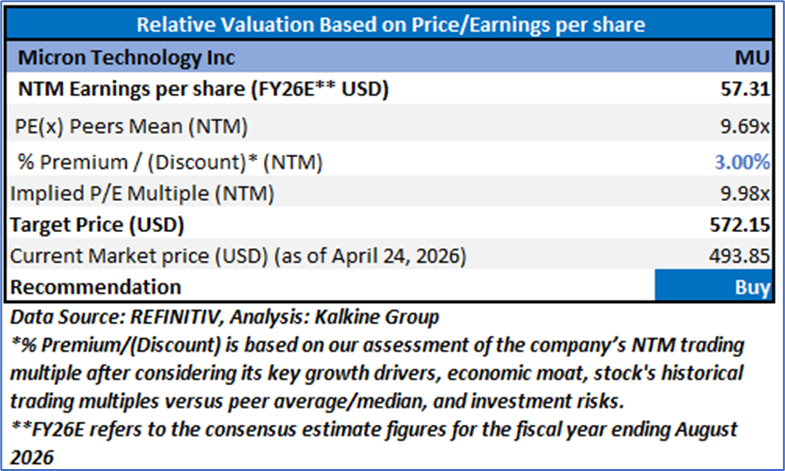
Valuation Methodology: Price/Earnings Per Share Multiple Based Relative Valuation
Markets are trading in a highly volatile zone currently due to certain macroeconomic issues and geopolitical tensions prevailing. Therefore, it is prudent to follow a cautious approach while investing.
Note 1: Past performance is not a reliable indicator of future performance.
Note 2: The reference date for all price data, currency, technical indicators, support, and resistance levels is April 24, 2026. The reference data in this report has been partly sourced from REFINITIV.
Note 3: Investment decisions should be made depending on an individual's appetite for upside potential, risks, holding duration, and any previous holdings. An 'Exit' from the stock can be considered if the Target Price mentioned as per the Valuation and or the technical levels provided have been achieved and is subject to the factors discussed above.
Note 4: The report publishing date is as per the Pacific Time Zone.
Technical Indicators Defined: -
Support: A level at which the stock prices tend to find support if they are falling, and a downtrend may take a pause backed by demand or buying interest. Support 1 refers to the nearby support level for the stock and if the price breaches the level, then Support 2 may act as the crucial support level for the stock.
Resistance: A level at which the stock prices tend to find resistance when they are rising, and an uptrend may take a pause due to profit booking or selling interest. Resistance 1 refers to the nearby resistance level for the stock and if the price surpasses the level, then Resistance 2 may act as the crucial resistance level for the stock.
Stop-loss: It is a level to protect against further losses in case of unfavorable movement in the stock prices.
Disclaimer-
This report (“Report”) has been issued by Kalkine Pty Limited (ABN 34 154 808 312) (Australian financial services licence number 425376) (“Kalkine”) and prepared by Kalkine and its related bodies corporate who are authorised to provide general financial product advice. Kalkine.com.au and its associated pages are published by Kalkine.
Any advice provided in this Report is general advice only and does not take into account your objectives, financial situation or needs. You should therefore consider whether the advice is appropriate for your objectives, financial situation and needs before acting upon it.
There may be a Product Disclosure Statement, Information Memorandum or other offer document (“Offer Document”) for the securities or other financial products referred in this Report. You should obtain a copy of the relevant Offer Document and consider it before making any decision about whether to acquire the security or financial product.
Kalkine strongly recommends that you seek advice from a financial adviser, stockbroker or other professional (including taxation and legal advice) before acting on any of the general advice in this Report or on the Kalkine website. Not all investments are appropriate for all people.
The information in this Report and on the Kalkine website has been prepared from a wide variety of sources, which Kalkine, to the best of its knowledge and belief, considers accurate. Kalkine has made every effort to ensure the reliability of the information contained in its reports (including this Report), newsletters and websites. All information represents our views at the date of publication and may change without notice.
The information in this Report does not constitute an offer to sell securities or other financial products or a solicitation of an offer to buy securities or other financial products. Our reports contain general recommendations to invest in securities and other financial products. Kalkine is not responsible for, and does not guarantee, the performance of, or returns on, any investments mentioned in this Report.
Kalkine does not issue, sell or deal in any financial products.
This Report may contain information on past performance of particular investments. Past performance is not a reliable indicator of future performance. Returns stated do not take into account transaction costs and taxes. To the extent permitted by law, and excluding any dishonesty or gross negligence by Kalkine, Kalkine disclaims and excludes all liability for any direct, indirect, implied, punitive, special, incidental or other consequential loss or damage arising from the use of or reliance on this Report, the Kalkine website and any information published on the Kalkine website without any warranties or representations by Kalkine to you. To the extent the law prohibits or limits this exclusion, Kalkine limits its liability to the resupply of services.
Please also read our Terms & Conditions and Financial Services Guide for further information. Employees and/or associates of Kalkine and its related entities may hold interests in the securities or other financial products covered in this Report or on the Kalkine website. Any such employees and associates are required to comply with certain, procedures and disclosures as required by law.
Kalkine Media Pty Ltd, an affiliate of Kalkine Pty Ltd, may have received, or be entitled to receive, financial consideration in connection with providing information about certain entity(s) covered on its website including entities covered in this Report.
Copyright 2026 Krish Capital Pty. Ltd. (ABN 61629651510). All Rights Reserved. No part of this report, or its content, may be reproduced in any form without our prior consent.
Past performance is not a reliable indicator of future performance.

 CA
 NZ
 UK
 US
 IND

 AU

 Please wait processing your request...