Section1: Company Overview and Fundamental Insights:

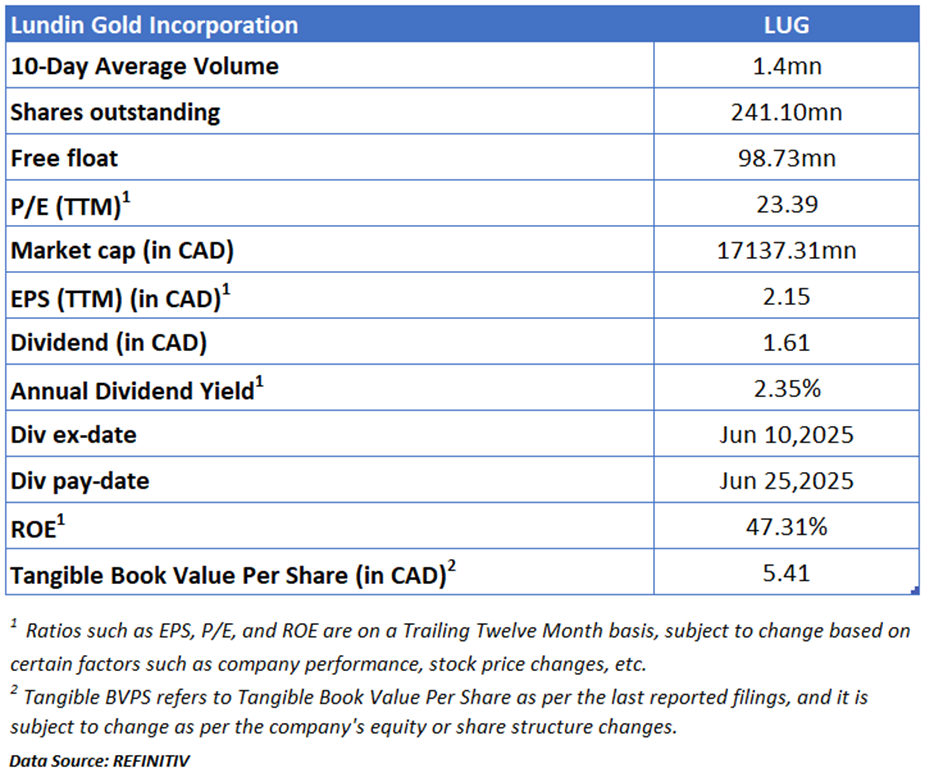
Lundin Gold Incorporation (TSX: LUG) is a Canada based company focused on its Fruta del Norte gold operation and developing its portfolio of mineral concessions in Ecuador. The Fruta del Norte deposit is located within a 150 km long copper-gold metallogenic sub-province located in the Cordillera del Condor region in southeastern Ecuador.
Kalkine’s Low Carbon Report covers the Key Investment Highlights, Key Financial Metrics, Risks, Technical Analysis along with the Valuation, Target Price, and Recommendation on the stock.

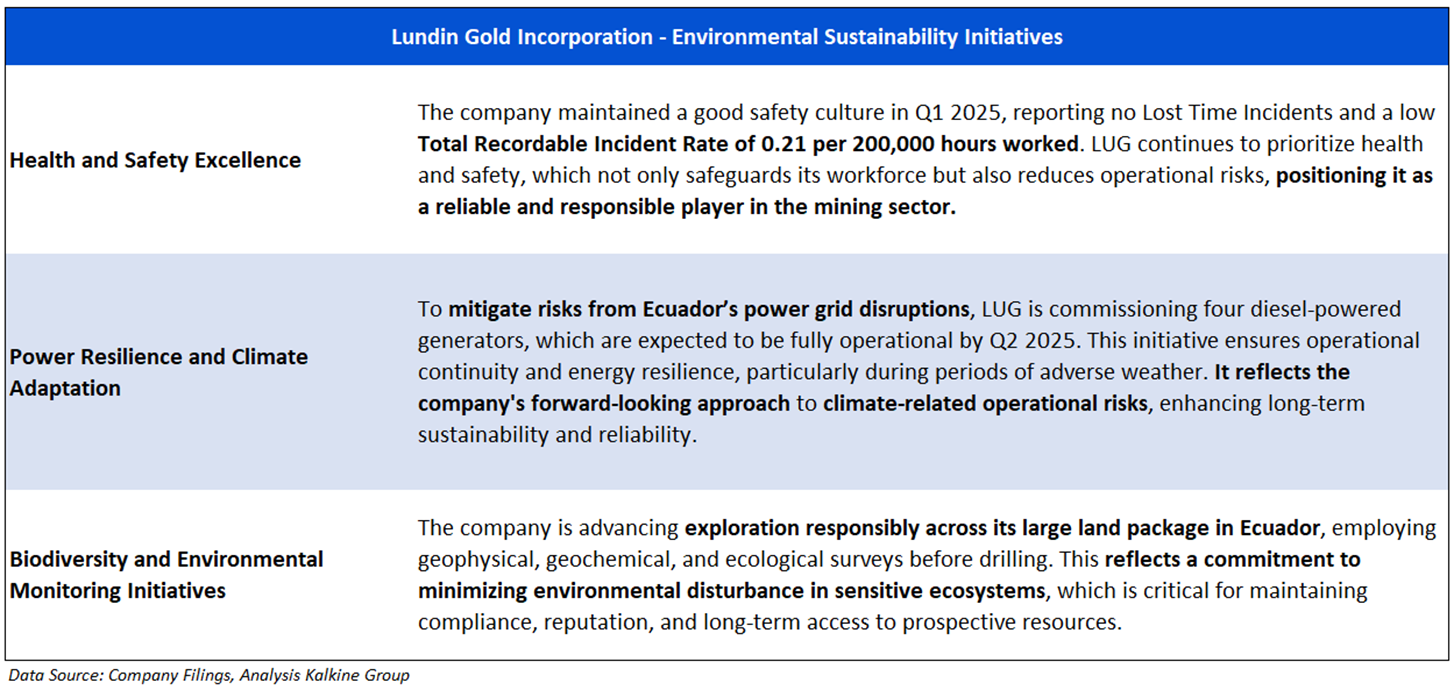
The shift toward a low-carbon economy is one of the most significant challenges of current time, spurred by the urgent need to combat climate change and reduce the environmental impact of corporate activities. This report covers the TSX-listed low-carbon emission company (TSX: LUG), that is committed to sustainability and responsible environmental practices.
Carbon and Waste Management - Key Metrics
Lundin Gold Incorporation (TSX: LUG), has sustained its environmental efforts by significantly increasing waste recycling while progressively reducing CO₂ equivalent emissions between 2019 and 2023.

Peer Comparison: Carbon Emission Metrics


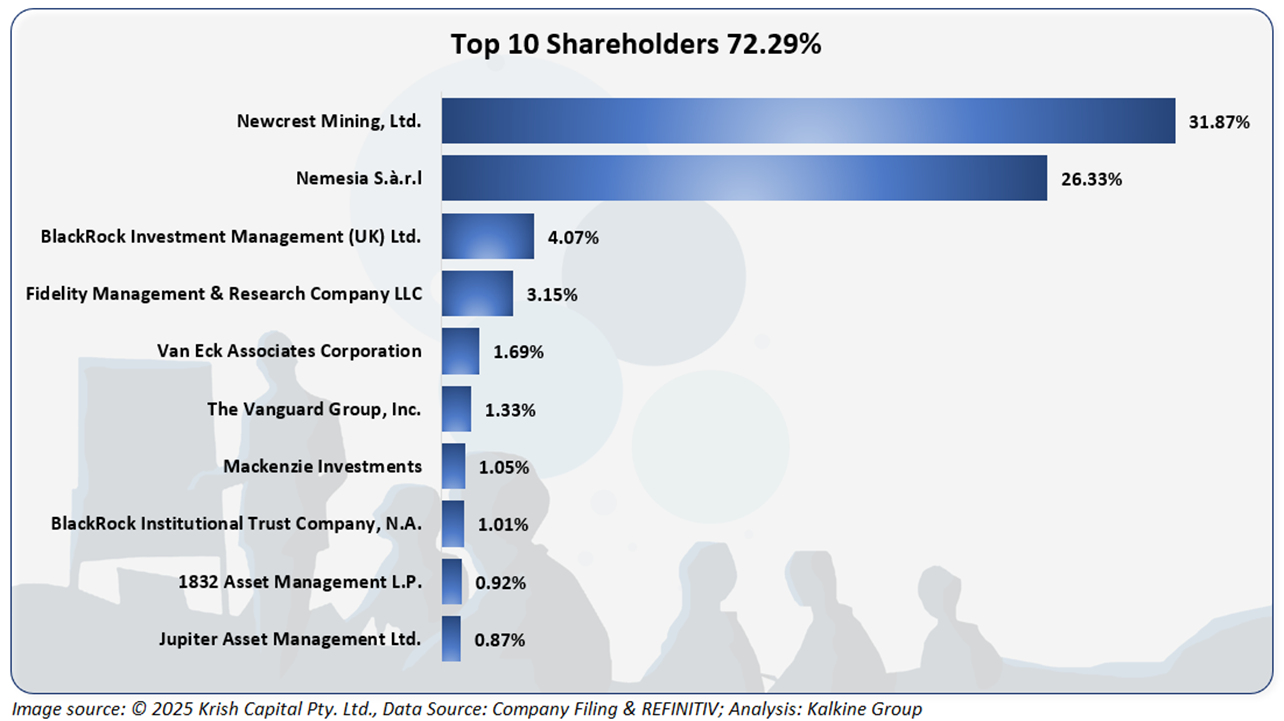
The top 10 shareholders together form ~72.29% of the total shareholding. Newcrest Mining, Ltd. and Nemesia S.à.r.l hold a maximum stake in the company at ~31.87% and ~26.33%, respectively.

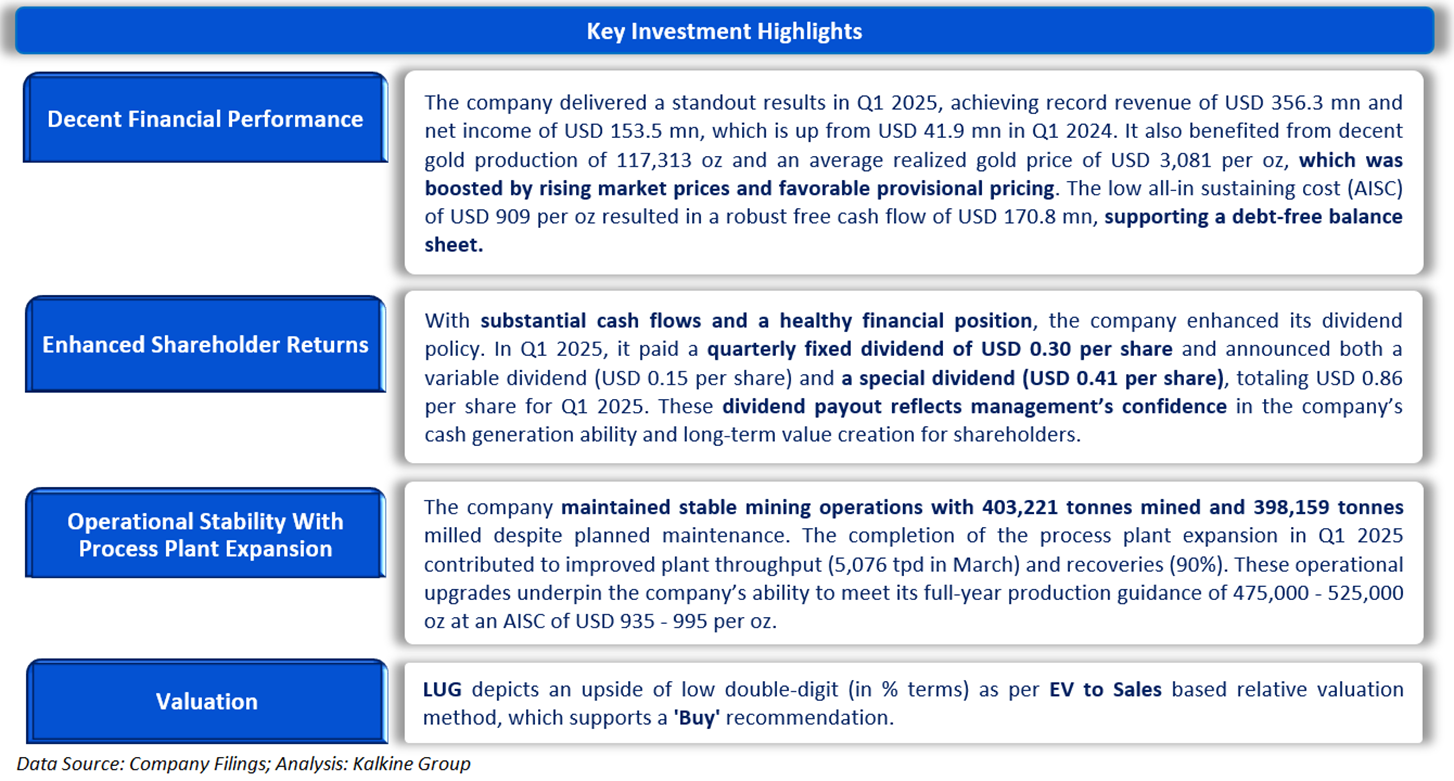
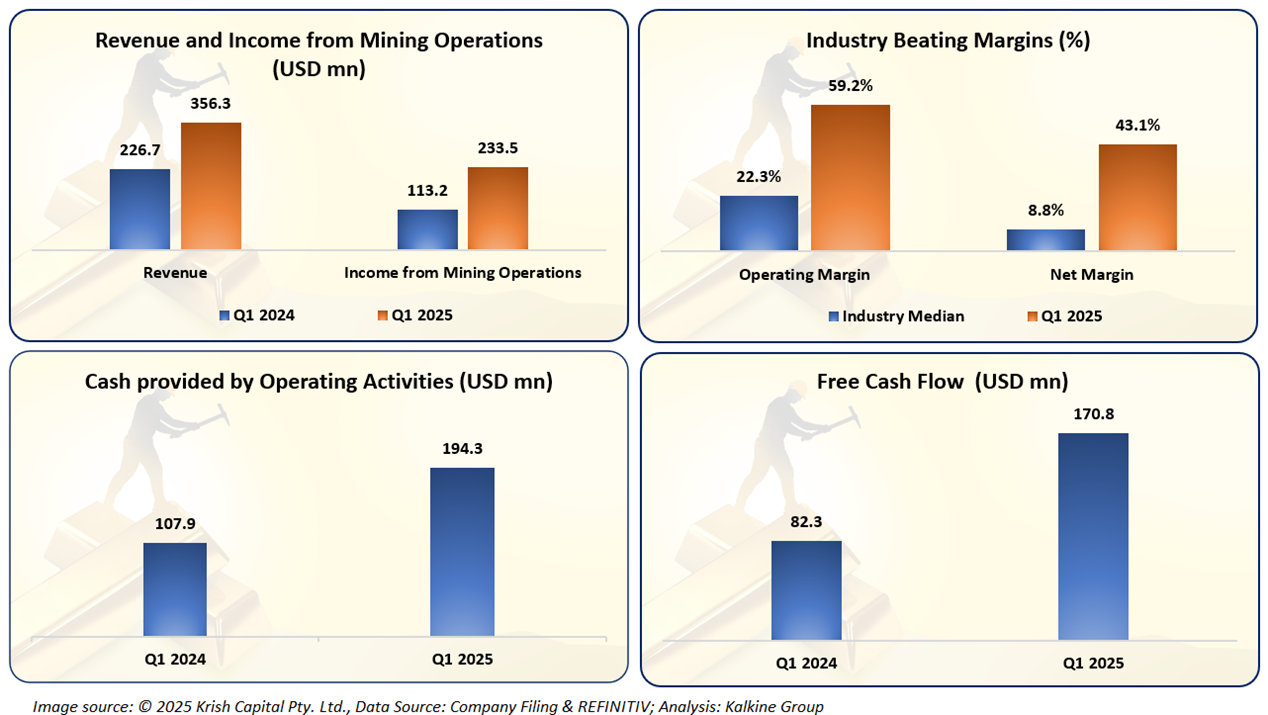
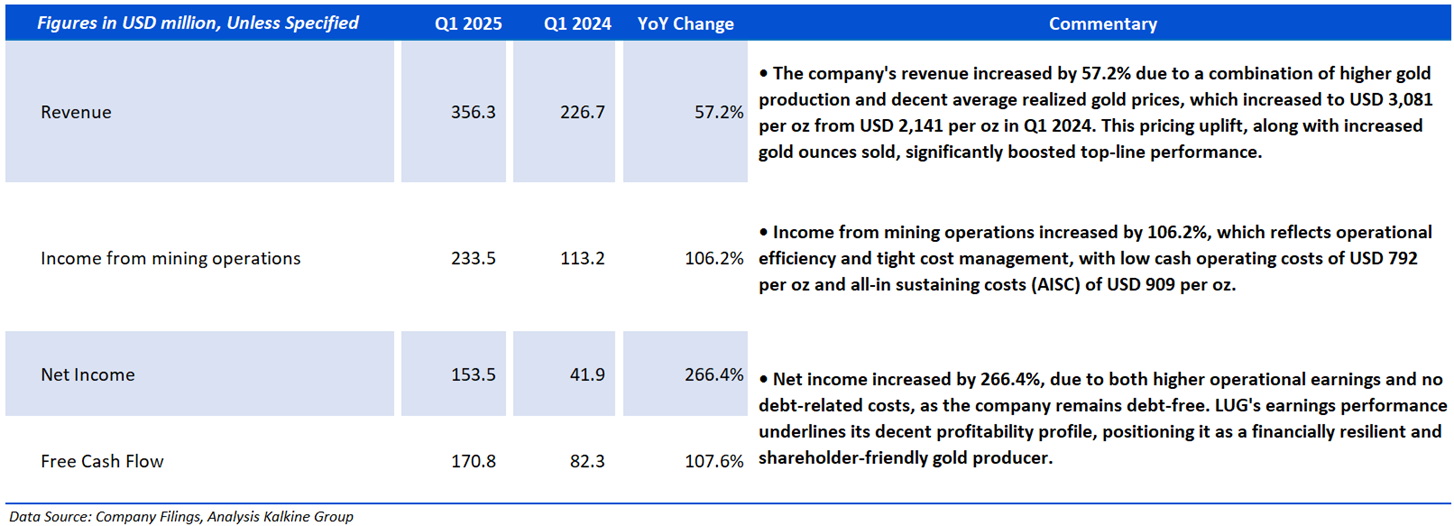
The company reported rising financials in Q1 2025, where it clocked healthy growth under its Revenue and Earnings from Mining Operations, which is a key positive. Furthermore, it witnessed industry beating margins and elevated Free Cash Flow, displaying its strength and adaptability.
Section 2: Business Updates and Financial Highlights
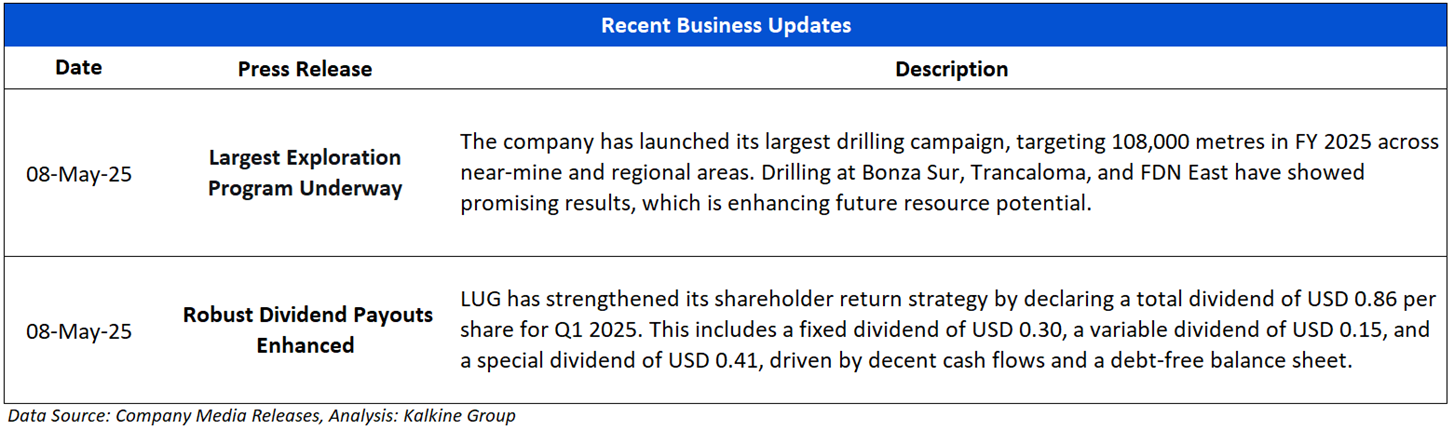
The picture below gives an overview of the company’s recent activities, such as an announcement regarding largest Exploration Program and Dividend Payout.

Section 3: Key Risks and Company Outlook
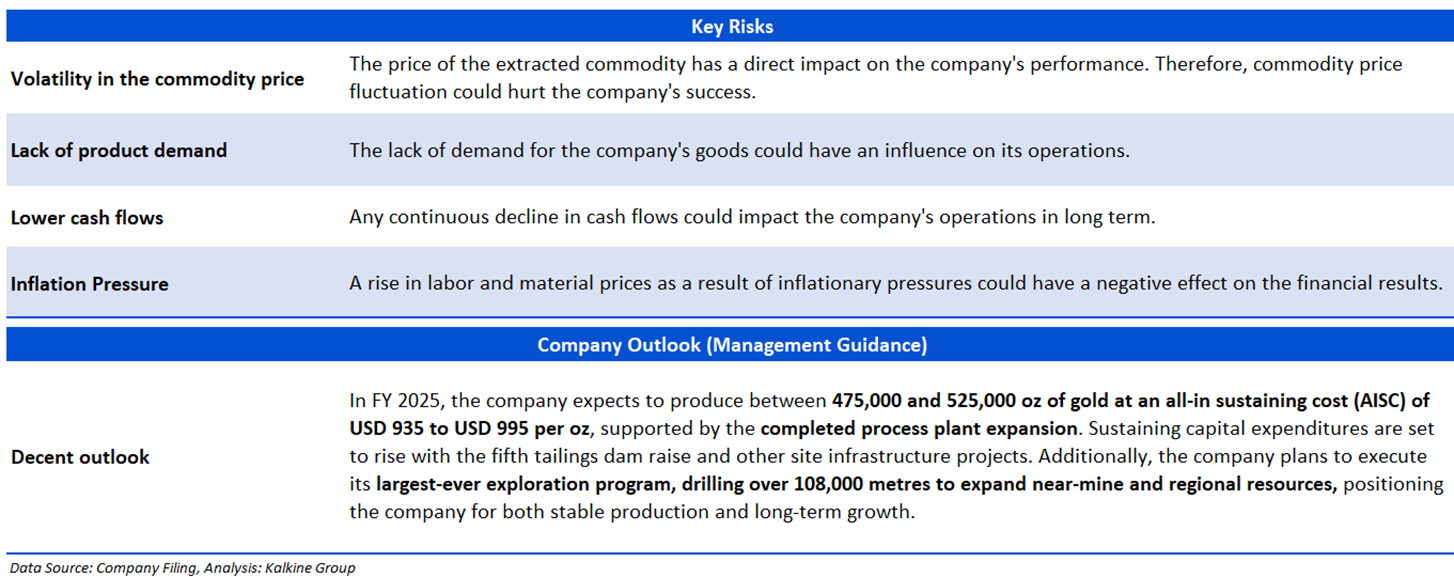
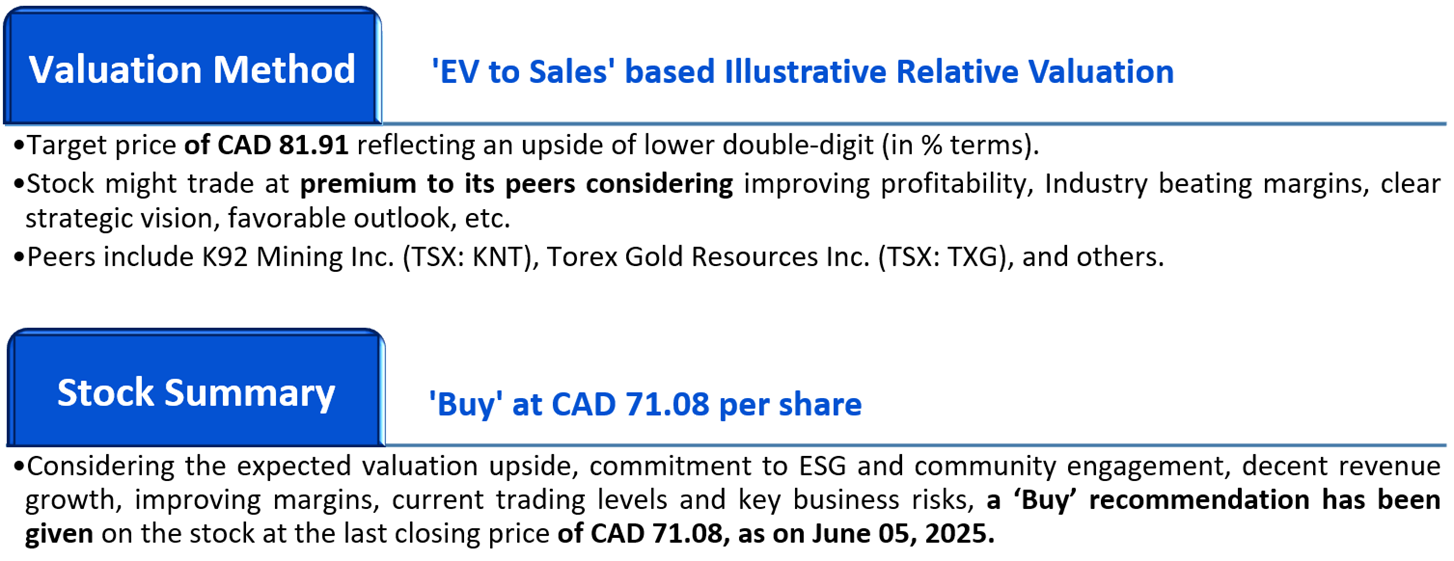
Section 4: Stock Recommendation Summary:


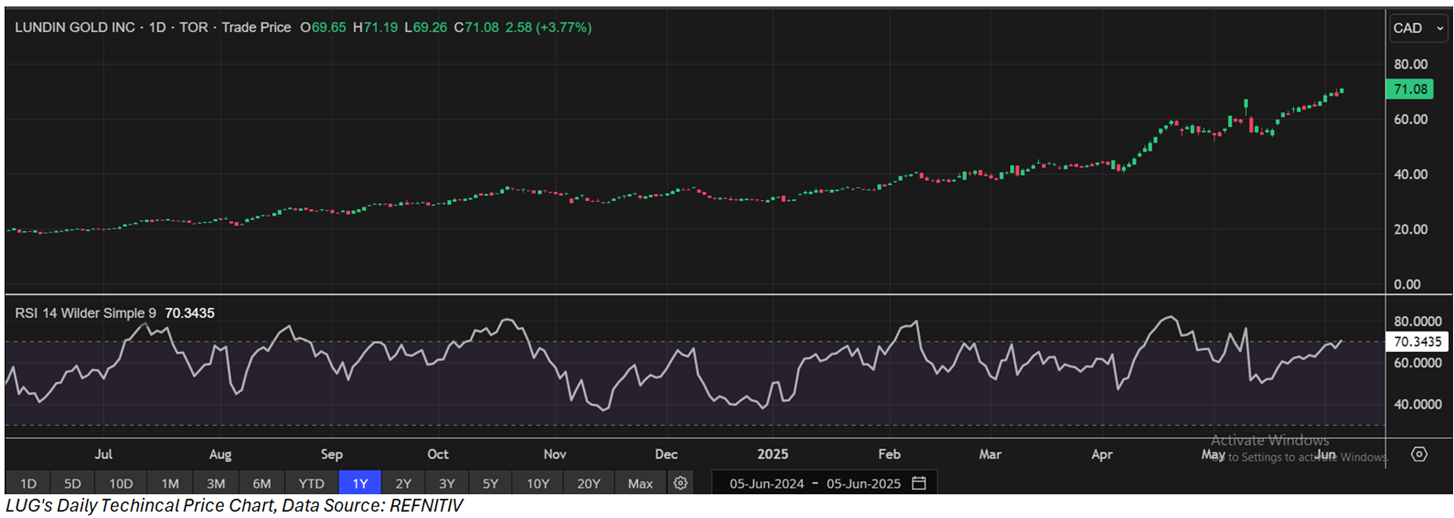
The stock has witnessed an upward of ~9.87% and ~16.25% over the last 1 week and 1 month respectively. Moreover, it is trading above the average 52-week high price of CAD 71.19 and 52-week low price of CAD 18.47, providing an opportunity to ride the trend.

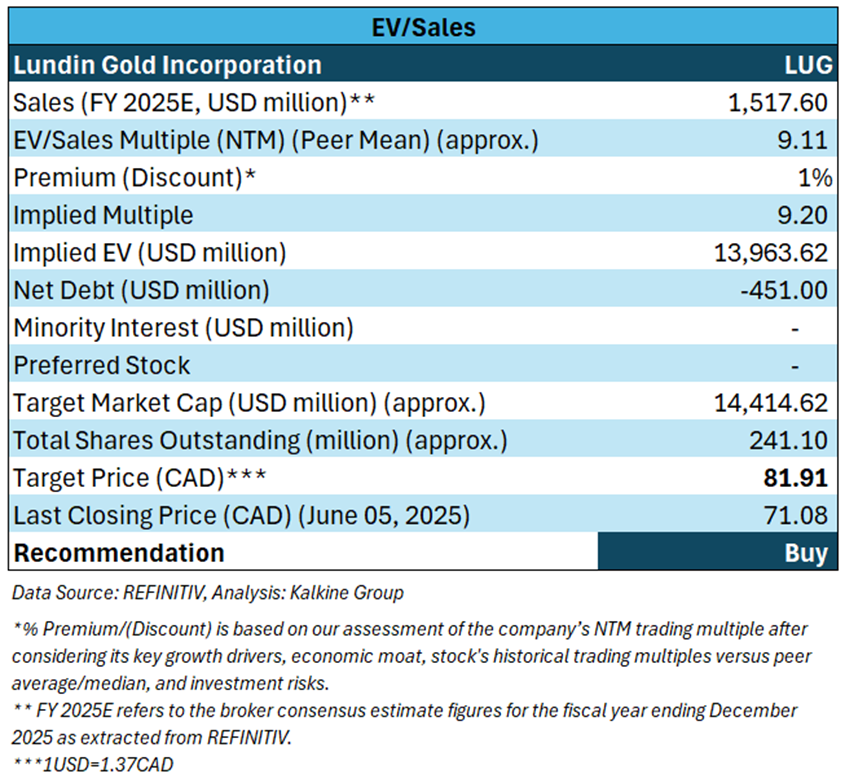
Valuation Methodology: EV to Sales Multiple Based Relative Valuation (Illustrative):
Markets are trading in a highly volatile zone currently due to certain macroeconomic issues and geopolitical tensions prevailing. Therefore, it is prudent to follow a cautious approach while investing.
Note 1: Past performance is not a reliable indicator of future performance.
Note 2: The reference date for all price data, currency, technical indicators, support, and resistance levels is June 05, 2025. The reference data in this report has been partly sourced from REFINITIV.
Note 3: Investment decisions should be made depending on an individual's appetite for upside potential, risks, holding duration, and any previous holdings. An 'Exit' from the stock can be considered if the Target Price mentioned as per the Valuation and or the technical levels provided has been achieved and is subject to the factors discussed above.
Note 4: Dividend Yield may vary as per the stock price movement.
Note 5: Kalkine reports are prepared based on the stock prices captured either from REFINITIV or Trading View. Typically, REFINITIV or Trading View may reflect stock prices with a delay which could be a lag of 25-30 minutes. There can be no assurance that future results or events will be consistent with the information provided in the report. The information is subject to change without any prior notice.
Technical Indicators Defined: -
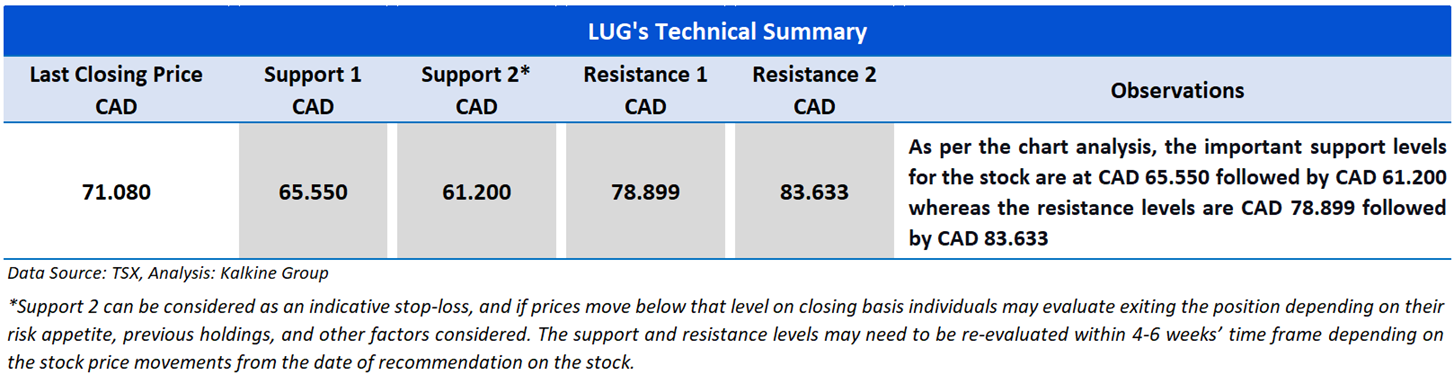
Support: A level at which the stock prices tend to find support if they are falling, and a downtrend may take a pause backed by demand or buying interest. Support 1 refers to the nearby support level for the stock and if the price breaches the level, then Support 2 may act as the crucial support level for the stock.
Resistance: A level at which the stock prices tend to find resistance when they are rising, and an uptrend may take a pause due to profit booking or selling interest. Resistance 1 refers to the nearby resistance level for the stock and if the price surpasses the level, then Resistance 2 may act as the crucial resistance level for the stock.
Stop-loss: It is a level to protect further losses in case of unfavourable movement in the stock prices.
This report has been issued by Kalkine Pty Limited (ABN 34 154 808 312) (Australian financial services licence number 425376) (“Kalkine”) and prepared by Kalkine and its related bodies corporate authorised to provide general financial product advice. Kalkine.com.au and associated pages are published by Kalkine.
Any advice provided in this report is general advice only and does not take into account your objectives, financial situation or needs. You should therefore consider whether the advice is appropriate to your objectives, financial situation and needs before acting upon it.
There may be a Product Disclosure Statement, Information Statement or other offer document for the securities or other financial products referred to in Kalkine reports. You should obtain a copy of the relevant Product Disclosure Statement, Information Statement or offer document and consider the statement or document before making any decision about whether to acquire the security or product.
Choosing an investment is an important decision. If you do not feel confident making a decision based on the recommendations Kalkine has made in our reports, you should consider seeking advice from a financial adviser, stockbroker or other professional (including taxation and legal advice) before acting on any advice in this report or on the Kalkine website. Not all investments are appropriate for all people.
The information in this report and on the Kalkine website has been prepared from a wide variety of sources, which Kalkine, to the best of its knowledge and belief, considers accurate. Kalkine has made every effort to ensure the reliability of information contained in its reports, newsletters and websites. All information represents our views at the date of publication and may change without notice. The information in this report does not constitute an offer to sell securities or other financial products or a solicitation of an offer to buy securities or other financial products. Our reports contain general recommendations to invest in securities and other financial products.
Kalkine is not responsible for, and does not guarantee, the performance of the investments mentioned in this report This report may contain information on past performance of particular investments. Past performance is not an indicator of future performance. Hypothetical returns may not reflect actual performance. Any displays of potential investment opportunities are for sample purposes only and may not actually be available to investors. To the extent permitted by law, Kalkine excludes all liability for any loss or damage arising from the use of this report, the Kalkine website and any information published on the Kalkine website (including any indirect or consequential loss, any data loss or data corruption). If the law prohibits this exclusion, Kalkine hereby limits its liability, to the extent permitted by law, to the resupply of services..
Please also read our Terms & Conditions and Financial Services Guide for further information. Employees and/or associates of Kalkine and its related entities may hold interests in the securities or other financial products covered in this report or on the Kalkine website. Any such employees and associates are required to comply with certain safeguards, procedures and disclosures as required by law.
Kalkine Media Pty Ltd, an affiliate of Kalkine Pty Ltd, may have received, or be entitled to receive, financial consideration in connection with providing information about certain entity(s) covered on its website including entities covered in this Report.
Past performance is not a reliable indicator of future performance.
 Please wait processing your request...