
Company Overview: Lovisa Holdings Limited is engaged in the retail sale of fashion jewelry and accessories. The Company's segments include Australia & New Zealand, which is engaged in the retail sale of women's jewelry and accessories in Australia and New Zealand, and Rest of the World, which is engaged in the retail sale of women's jewelry and accessories in Singapore, South Africa, Malaysia and the United Kingdom. The Rest of the World segment also includes the Company's franchise stores in the Middle East. The Company utilizes daily inventory monitoring software and airfreight to move product to store locations within approximately 48 hours from its centrally located warehouses in Melbourne and Hong Kong. The Company has over 230 retail stores. Its each store contains an average of over 2,500 product lines. It operates in Australia, New Zealand, Singapore, Malaysia, South Africa and the United Kingdom, and franchised stores in the Middle East (Kuwait, the United Arab Emirates and Saudi Arabia).
.png)
LOV Details
Growth Strategy Focused on Store Expansion: Lovisa Holdings Limited (ASX: LOV) engages in the retail sale of fashion jewellery and other accessories, through a network of retail and franchise stores. During the year ended 30th June 2019, the company reported another year of strong performance, with double-digit growth in revenue. However, the company witnessed a slowdown in EBIT growth due to continued investment in store expansion and associated costs. During the period, the company declared decent dividends for shareholders, rising 1% in comparison to the prior corresponding year. In FY19, the company was majorly focused on its store network growth, which resulted in an increase in the cost of doing business. The company, however, is making the best of efforts to choose the right sites for its stores, so as to bring the required efficiencies on the platform. The period also saw a transition from its Hong Kong third party warehouse to a new one in Qingdao, Chicago, to better support its global expansion strategy. The company introduced piercing to its product offerings in stores, which represents a key opportunity for the business. Cash flow position during the period remained strong, with operating cash conversion standing at 107%. The company also reported an improvement in comparable sales, that declined at a rate of 0.5% on the previous year, depicting a lower decline than that recorded in FY18. Up to the 17 weeks for FY20, comparable sales continued to improve, leaving the red zone and reporting an increase of 2.3% on the prior corresponding period.
In FY20, the company is aiming for further expansion to the store network, while maintaining the correct balance between costs and new store rollout. Moreover, the company will continue to invest in its support structures, especially in the USA, to support store expansion.
Over the period covering FY15-FY19, the company has reported continuous growth in revenue. In FY19, revenue increased at a rate of 15.3% on the prior corresponding year, supported by several positives during the period, that included expansion in the number of offshore stores, tighter inventory management that boosted the gross margin, and a stronger USD hedge rate during the year. Over the four years period, revenue witnessed a CAGR of 16.8%, with the highest growth reported in FY18 at 21.4%..png)
Growth in Sales (Source: Company Reports)
FY19 Financial Performance: During the year ended 30th June 2019, the company reported revenue amounting to $250.3 million, up 15.3% on prior corresponding year revenue of $217.0 million. Gross profit for the year came in at $201.41 million, up 16.0% on the prior corresponding period gross profit of $173.6 million. Operating expenses for the year went up by 20.5%, with FY19 and FY18 expenses amounting to $139.09 million and $115.44 million, respectively. EBIT went up by 2.8% on the prior corresponding year, depicting a slower growth due to higher fit-out costs. EBITDA for the period stood at $62.32 million, up 7.1% on the prior corresponding period EBITDA of $58.20 million. Net profit after tax came in at $37.04 million, up 3% on the prior corresponding year NPAT of $35.95 million..png)
FY19 Financial Highlights (Source: Company Reports)
Key Sales Drivers: Growth in revenue is partly attributable to an increase in gross margin, that came in at 80.5% in FY19. Gross margin expanded as a result of tighter inventory management and a stronger USD hedge rate. The company stated that an improvement of ~34 basis points in gross margin came in on the back of a stronger AUD/USD hedge rate on stock purchases. Increase in revenue was also supported by the addition of 64 new offshore stores. The company worked hard to identify quality retail store sites, with high customer traffic. At the end of the year, the company had a total of 390 stores across 15 countries, including Australia, New Zealand, USA, Malaysia, South Africa, Singapore, UK, France, and Spain. The network of stores also comprised of supporting franchised stores in the United Arab Emirates, Bahrain, Vietnam, Saudi Arabia, and Oman. As per the trading update to 29th October 2019, the company reported that the number of stores increased to 421, with 33 stores operating in the US across 5 states. LOV expects the same to increase further through continued investment..png)
Store Network (Source: Company Reports)
Increase in CODB: As a result of expanding the number of stores, the company witnessed an increase in the cost of doing business. To execute smooth growth in new markets, the company enhanced its team capabilities through investment in the senior executive team. Moreover, the company reviewed its global supply chain and relocated its Asian logistics function from Hong Kong to Qingdao, to drive future performance. Some of the costs were also attributable to the launch of eCommerce in the UK, Europe and Australia. The rollout of stores also impacted the cost of doing business due to opening costs and higher operating costs for stores. While the company expects CODB for the new markets to be slightly higher than its mature markets, it is looking forward to generating decent returns by delivering the required efficiencies.
Market Performance: While the company reported higher operating costs in the USA as compared to other markets, it is optimistic about the success in the market as per the progress reported to date. Stores in France were also seen to be performing decently, with the company now looking for appropriate sites for expansion. The Spanish market has been identified to be performing inconsistently, and the company is taking the relevant steps for operational improvement in the market. For the time being, the management is not in favour of further store openings in the region and has notified on a slowdown in store expansion until operations in Spain deliver a convincing performance.
At the end of the year, the company reported a strong balance sheet position and strong cash flow with operating cash conversion reported at 107%. Capital expenditure for the period stood at $24.1 million, reflecting the expenditure on new store fit outs and refurbishments on existing stores. The expenditure increased by $8.9 million on the previous year. In FY19, the company increased the dividend to 15 cents per share and will continue to scrutinise its cash flow requirements to decide on dividends and capital structure for the future.
The company aims to position itself well with respect to grabbing opportunities as they arise. In doing so, it will ensure that the business has the resources to move into new markets or expand into the current ones.
Top 10 Shareholders: The top 10 shareholders have been highlighted in the table which together form around 62.01% of the total shareholding. BB Retail Capital Pty. Ltd. held the maximum number of shares with a percentage holding of 40.85%.
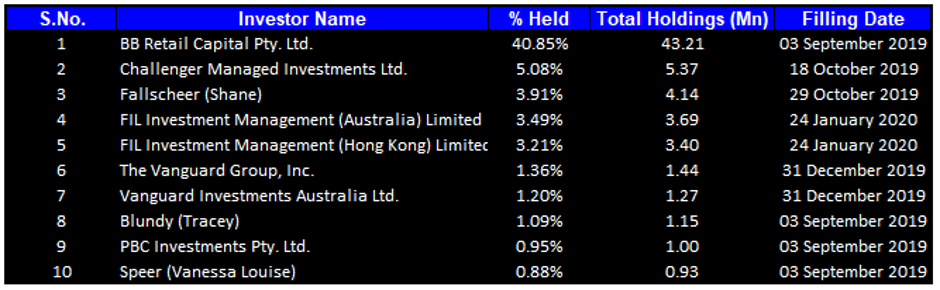
Top Ten Shareholders (Source: Thomson Reuters)
Key Metrics: In FY19, the company had a gross margin and EBITDA margin of 76.3% and 25%, respectively, which stood higher than the industry median. Debt levels remained at decent levels, with a debt-to-equity multiple of 0.15x in FY19. Current ratio for the year stood at 1.31x, as compared to the industry median of 1.26x, depicting better short-term liquidity in comparison to the industry.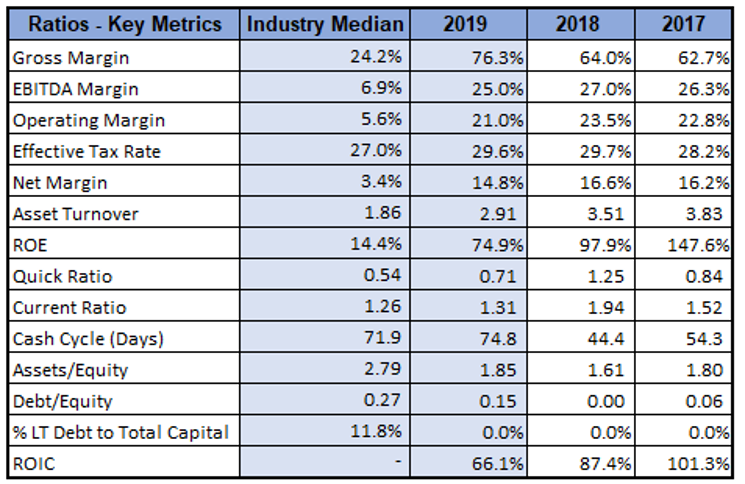
Key Metrics (Source: Thomson Reuters)
Outlook: Going forward, the company will continue to deliver on its growth strategy, through the expansion of its store network. In FY20, the company expects the increase in number of stores to be higher than FY19 and is focused on a diligent selection of sites to ensure maximum efficiency from new stores. At the end of October, the number of stores stood at 421, with 31 new stores opened since the end of FY19. In addition, the company expects the ongoing currency headwinds to continue throughout FY20, as the average USD hedge rate is expected to be lesser than US$0.70. Overall, the company’s key focus going forward, will be on tapping suitable store locations across its markets, continued investment to deliver on its growth ambitions, and delivering trending products to customers.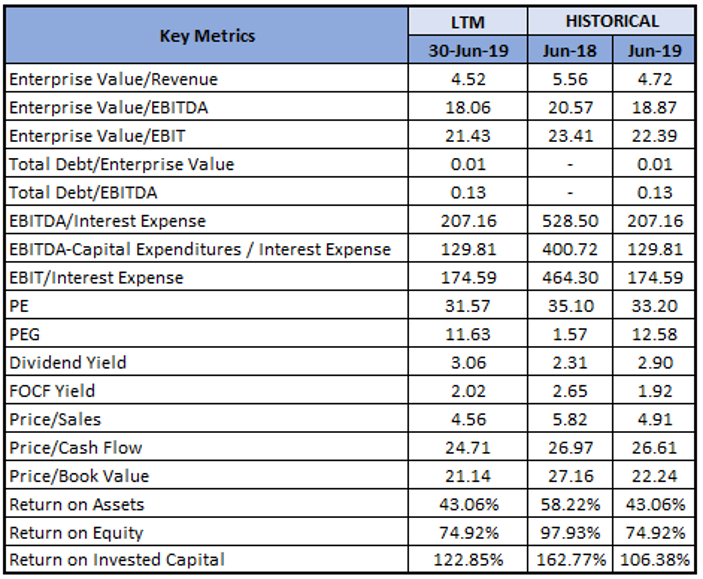
Key Valuation Metrics (Source: Thomson Reuters)
Valuation Methodology: Price to Cash Flow Multiple Approach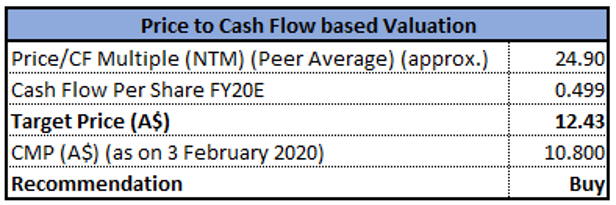
Price to Cash Flow Based Valuation (Source: Thomson Reuters)
Note: All forecasted figures and peers have been taken from Thomson Reuters, NTM-Next Twelve Months
Stock Recommendation: The stock of the company is currently trading slightly above the average of its 52-weeks trading range of $6.430 and $14.130. However, the continuous expansion to the store network speaks volumes about the company’s potential for growth. In FY19, the company delivered robust growth from new stores and is optimistic about continued growth as it carries the same strategy ahead. On the macro front, the fashion jewellery sector witnessed major trends in recent years and the company is well-positioned to deliver on the emerging trends. For instance, the company identified the increasing popularity of piercing across markets and introduced the product on its network of stores, which will contribute to business growth going forward. We have valued the stock using Price to Cash Flow based relative valuation method and arrived at a target price of lower double-digit growth (in percentage terms). Considering the above-mentioned factors, we give a “Buy” recommendation on the stock at the current market price of $10.800, down 3.312% on 02 February 2020.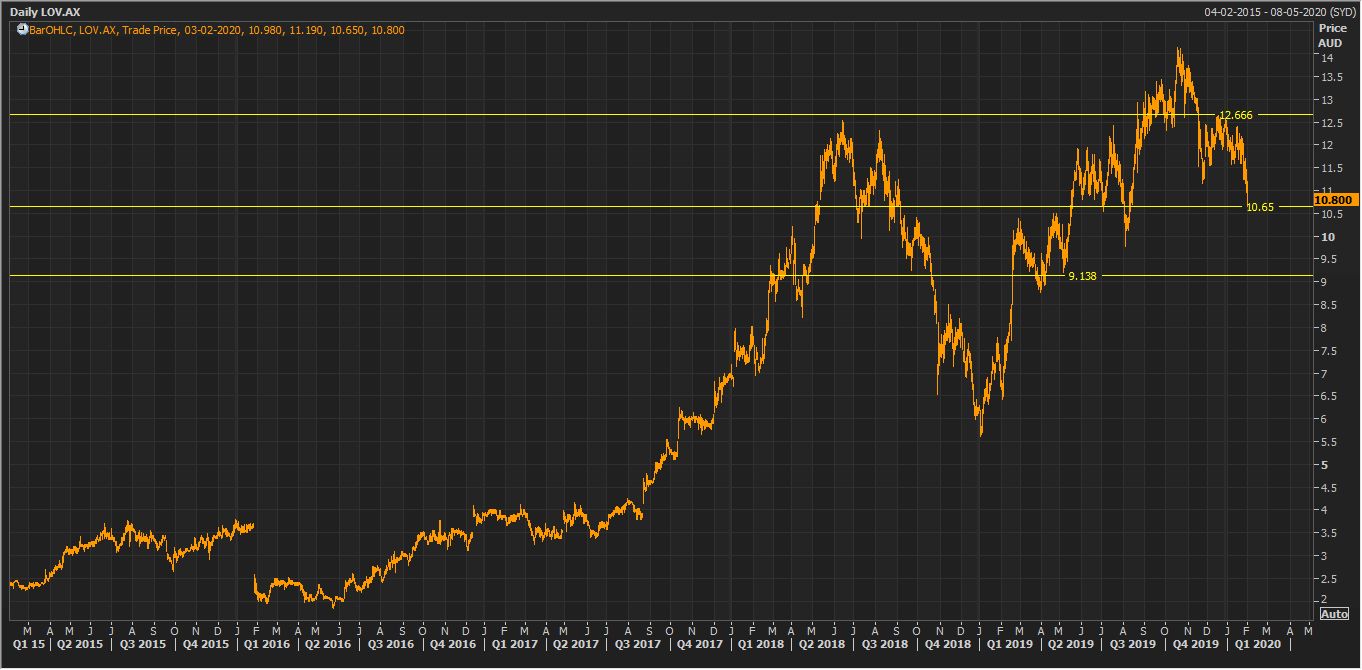
LOV Daily Technical Chart (Source: Thomson Reuters)
Disclaimer
The advice given by Kalkine Pty Ltd and provided on this website is general information only and it does not take into account your investment objectives, financial situation or needs. You should therefore consider whether the advice is appropriate to your investment objectives, financial situation and needs before acting upon it. You should seek advice from a financial adviser, stockbroker or other professional (including taxation and legal advice) as necessary before acting on any advice. Not all investments are appropriate for all people. Kalkine.com.au and associated pages are published by Kalkine Pty Ltd ABN 34 154 808 312 (Australian Financial Services License Number 425376). The information on this website has been prepared from a wide variety of sources, which Kalkine Pty Ltd, to the best of its knowledge and belief, considers accurate. You should make your own enquiries about any investments and we strongly suggest you seek advice before acting upon any recommendation. Kalkine Pty Ltd has made every effort to ensure the reliability of information contained in its newsletters and websites. All information represents our views at the date of publication and may change without notice. To the extent permitted by law, Kalkine Pty Ltd excludes all liability for any loss or damage arising from the use of this website and any information published (including any indirect or consequential loss, any data loss or data corruption). If the law prohibits this exclusion, Kalkine Pty Ltd hereby limits its liability, to the extent permitted by law to the resupply of services. There may be a product disclosure statement or other offer document for the securities and financial products we write about in Kalkine Reports. You should obtain a copy of the product disclosure statement or offer document before making any decision about whether to acquire the security or product. The link to our Terms & Conditions has been provided please go through them and also have a read of the Financial Services Guide. On the date of publishing this report (mentioned on the website), employees and/or associates of Kalkine Pty Ltd do not hold positions in any of the stocks covered on the website. These stocks can change any time and readers of the reports should not consider these stocks as personalised advice.
Past performance is not a reliable indicator of future performance.
 Please wait processing your request...