Kalkine has a fully transformed New Avatar.

Company Overview: Janus Henderson Group PLC, incorporated on August 5, 2008, is an independent global asset manager. The Company specializes in active investment across all asset classes. It operates through the investment management business segment. The Company manages a broad range of investment products for institutional and retail investors across five capabilities: Equities, Quantitative Equities, Fixed Income, Multi-Asset and Alternatives. It operates across various product lines, distribution channels and geographic regions. Its regional focus includes the United States, Europe, Asia and Australia.
.png)
JHG Details
Robust investment performance and rebounding markets helped AUM: Janus Henderson Group PLC (ASX: JHG) happens to be a leading global active asset manager which is dedicated to helping the investors to achieve the long-term financial goals. As on July 4, 2019, the market capitalisation of Janus Henderson Group PLC stood at ~US$4.24 billion. The company had earlier released its results for the first quarter ended March 31, 2019 in which it added that the net income attributable to JHG amounted to US$94.1 million as compared to US$106.8 million in the fourth quarter of 2018 and US$165.2 million in the first quarter of 2018. Coming to the management’s viewpoints, its Chief Executive Officer (or CEO) named Mr. Dick Weil had stated that the overall investment performance for the quarter was robust, but the company had witnessed pockets of underperformance which are leading to substantial net outflows. He further added that, however, the company is witnessing encouraging results in the several areas of the business, which include the momentum in the US retail channel, primarily with the US Equity strategies, ongoing growth in the Multi-Asset capability, as well as an improving environment in Continental Europe.
.png)
Investment Performance (Source: Company Reports)
With respect to dividend and share buyback, the company stated that, on 1 May 2019, it had made an announcement of the first quarter dividend with respect to the three months ended March 31, 2019 amounting to US$0.36 per share. Additionally, the company added that, as part of the US$200 million on-market buyback programme which was approved in the month of February, it had purchased around 1.3 million of the ordinary shares on the NYSE and CHESS Depositary Interests (or CDIs) on the ASX in the month of March, for the total outlay amounting to US$31 million. From the analysis standpoint, the company’s top line had witnessed a CAGR growth of 20.74% (FY 2014- FY 2018), which can be considered at respectable levels and that reflects that JHG possesses decent revenue generation capabilities. The company’s cash from operating activities have witnessed a CAGR growth of 34.91% (FY 2014- FY 2018) that implies that it is having strong operational capabilities. We expect that its revenue generation capabilities coupled with its operational capabilities might help in achieving long-term growth. At the current market price of A$31.34, the stock of the company is trading at 12.31x of FY20E EPS.
Moving forward, the company’s strong liquidity position and revenue-generation capabilities might act as tailwinds for long-term growth. Additionally, the commitment of returning the excess capital to the shareholders might help in gaining traction. By looking at long-term potential in the business along with healthy liquidity position, decent dividend distribution strategy to its shareholders and respectable revenue-generation capabilities, we have valued the stock using two Relative valuation methods, Price to Book Value and P/E multiple and arrived at a target price upside in the range of $34.7 to $36.2 (single to lower double digit upside (in %).
Top 10 Shareholders: The following table gives a broad overview of the top 10 shareholders in Janus Henderson Group PLC:
.png)
Top 10 Shareholders (Source: Thomson Reuters)
Higher Key Ratios Than Industry Median Reflects Decent Performance: Coming to JHG’s key financial ratios, the net margin of the company in 1Q FY 2019 stood at 19%, which is higher than the industry median of 17.9% and implies that the company has been effectively converting its top line into bottom line as compared to the broader industry. Also, the company’s gross margin, during the same period, stood at 98.9%, which is higher than the industry median of 75.1%.
.png)
Key Metrics (Source: Thomson Reuters)
The company’s current ratio stood at 2.74x, which is higher than the industry median of 1.63x that implies that JHG is possessing decent liquidity levels and well placed to meet its short-term obligations. The Debt/Equity ratio of JHG stood at 0.07x, which is lower than the industry median of 0.42x and, thus, it can be said that the company is having deleveraged balance sheet as compared to the broader industry.
Key Insights on JHG’s Q1 FY 2019 Results: Janus Henderson Group PLC stated that its long-term investment performance was robust and 69% and 74% of the AUM had outperformed the benchmarks on the three- and five-year basis, respectively, as of March 31, 2019. Also, the company’s AUM witnessed a rise and stood at $357.3 billion, which implies a rise of 8.8% from the year ended December 31, 2018, because of positive markets and foreign currency translation. The company’s revenue for 1Q FY 2019 amounted to $519.3 million, which reflects a decline of $68.4 million (or12%), from 1Q FY 2018. The company’s average AUM fell by 7%, which led to a decrease in the management fees during 1Q FY 2019 as compared to 1Q FY 2018. The following picture gives the broad idea of the total flows which the company has been experiencing:
.png)
Total flows (Source: Company Reports)
The company’s management fees witnessed a fall by $61.0 million (or 12%) during 1Q FY 2019 as compared to 1Q FY 2018. JHG added that net outflows, a fall in the average AUM because of unfavorable markets and unfavorable foreign currency translation had decreased the management fees by $32.0 million, $19.1 million and $11.8 million, respectively, during the 1Q FY 2019 as compared to 1Q FY 2018. There are expectations that the company’s capital structure, along with the available cash balances, cash flows generated from operations, as well as further capital and credit market activities, if necessary, might provide the company with the sufficient resources in order to meet the present and future cash needs, which includes operating and other obligations as they fall due and anticipated future requirements of the capital.
Understanding the Composition of JHG’s AUM: As mentioned earlier, AUM of Janus Henderson Group PLC stood at US$357.3 billion as at March 31, 2019. Out of this, $188.8 billion and $72.5 billion is in the equities and fixed income, respectively. However, $49.6 billion, $33.4 billion and $13 billion is in quantitative equities, multi-asset and alternatives, respectively. There are expectations that, moving forward, the company’s AUM might get influenced by the movement of the broader equity markets. Therefore, the macro-economic factors and other economic variables might play a crucial role. The company had stated that the outflows across the four capabilities got partially offset by the continued strength witnessed in the multi-asset.
.png)
Q1 FY 19 Flows By Capability (Source: Company Reports)
A Look at Recent Updates: Janus Henderson Investors made an announcement about the appointment of Suzanne Cain as Global Head of Distribution. She would be responsible for the firm’s global sales and product strategy with regards to both institutional and retail channels and would be overseeing the global marketing and lead client service throughout the firm’s business worldwide. Additionally, it was mentioned that Suzanne would be a member of the Executive Committee at Janus Henderson and would be based in Denver.
S&P Dow Jones Indices had made an announcement with regards to the changes in the S&P/ASX indices, which became effective at the open of trading on June 24, 2019. As per the release, Janus Henderson Group PLC has been removed from S&P/ASX 100 Index. In the release dated July 1, 2019, the company stated that, on June 30, 2019, Janus Henderson Group plc’s capital consisted of 191,647,272 shares with the voting rights. It was also mentioned that Janus Henderson Group plc holds nil shares in the Treasury.
Decent Annual Dividend Yield Might Attract Attention: Janus Henderson Group PLC had declared the quarterly dividend amounting to US$0.36 per share and the company had wrapped up US$31 million of the share buybacks during March. The key personnel of the company had stated that JHG happens to be financially disciplined, and it is focused towards investing in the sustainable growth and upholding the commitment to return the cash flow to shareholders. Notably, the company has returned more than US$100 million via dividends and the share buyback programme in the first quarter.
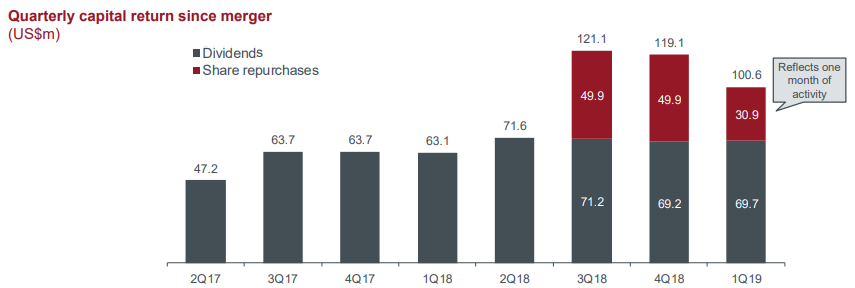
Quarterly Capital Return Since Merger (Source: Company Reports)
The company’s total cash dividends which it had paid have been increasing from the past few years (FY 2016- FY 2018) which reflects that the company is financially good and is focused towards delivering returns to the shareholders. Additionally, the company has repurchased around 1.3 million shares for the consideration of US$31 million, which had resulted in completing a portion of US$200 million buyback programme which was authorised in the month of February 2019.
What To Expect From JHG Moving Forward: As stated by Janus Henderson Group PLC in its annual report, the company does not expect the competitive pressures to abate rather the company is expecting these to become stronger moving forward. Overall, the top management of the company happens to be optimistic with regards to the outlook for the business. The company added that the outlook for the markets in 2019 looks to be varied as well as unpredictable, because of the unprecedented nature of some of the key aspects of the macroeconomic environment and the fact that both the policy and geopolitical uncertainty continue to remain at the higher levels.
Additionally, it can be said that the company’s performance moving forward might be largely dependent on the broader performance of the equity markets. Hence, the geopolitical tensions need to be reduced so that the broader equity markets momentum can stabilize. The company’s annual dividend yield, as per ASX, stood at 6.49% which is higher than the industry median of 4.4%, implying that the company has been shelling out better returns as compared to the broader industry that might attract the attention of the dividend seeking investors moving forward.
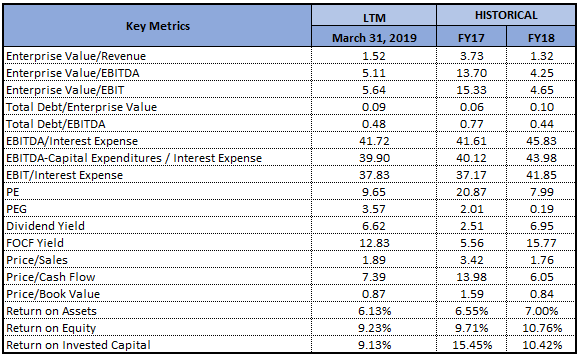
Key Valuation Metrics (Source: Thomson Reuters)
Valuation Methodologies:
Method 1: Price to Book Value Based Valuation
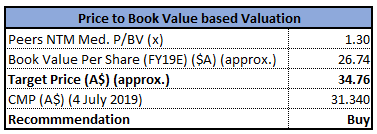
Price to Book Value Based Valuation (Source: Thomson Reuters), *NTM: Next Twelve Months
Method 2: PE- Based Valuation
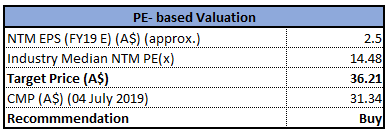
PE- Based Valuation (Source: Thomson Reuters), *NTM: Next Twelve Months
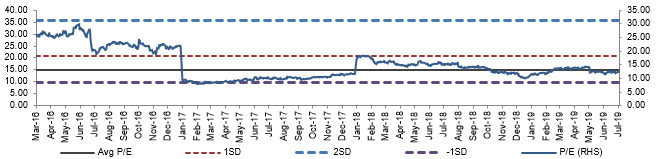
Historical PE Band (Source: Company Reports, Thomson Reuters)
Stock Recommendation: Janus Henderson Group PLC’s stock has delivered the return of 3.18% in the span of previous six months, while in the time frame of past one month, the stock has posted the return of 6.45%, which might be considered at respectable levels. Also, the company’s Board takes an active, disciplined approach when it comes to the management of its cash and capital resources. The company is the firm believer in balancing the capital needs as well as the investment opportunities of the business with the shareholder interests, without emphasising the usage of the leverage which can help it carrying the overall business objectives.
Talking about capital management, the company happens to be committed towards returning the excess capital to the shareholders which could help it in gaining traction moving forward. With respect to operating expenses, the company stated that there have been higher LTI (or Long-term incentive plans) because of the mark-to-market gains, however, it got offset by the expense management.
Considering the company’s operational capabilities, revenue generation capabilities, liquidity levels (as evident from the current ratio) and respectable annual dividend yield, we are affirmative on the stock and we expect that the company is well-placed to tap the market opportunities which might arise moving forward. By looking at long-term potential in the business along with healthy liquidity position, decent dividend distribution strategy to its shareholders and respectable revenue-generation capabilities, we have valued the stock using two Relative valuation methods, Price to Book Value and P/E multiple and arrived at a target price upside in the range of $34.7 to $36.2 (single to lower double digit upside (in %)). Hence, in the view of aforesaid parameters, we give a “Buy” recommendation to the stock at a current market price of A$31.340 per share (up 1.555% on 4 July 2019).
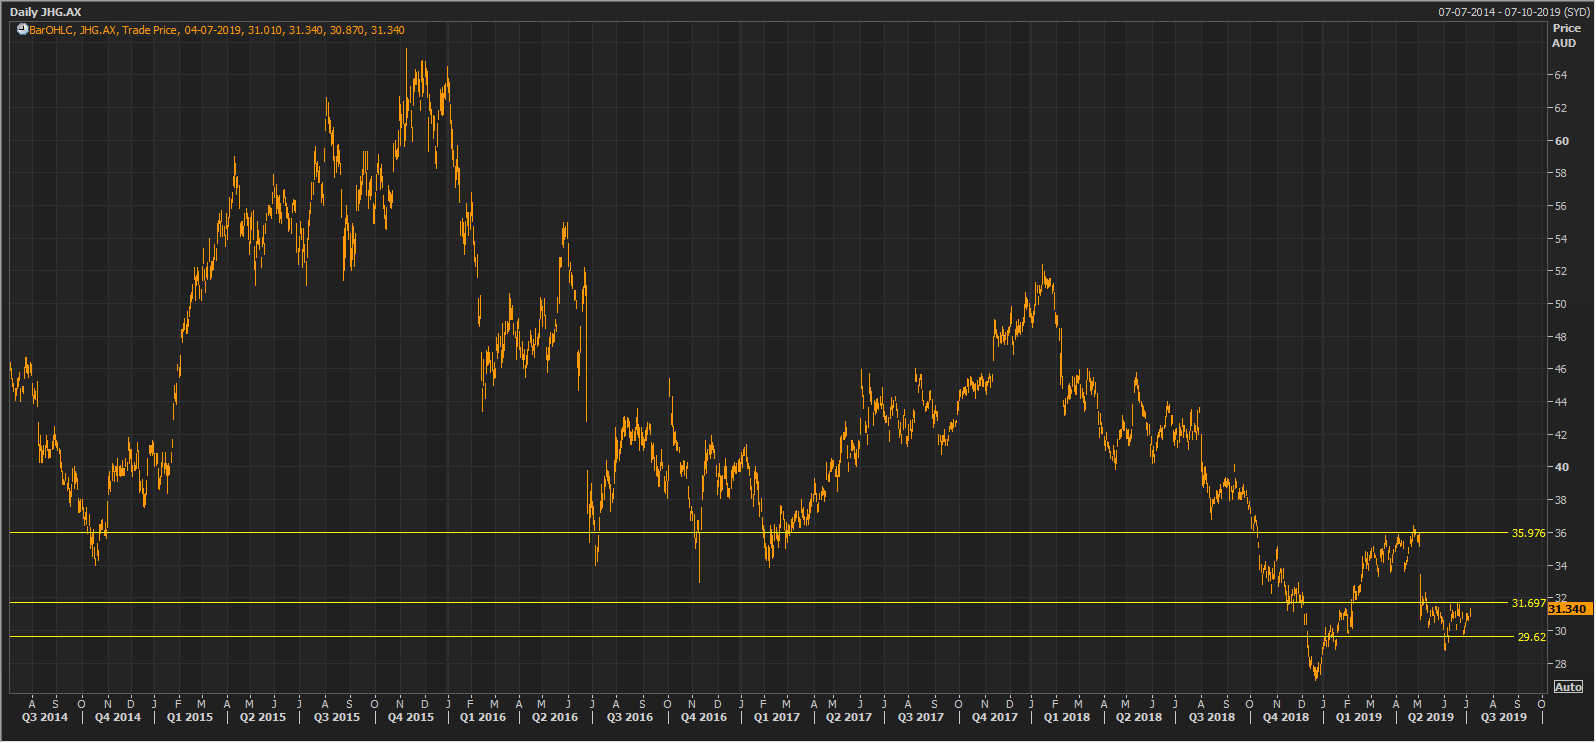
JHG Daily Chart (Source: Thomson Reuters)
Disclaimer
The advice given by Kalkine Pty Ltd and provided on this website is general information only and it does not take into account your investment objectives, financial situation or needs. You should therefore consider whether the advice is appropriate to your investment objectives, financial situation and needs before acting upon it. You should seek advice from a financial adviser, stockbroker or other professional (including taxation and legal advice) as necessary before acting on any advice. Not all investments are appropriate for all people. Kalkine.com.au and associated pages are published by Kalkine Pty Ltd ABN 34 154 808 312 (Australian Financial Services License Number 425376). The information on this website has been prepared from a wide variety of sources, which Kalkine Pty Ltd, to the best of its knowledge and belief, considers accurate. You should make your own enquiries about any investments and we strongly suggest you seek advice before acting upon any recommendation. Kalkine Pty Ltd has made every effort to ensure the reliability of information contained in its newsletters and websites. All information represents our views at the date of publication and may change without notice. To the extent permitted by law, Kalkine Pty Ltd excludes all liability for any loss or damage arising from the use of this website and any information published (including any indirect or consequential loss, any data loss or data corruption). If the law prohibits this exclusion, Kalkine Pty Ltd hereby limits its liability, to the extent permitted by law to the resupply of services. There may be a product disclosure statement or other offer document for the securities and financial products we write about in Kalkine Reports. You should obtain a copy of the product disclosure statement or offer document before making any decision about whether to acquire the security or product. The link to our Terms & Conditions has been provided please go through them and also have a read of the Financial Services Guide. On the date of publishing this report (mentioned on the website), employees and/or associates of Kalkine Pty Ltd do not hold positions in any of the stocks covered on the website. These stocks can change any time and readers of the reports should not consider these stocks as personalised advice.
 Please wait processing your request...