Company Profile – Insurance Australia Group is engaged in underwriting of general insurance and related corporate services. The company operates in five segments: Australian Direct Insurance, Australian intermediated insurance, New Zealand Insurance, Asian Insurance along with other corporate and investing activities. Insurance Australia Group (IAG) is one of the two largest domestic general insurers by gross written premium operating in Australia and New Zealand. It also has a small but growing exposure to Asia. The key general insurance markets in which IAG operates are home and contents, motor vehicle and compulsory third-party insurance, and short-tail commercial. IAG sells insurance under several brands including NRMA Insurance, CGU, SGIO, SGIC and Swann Insurance (Australia); NZI, State and AMI Insurance (New Zealand); and Safety and NZI (Thailand).
Analysis – Acquisition of Wesfarmers’ Australian and New Zealand insurance underwriting business provides strength to IAG’s already solid market position. The purchase comprises companies trading under WFI/Lumley brands and includes a 10 year personal lines distribution agreement with Coles. The purchase has been funded by a combination of ordinary equity, subordinated debt and internal funds. Based on insurance margin gaps, pre-tax net synergies are estimated at $140 Million with the bulk to be realised within two years.
The move is consistent with the company’s focus on profitable and high return growth in Australia, where key portfolios including geographic exposures and SME (
small and medium enterprise) capabilities would be significantly strengthened. The insurance margin for Wesfarmers’ Australian underwriting business is around 7%. This compares with around 11% for IAG’s Australia Intermediated (CGU) business and suggests scope for significant synergies in bridging the gap.
 Source - IAG Website
As with any acquisition there are substantial risks. Risks include the integration taking longer than expected, customer attrition, distraction for management from running the existing business, failure to realise targeted synergies and overpaying for the acquisition. IAG’s foray into the United Kingdom saw considerable share value destroyed. Recent integration experience, combined with extensive operational expertise bodes well for a successful merger.
With premium rates slowing and the reinsurance market softening, pulling costs out of an acquired commercial lines of business provides an earnings growth option for IAG. The deal also removes a major threat in the personal lines space, being Coles distribution. With Coles yet to achieve a significant market presence, there is less risk from competition concerns now rather than later in our view.
|
Price |
Price % Change |
|
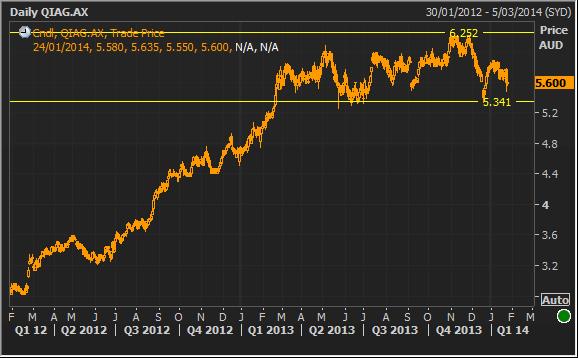
Close: |
5.60 (24-Jan-2014) |
3M: |
(5.25%) |
|
52 Wk High: |
6.25 (31-Oct-2013) |
6M: |
(5.72%) |
|
52 Wk Low: |
4.75 (29-Jan-2013) |
1Y: |
11.78% |
We believe that IAG has got great market power as part of an Australian insurance duopoly in an underinsured market. IAG is leveraged to an eventual east coast recovery with a positive Gross Written Premium (GWP) outlook and close to double digit earning per Share growth in the medium term. The current business model is really attractive in which they have de risked by de – emphasising UK in favour of high growth Asia. IAG also appeals to global players from an M&A perspective wishing to optimise their local presence.
We believe currently there is a very favourable insurance cycle with most company results surprising on the upside. IAG’s Asian operations are being valued appropriately by the market, earlier than expected. There are some really good prospects of recovery in CGU margins.
IAG derives almost all of its revenue from Australia, in 2013 the region’s sales were $8.35 billion which is equivalent to 91% of total sales. In 2013 sales in New Zealand were up at a rate that was much higher than the company as a whole. In NZ sales increased 5.2% to $1.82 billion. Although the company’s overall sales increased, sales were not up in all regions. In Australia sales were down by 0.8% and sales were down in Asia as well.
Last year stock has performed amazingly well, going up nearly 23%. During the 12 months ending 30/06/2013, Insurance Australia Group paid dividends totalling $0.36 per share. Since the stock is currently trading at $5.69 this implies a dividend yield of 6.61%. IAG has paid dividend for 6 straight years. IAG has increased its dividend during each of the past 4 fiscal years. During the 12 months ending 30/06/2013 the company paid 72% of its earnings as dividends.
|
Dividend |
|
|
|
Yield |
6.617647 |
FY |
|
|
4.781705 |
5yr Av |
|
Payout Ratio |
72.248354 |
FY |
|
|
91.102698 |
5yr Av |
|
IAG (AUD, Millions) |
2013 |
2012 |
2011 |
2010 |
2009 |
|
Total Premiums Earned |
8,493.0 |
7,510.0 |
7,502.0 |
7,225.0 |
7,663.0 |
|
Total Revenue |
8,783.0 |
8,444.0 |
8,010.0 |
7,799.0 |
8,458.0 |
|
Total Operating Expense |
7,190.0 |
7,681.0 |
7,396.0 |
7,397.0 |
8,146.0 |
|
Net Income After Taxes |
1,169.0 |
586.0 |
338.0 |
190.0 |
247.0 |
IAG is an insurer which is achieving one of the highest margins in the insurance business globally due to its strong presence in Australian and New Zealand personal lines operations, strong operational improvements in its intermediated lines and an expanding position in Asia. There are several downside risks that threaten the IAG business namely the slowdown of the insurance cycle, adverse catastrophe trends and reforms being introduced to the NSW CTP.
The biggest strength that IAG has is general insurance scale and iconic brands along with capital efficiency. There are opportunities for them by creating efficiency gains to underpin growth in the core Australasian markets. Opportunities are abundant in high growth Asian guaranteed insurance markets.
Some of the key ratios mentioned below also look very favourable for IAG:-
|
|
Industry Median |
2013 |
2012 |
2011 |
2010 |
2009 |
|
Insurance Metrics |
|
|
|
|
|
|
|
Loss Ratio |
61.8% |
59.9% |
73.8% |
70.3% |
71.8% |
74.2% |
|
Premiums Earned - Chg % |
6.8% |
13.1% |
0.1% |
3.8% |
(5.7%) |
(2.4%) |
|
Earning Power |
|
|
|
|
|
|
|
Pretax ROA |
1.3% |
6.4% |
3.2% |
2.8% |
2.0% |
1.6% |
|
Pretax ROE |
13.9% |
34.9% |
17.4% |
13.8% |
8.8% |
7.0% |
|
Leverage |
|
|
|
|
|
|
|
Assets/Equity |
8.59 |
5.19 |
5.79 |
5.21 |
4.56 |
4.14 |
|
Debt/Equity |
0.42 |
0.34 |
0.38 |
0.31 |
0.32 |
0.23 |
Our longer-term forecasts include lower claims assumptions and improved operating efficiencies. We will be including IAG as a buy recommendation in Kalkine Portfolio at the closing price of $5.60.
Disclaimer
Kalkine provides general advice on securities. Kalkine does not provide advice that takes into account your, or anybody else’s investment objectives, financial situation or needs. We strongly suggest that you should make your own enquiries about any investments and we strongly suggest you seek advice before acting upon any recommendation. Kalkine Pty Ltd has made every effort to ensure the reliability of information contained in its newsletters and websites. All information represents our views at the date of publication and may change without notice. Employees and/or associates of Kalkine Pty Ltd may hold one or more of the stocks reviewed on this website. On the date of publishing this report (mentioned on the website), employees and/or associates of Kalkine Pty Ltd currently hold positions in: BHP, BKY, KCN, PDN, and RIO. These stocks can change any time and readers of the reports should not consider these stocks as advice or recommendations.
Copyright
Copyright © 2014 Kalkine Pty Ltd ABN 34 154 808 312. No part of this website, or its content, may be reproduced in any form without the prior consent of Kalkine Pty Ltd.
Kalkine is a trading name of Kalkine Pty Ltd ABN 34 154 808 312, which holds Australian Financial Services Licence No. 425376.
Past performance is not a reliable indicator of future performance.

 Please wait processing your request...