Kalkine has a fully transformed New Avatar.
International Business Machines Corporation
Section 1: Company Fundamentals
1.1 Company Overview and Performance summary
Company Overview:
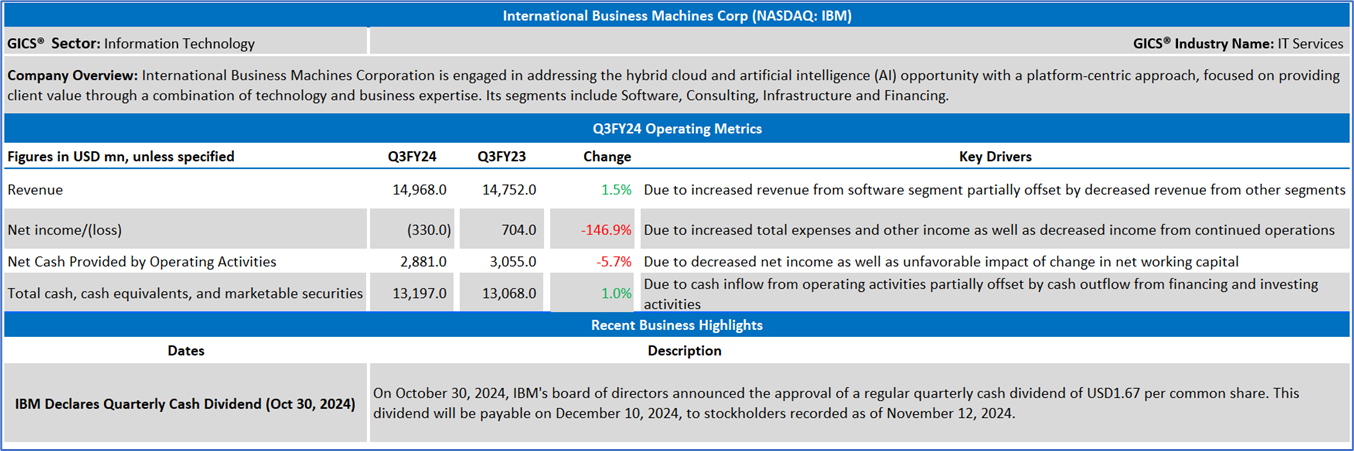
International Business Machines Corporation (NYSE: IBM) is engaged in addressing the hybrid cloud and artificial intelligence (AI) opportunity with a platform-centric approach, focused on providing client value through a combination of technology and business expertise. Its segments include Software, Consulting, Infrastructure and Financing.
This Global AI and Emerging Market Report covers the Company Overview & Price performance, Summary table, Key positives & negatives, Key metrics, Company details, technical guidance & Stock recommendation, and Price chart.
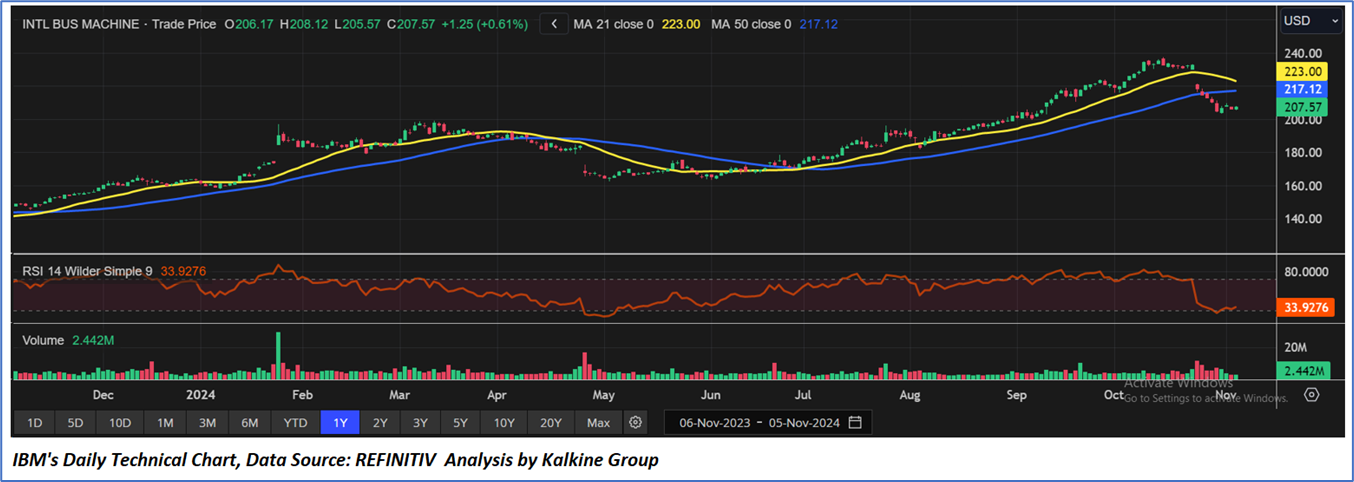
Price Performance:
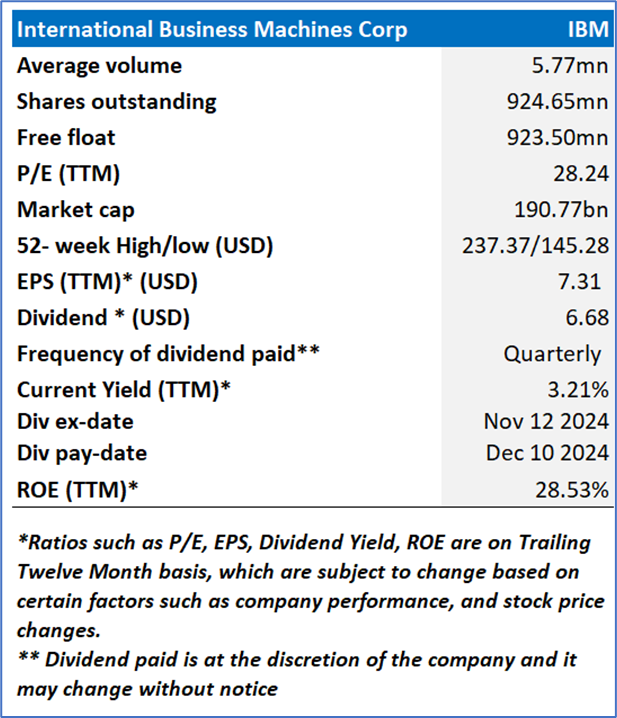
1.2 Summary Table
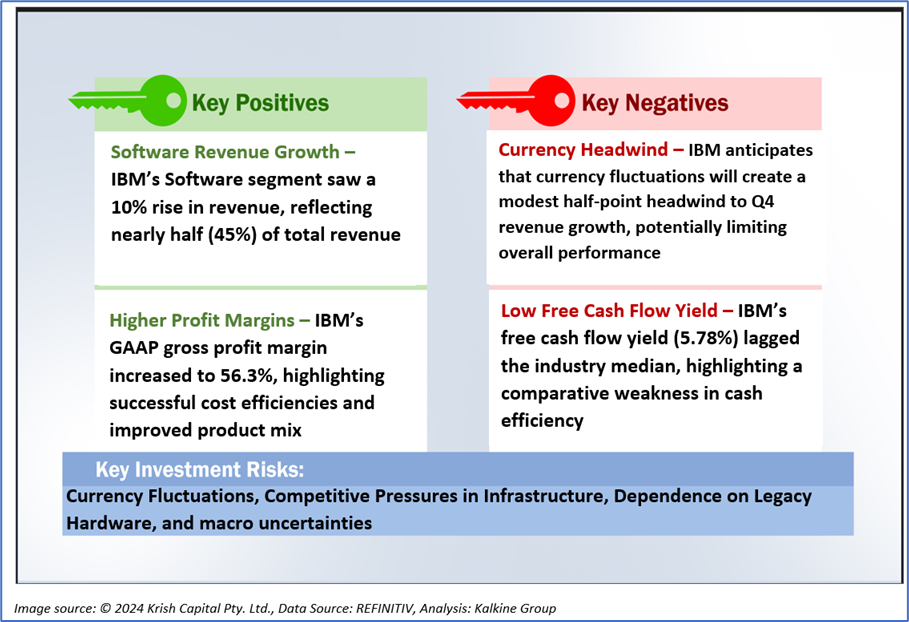
1.3 The Key Positives & Negatives
1.4 Key Metrics
IBM's financial performance, compared to the industry median, demonstrates strengths in several key areas, including a higher gross profit margin of 54.32% versus the median of 52.68%, and a superior EBITDA margin of 21.00% compared to 19.80%. Its operating margin stands slightly above the industry median at 12.53%, compared to 12.39%. However, IBM lags behind in free cash flow yield, reporting 5.78% versus the industry median of 8.86%, and also shows a lower return on average common equity of 28.63% compared to 32.28% for the industry.

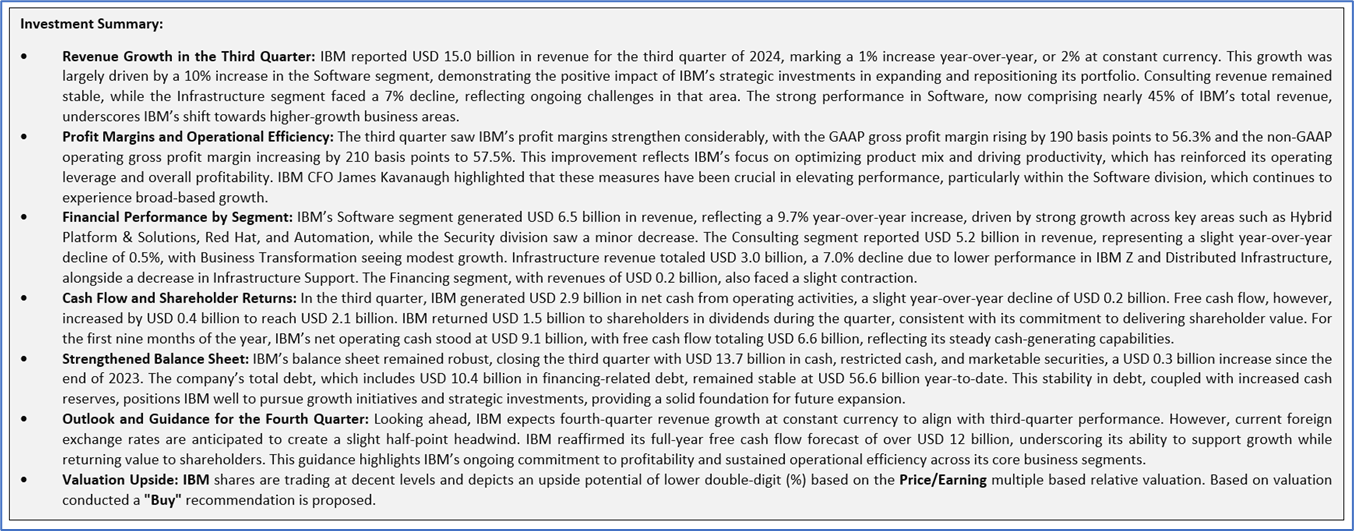
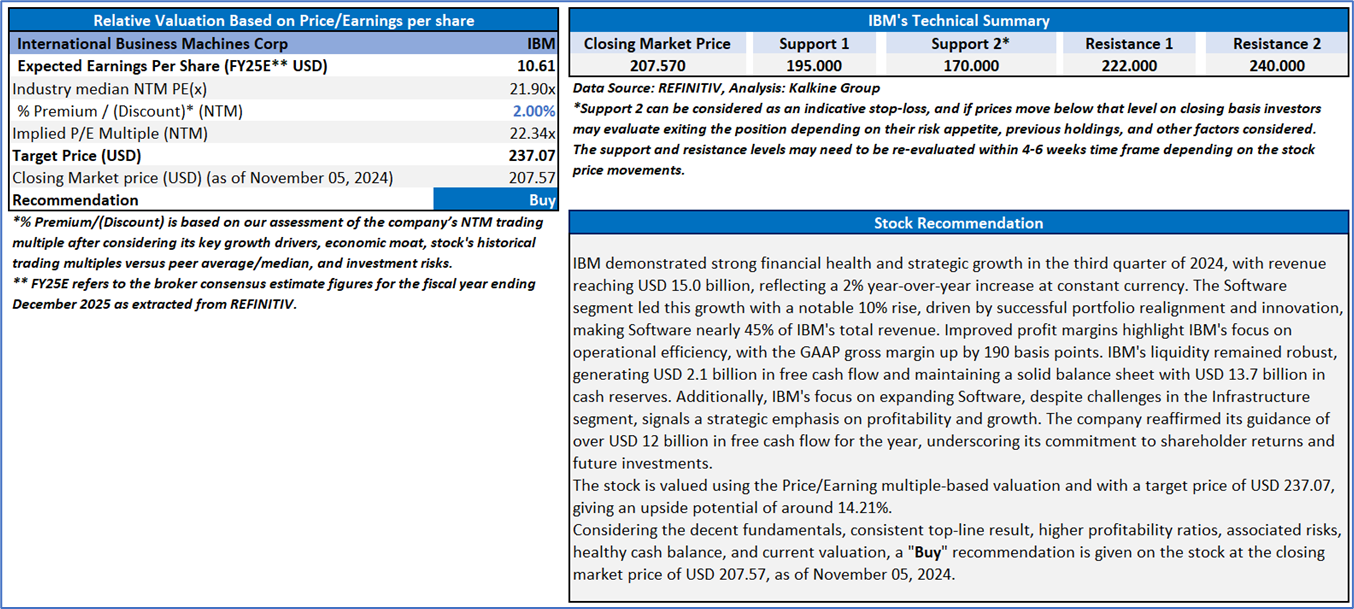
Section 2: International Business Machines Corporation (NYSE: IBM) (“Buy” at the closing market price of USD 207.57, as of November 05, 2024)
2.1 Company Details
2.2 Technical Guidance and Stock Recommendation
QuantumScape Corporation (NYSE: QS)
Section 1: Company Fundamentals
1.1 Company Overview and Performance summary
Company Overview:
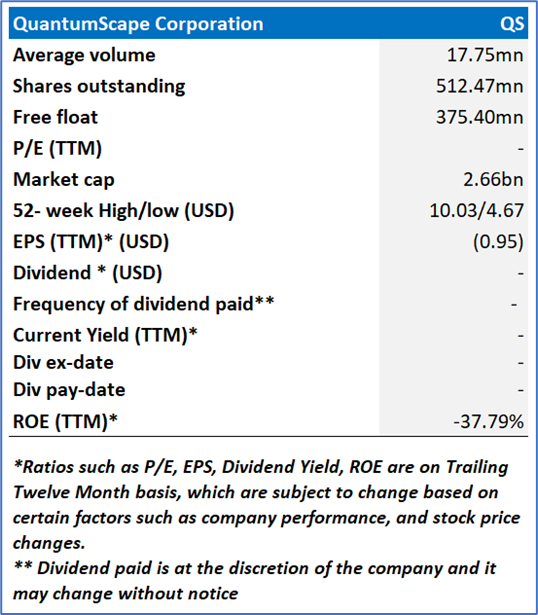
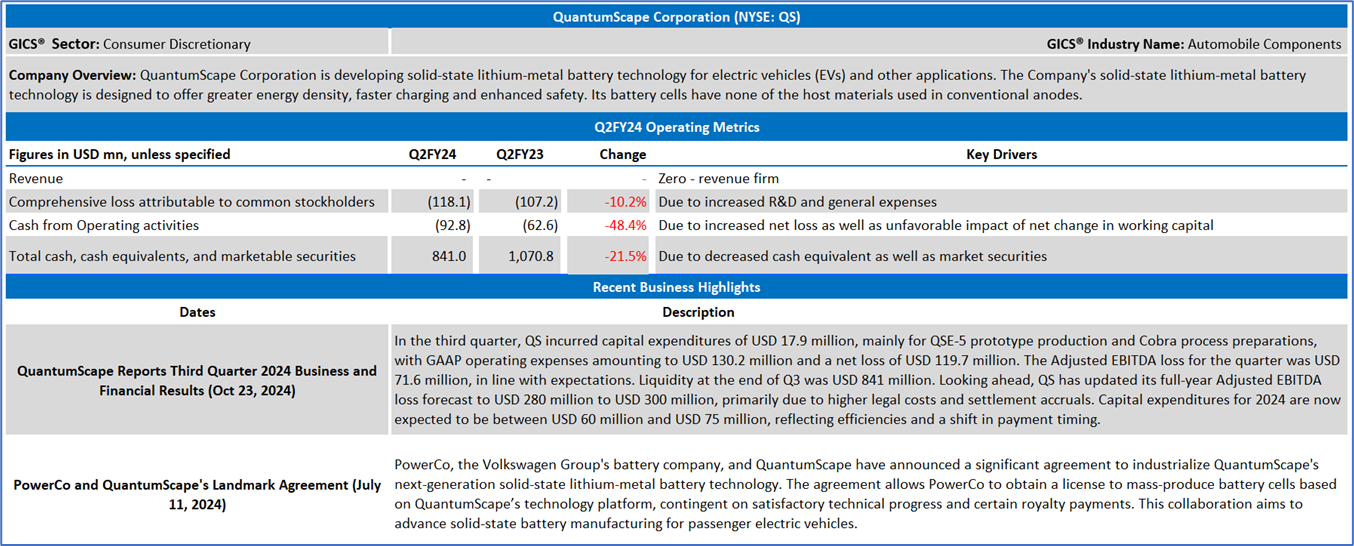
QuantumScape Corporation (NYSE: QS) is developing solid-state lithium-metal battery technology for electric vehicles (EVs) and other applications. The Company's solid-state lithium-metal battery technology is designed to offer greater energy density, faster charging and enhanced safety. Its battery cells have none of the host materials used in conventional anodes.
This Global AI and Emerging Market Report covers the Company Overview & Price performance, Summary table, Key positives & negatives, Key metrics, Company details, technical guidance & Stock recommendation, and Price chart.
Price Performance:
1.2 Summary Table
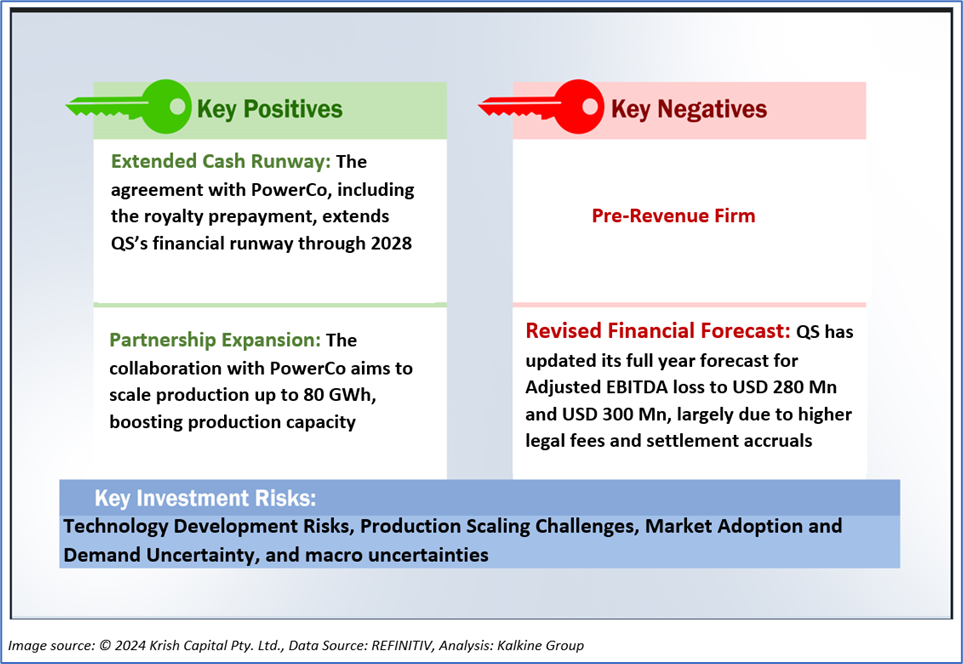
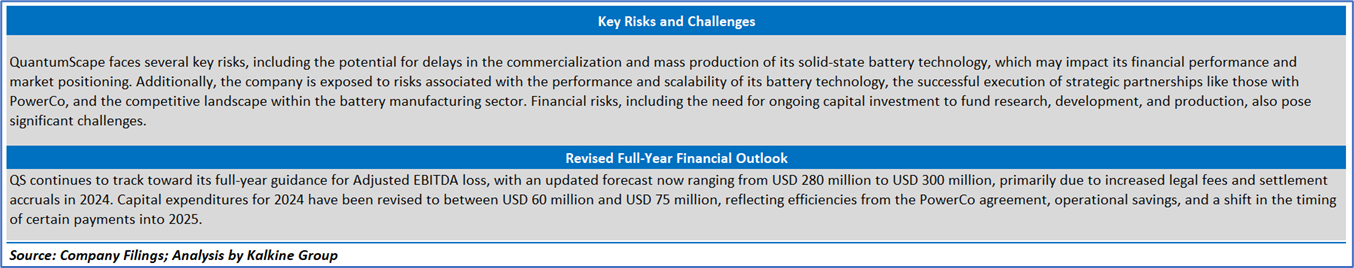
1.3 The Key Positives & Negatives
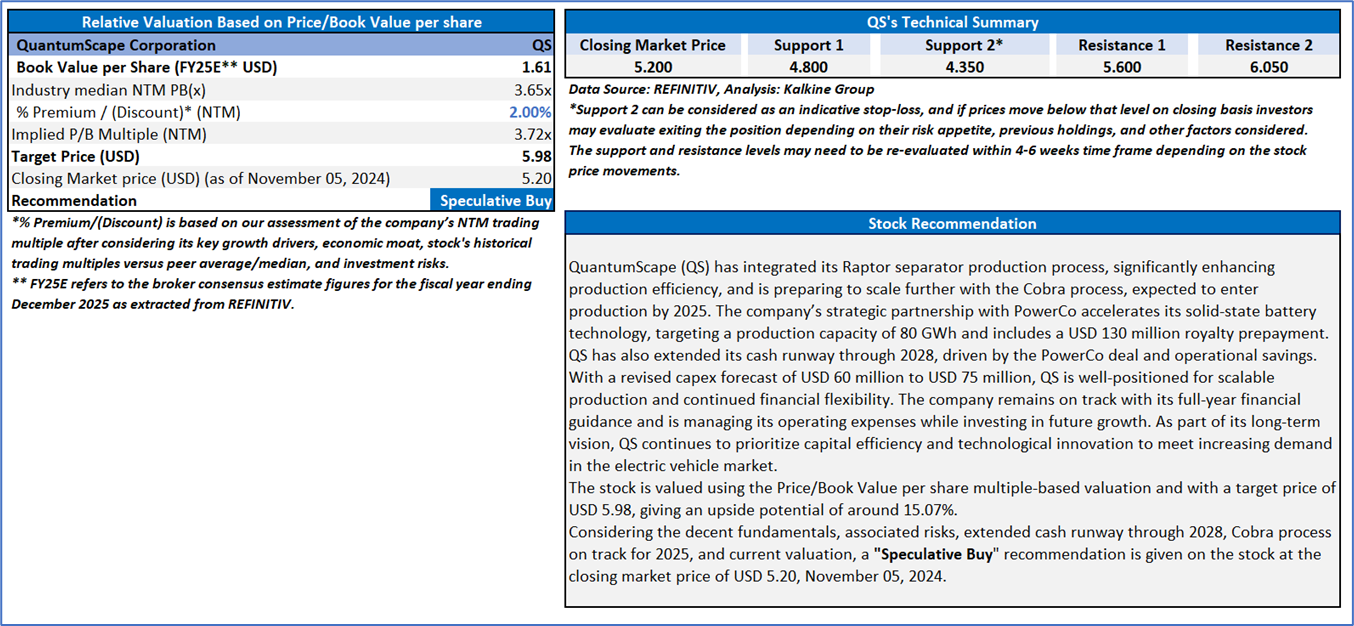
Section 2: QuantumScape Corporation (NYSE: QS) (“Speculative Buy” at the closing market price of USD 5.20, November 05, 2024)
2.1 Company Details
2.2 Technical Guidance and Stock Recommendation

Markets are trading in a highly volatile zone currently due to certain macroeconomic issues and geopolitical tensions prevailing. Therefore, it is prudent to follow a cautious approach while investing.
Note 1: Past performance is not a reliable indicator of future performance.
Note 2: The reference date for all price data, currency, technical indicators, support, and resistance levels is September 04, 2024. The reference data in this report has been partly sourced from REFINITIV.
Note 3: Investment decisions should be made depending on an individual's appetite for upside potential, risks, holding duration, and any previous holdings. An 'Exit' from the stock can be considered if the Target Price mentioned as per the Valuation and or the technical levels provided has been achieved and is subject to the factors discussed above.
Note 4: The report publishing date is as per the Pacific Time Zone.
Technical Indicators Defined: -
Support: A level at which the stock prices tend to find support if they are falling, and a downtrend may take a pause backed by demand or buying interest. Support 1 refers to the nearby support level for the stock and if the price breaches the level, then Support 2 may act as the crucial support level for the stock.
Resistance: A level at which the stocks prices tend to find resistance when they are rising, and an uptrend may take a pause due to profit booking or selling interest. Resistance 1 refers to the nearby resistance level for the stock and if the price surpasses the level, then Resistance 2 may act as the crucial resistance level for the stock.
Stop-loss: It is a level to protect against further losses in case of unfavorable movement in the stock prices.
This report has been issued by Kalkine Pty Limited (ABN 34 154 808 312) (Australian financial services licence number 425376) (“Kalkine”) and prepared by Kalkine and its related bodies corporate authorised to provide general financial product advice. Kalkine.com.au and associated pages are published by Kalkine.
Any advice provided in this report is general advice only and does not take into account your objectives, financial situation or needs. You should therefore consider whether the advice is appropriate to your objectives, financial situation and needs before acting upon it.
There may be a Product Disclosure Statement, Information Statement or other offer document for the securities or other financial products referred to in Kalkine reports. You should obtain a copy of the relevant Product Disclosure Statement, Information Statement or offer document and consider the statement or document before making any decision about whether to acquire the security or product.
Choosing an investment is an important decision. If you do not feel confident making a decision based on the recommendations Kalkine has made in our reports, you should consider seeking advice from a financial adviser, stockbroker or other professional (including taxation and legal advice) before acting on any advice in this report or on the Kalkine website. Not all investments are appropriate for all people.
The information in this report and on the Kalkine website has been prepared from a wide variety of sources, which Kalkine, to the best of its knowledge and belief, considers accurate. Kalkine has made every effort to ensure the reliability of information contained in its reports, newsletters and websites. All information represents our views at the date of publication and may change without notice. The information in this report does not constitute an offer to sell securities or other financial products or a solicitation of an offer to buy securities or other financial products. Our reports contain general recommendations to invest in securities and other financial products.
Kalkine is not responsible for, and does not guarantee, the performance of the investments mentioned in this report This report may contain information on past performance of particular investments. Past performance is not an indicator of future performance. Hypothetical returns may not reflect actual performance. Any displays of potential investment opportunities are for sample purposes only and may not actually be available to investors. To the extent permitted by law, Kalkine excludes all liability for any loss or damage arising from the use of this report, the Kalkine website and any information published on the Kalkine website (including any indirect or consequential loss, any data loss or data corruption). If the law prohibits this exclusion, Kalkine hereby limits its liability, to the extent permitted by law, to the resupply of services..
Please also read our Terms & Conditions and Financial Services Guide for further information. Employees and/or associates of Kalkine and its related entities may hold interests in the securities or other financial products covered in this report or on the Kalkine website. Any such employees and associates are required to comply with certain safeguards, procedures and disclosures as required by law.
Kalkine Media Pty Ltd, an affiliate of Kalkine Pty Ltd, may have received, or be entitled to receive, financial consideration in connection with providing information about certain entity(s) covered on its website including entities covered in this Report.
 Please wait processing your request...