
Company Overview: HEICO Corporation manufactures Federal Aviation Administration (FAA)-approved jet engine and aircraft component replacement parts, other than the original equipment manufacturers (OEMs) and their subcontractors. The Company also manufactures various types of electronic equipment for the aviation, medical, telecommunications and electronics industries. It operates through two segments: Flight Support Group (FSG) and Electronic Technologies Group (ETG). The FSG segment consists of HEICO Aerospace Holdings Corp. and HEICO Flight Support Corp. and their collective subsidiaries. The FSG segment designs and manufactures jet engine and aircraft component replacement parts. The ETG segment consists of HEICO Electronic Technologies Corp. and its subsidiaries. The ETG segment designs and produces mission-critical subcomponents for various markets, which are utilized in larger systems, including targeting, tracking, identification, testing, communications, telecom and computer systems.
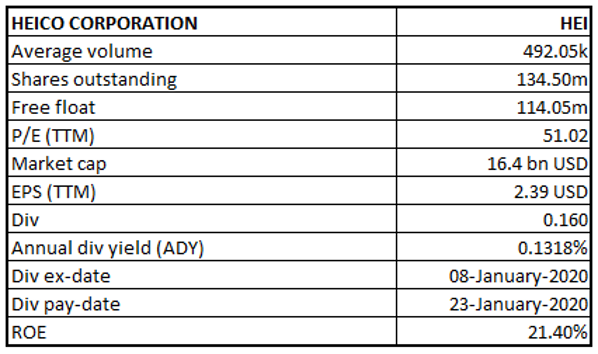
HEI Details
Product Innovation to Drive Growth Across the Segments: Heico Corporation (NYSE: HEI) is the world’s largest manufacturer of jet engine and aircraft component replacement parts approved by Federal Aviation Administration (“FAA”), apart from the original equipment manufacturers (“OEMs”) and their subcontractors. The company is a leading manufacturer of several types of electronic equipment used for the aviation, defense, space, medical, telecommunications and electronics industries. The business consists of two operating segments, namely The Flight Support Group and The Electronic Technologies Group. The company operates across 110 countries and derived ~36% of the total revenue from foreign customers in FY19. Over a period of time, the company has seen consistent growth with diversification in products, services and customers avoiding concentration risks while maintaining a strong balance sheet with maximum flexibility.
Acquisitions strategy has been an important element for the growth over the past twenty-nine years, which has resulted in the organic growth of the business. Since 1990, the company successfully acquired 77 acquisitions across the niche segments within the aviation, defense, space, medical, telecommunications and electronics industries segments. The company primarily looks for acquisition opportunities, which are likely to broaden the product offerings, services and technologies and would help in the expansion of the customer base and geographic presence.
Looking at the performance trend over the years, the business has emphasized on generating strong cash flow and high margins through offering customer centric products and higher market penetration. Top-line increased to $2.06 billion in 2019 from $26 million in 1990 while operating income grew to $457.1 million from $2 million in 1990. Over the period of FY15-FY19, HEI delivered a CAGR of ~14.7% in top-line while bottom-line posted a CAGR of 26.5%.
Going forward, the company will continue its commitments to develop new products and services, emphasizing increased market penetration, and will look for an aggressive acquisition approach while retaining the financial depth and flexibility. The business anticipates that revenue from the foreign clients is likely to contribute a significant portion of the total revenues in the anticipated future. 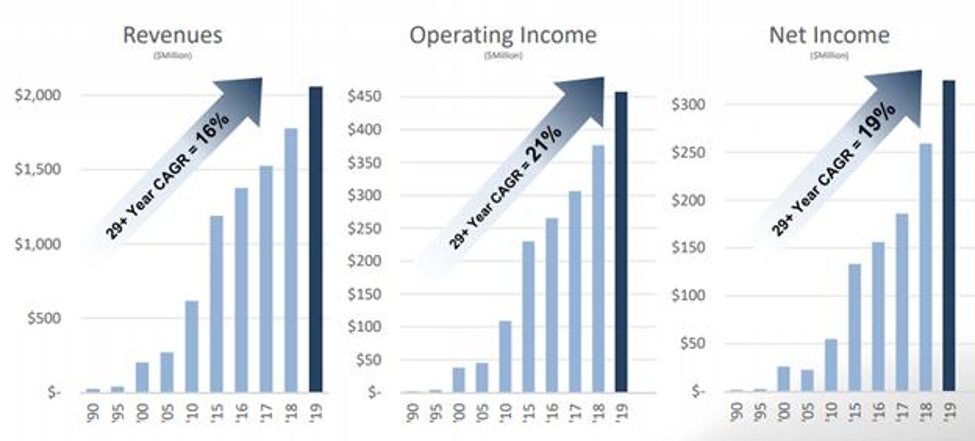
Historical Growth (Source: Company Reports)
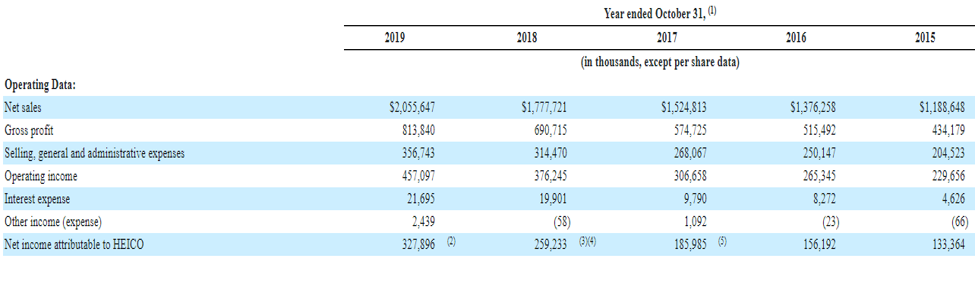
FY15-FY19 Key Financial Highlights (Source: Company Reports)
Revenue Recognition: The products are sold to a broad customer base comprising of domestic and foreign commercial and cargo airlines, repair and overhaul facilities, other aftermarket suppliers of aircraft engine and airframe materials. The business also supplies to the OEMs, domestic and foreign military units, electronic manufacturing services companies, manufacturers for the defense industry as well as medical, telecommunications, scientific, and industrial companies. As reported by the company, none of the clients comprised more than 10% of the total Group’s revenue during the last three fiscal years. During FY19, the company reported ~20% of the revenue has been generated by the top five clients.
Operating Segments:
The Flight Support Group (FSG): Within this operating segment, the company applies its proprietary expertise to construct and assemble jet engine and aircraft component replacement parts for sale at lower prices than those manufactured by OEMs. Apart from this, HEI repairs, renovates and dispenses jet engine and aircraft components, avionics and instruments for domestic and foreign commercial air carriers. The business also manufactures thermal insulation products, complex composite assemblies, and other component parts which are primarily used for aerospace, defense, industrial and commercial appliances. During FY19, the business derived approximately 60% of the total revenue from this segment.
The Electronic Technologies Group (ETG): The company constructs, manufactures and markets various types of electronic data and microwave, and electro-optical products. The segment also manufactures products like infrared simulation and test equipment, laser rangefinder receivers, electrical power supplies, back-up power supplies, power conversion products, underwater locator beacons, emergency locator transmission beacons, electromagnetic and radio frequency interference shielding, high power capacitor. The segment derived 40% of the total revenue during FY19. 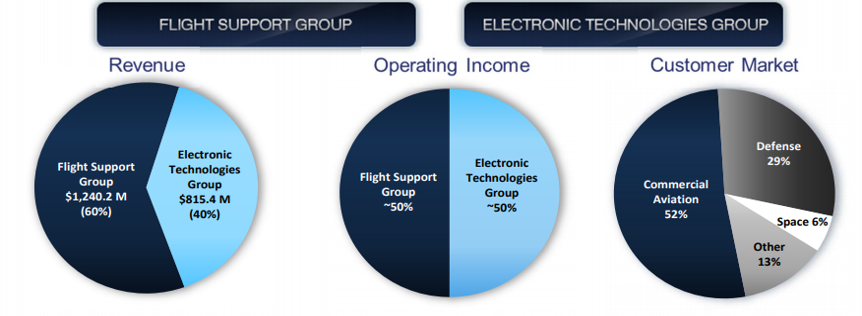
FY19 Segment Highlights (Source: Company Reports)
FY19 Operational Highlights for the Period ended 31 October 2019: HEI announced its full-year results, wherein the company reported net sales at $2,055.6 million, up 16% on y-o-y basis, driven by organic growth in both the segments from increased demand for the defense and aerospace products and growth across new product offerings within the aftermarket replacement parts. The company reported an increase in its gross margin at 39.6% in FY19, increased from 38.9% in FY18, depicting a 0.9% and 0.4% improvement from the ETG's and FSG's gross margins, respectively. Improvement in the margin was attributable to the favorable product-mix for certain defense products and improved net sales from the aftermarket replacement parts product line. Selling, general and administrative (SG&A) expenses stood at $356.7 million as compared to $314.5 million in the previous financial year due to the inclusion of $21.6 million acquisition costs, high performance-based compensation expense of $9.1 million and $3.8 million attributable to changes in the estimated fair value of accrued contingent consideration. The company reported EBITDA at $543.0 million, up 20% from FY18 while cash flow provided by operating activities increased 33% to $437.4 million in FY19, up from $328.5 million in FY18. Net income from consolidated operation came in at $359.741 million as compared to $285.686 million in the previous financial year.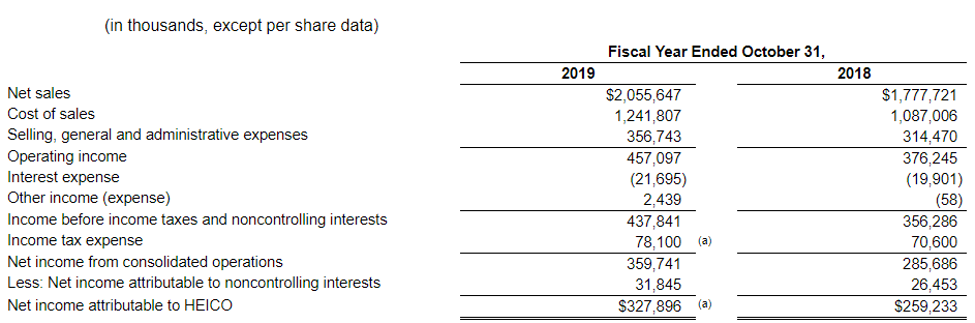
FY19 Income Statement Highlights (Source: Company Reports)
FY19 Segment-Wise Performance:
Flight Support Group: Net sales from the Flight Support Group segment increased 13% at $1,240.2 million in FY19, up from $1,097.9 million in FY18, aided by strong organic growth and higher demand from product offerings across all the product lines. Operating income came in at $242 million in FY19, witnessing a growth of 17% on y-o-y basis, driven by an improved gross profit margin, primarily attributable to improved net sales from the aftermarket replacement segment and operational efficiencies realized from the net sales growth. Operating margin improved to 19.5% from 18.8% in FY18 on account of higher gross profit margin.
Electronic Technologies Group: Top-line from the segment reported a growth of 19% to $834.5 million in FY19, primarily on account of improved demand for certain aerospace and defense products and the impact of the latest acquisition in FY19. The quarter was marked by a robust growth of 20% in the operating income at $245.7 million, increased from $204.5 million in the previous corresponding period due to higher net sales and a more favorable product mix for certain defense products and effectiveness realized from the net sales growth, partially offset by higher performance-based compensation expense and acquisition-related expenses.
Top 10 Shareholders: The top 10 shareholders have been highlighted in the table, which together forms around 45.84% of the total shareholding. Wertheim (Herbert Alvin) and Mendelson (Laurans A) hold the maximum interests in the company at 10.07% and 7.52%, respectively.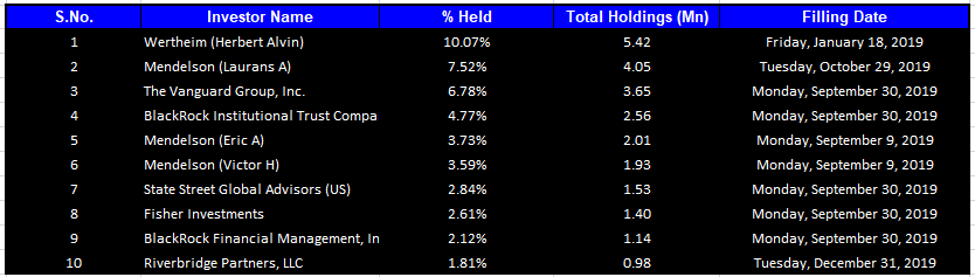
Top 10 Shareholders (Source: Thomson Reuters)
Key Metrics: The Company reported strong numbers in FY19, wherein HEI reported gross margin at 39.6%% as compared to 38.9% in FY18. The EBITDA margin, during FY19, came in at 26.3%, higher than the industry median of 14.7% and 25.5% in FY18. Operating margin during FY19 came in at 22.2%, improved from 21.2% in FY18 and higher than the industry median of 11.5%. Debt to equity during the year stood at 0.34, improved from 0.38 in the previous financial year. FY19 ROE stood at 21.4%, higher than the industry median of 15%.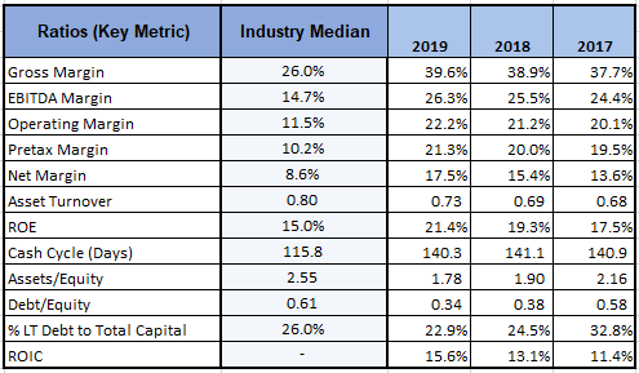
Key Metrics (Source: Thomson Reuters)
Key Risks: With 36% of consolidated net sales coming from foreign customers in FY19, the company expects this momentum to be continued in the foreseeable future. Therefore, doing the business internationally, exposes it to various risks. The challenges associated with the business are fluctuations in currency exchange rates, uncertain political environment, changes in regulatory, and economic environments. The business might be looking for its ability to obtain necessary export approvals from respective governing bodies. The business also foresees the risks regarding the challenges and restrictions associated with the availability of funding credit or guarantees. Imposition of taxes, export controls, tariffs, bans and other trade restrictions are the other factors which the business might face during the coming years. Compliance with an array of global laws, as well as U.S. laws affecting the activities of the U.S might also affect the business prospects.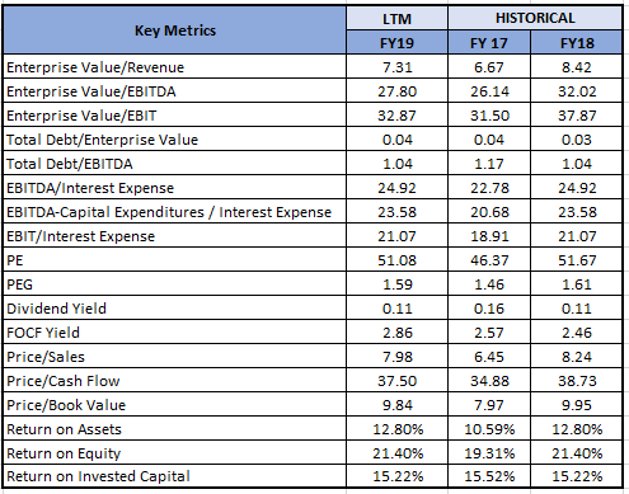
Key Valuation Metrics (Source: Thomson Reuters)
Guidance: As per the FY20 guidance, the Management expects 6% to 8% growth in net sales from FY19 while growth in net income is anticipated at 13% to 14% from FY19. Operating margins are expected between ~21.5% to ~22%. Depreciation for FY20 is estimated at ~$89 million. The company expects cash flow from operations at $475 million. Capital expenditure for FY20 is expected to come in at ~$42 million.
Valuation Methodology: Enterprise Value to EBITDA Multiple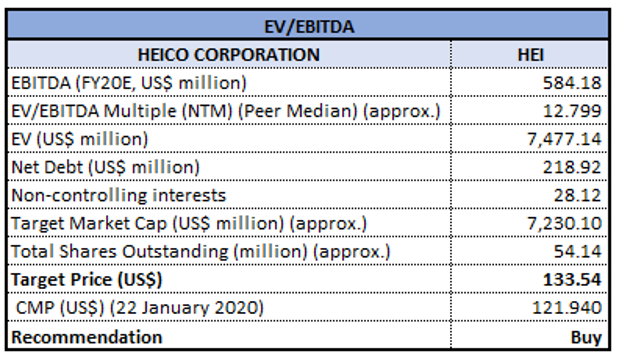
EV/EBITDA Based Valuation (Source: Thomson Reuters)
Note: All forecasted figures and peers have been taken from Thomson Reuters, NTM-Next Twelve Months
Stock Recommendation: The stock of HEI closed at $121.94 with a market capitalization of $16.40 billion. The stock is currently quoting at the upper band of its 52-week trading range of $77.62 - $147.93. The stock has generated mixed returns of 3.0331% and -12.23% in the last three months and six months, respectively. In FY19, HEI reported a robust annual growth in its top-line and operating income driven by record net sales from both the operating segments, primarily driven by double-digit organic net sales growth in the Flight Support Group and mid-single-digit organic net sales growth in the Electronic Technologies Group. The business also witnessed an excellent operating performance from the acquisitions done in FY19. Considering the aforesaid facts, we have valued the stock using one relative valuation methods, i.e., EV/EBITDA multiple. For the matter, we have taken the peer group - Boeing Co (NASDAQ: BA), United Technologies Corp (NASDAQ: UTX), General Electric Co (NASDAQ: GE), etc., and arrived at a target price of lower double-digit (in % terms). Hence, we recommend a “Buy” rating on the stock at the closing price of $121.94, down 1.49% as on 22 January 2020.
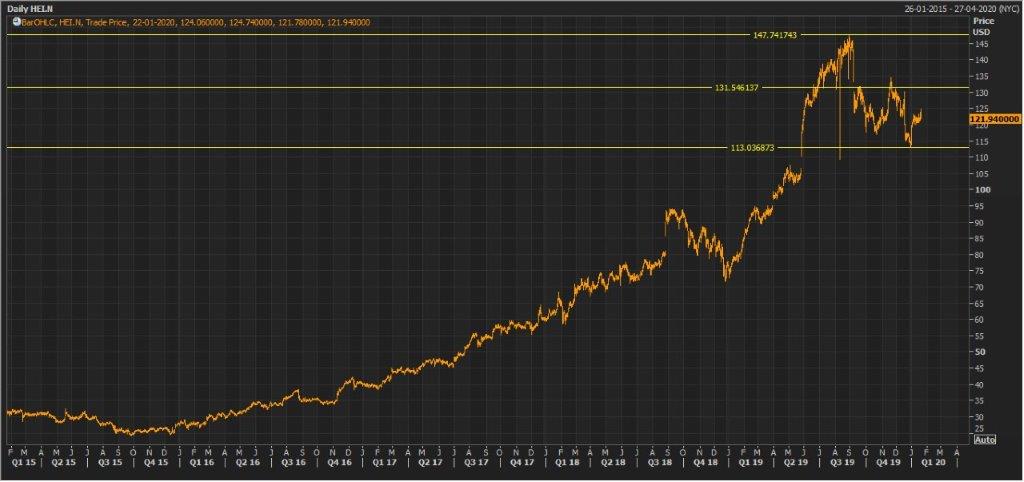
HEI Daily Technical Chart (Source: Thomson Reuters)
Disclaimer
The advice given by Kalkine Pty Ltd and provided on this website is general information only and it does not take into account your investment objectives, financial situation or needs. You should therefore consider whether the advice is appropriate to your investment objectives, financial situation and needs before acting upon it. You should seek advice from a financial adviser, stockbroker or other professional (including taxation and legal advice) as necessary before acting on any advice. Not all investments are appropriate for all people. Kalkine.com.au and associated pages are published by Kalkine Pty Ltd ABN 34 154 808 312 (Australian Financial Services License Number 425376). The information on this website has been prepared from a wide variety of sources, which Kalkine Pty Ltd, to the best of its knowledge and belief, considers accurate. You should make your own enquiries about any investments and we strongly suggest you seek advice before acting upon any recommendation. Kalkine Pty Ltd has made every effort to ensure the reliability of information contained in its newsletters and websites. All information represents our views at the date of publication and may change without notice. To the extent permitted by law, Kalkine Pty Ltd excludes all liability for any loss or damage arising from the use of this website and any information published (including any indirect or consequential loss, any data loss or data corruption). If the law prohibits this exclusion, Kalkine Pty Ltd hereby limits its liability, to the extent permitted by law to the resupply of services. There may be a product disclosure statement or other offer document for the securities and financial products we write about in Kalkine Reports. You should obtain a copy of the product disclosure statement or offer document before making any decision about whether to acquire the security or product. The link to our Terms & Conditions has been provided please go through them and also have a read of the Financial Services Guide. On the date of publishing this report (mentioned on the website), employees and/or associates of Kalkine Pty Ltd do not hold positions in any of the stocks covered on the website. These stocks can change any time and readers of the reports should not consider these stocks as personalised advice.
Past performance is not a reliable indicator of future performance.
 Please wait processing your request...