Sector Landscape and Outlook
While diversification of equity portfolio is something that investors typically eye for, one space that has always remained attractive and stood the test of time through time immemorial is the safe-haven asset, GOLD. Yellow metal is considered a safe bet in the international market due to its ability to provide a hedge against systematic risks and non-systematic risks. Gold tends to perform better at the time of global uncertainties, and performs well when an economy thrives; reason being, a thriving economy pushes up gold demand driven by Jewelleries, Coins etc.
.png)
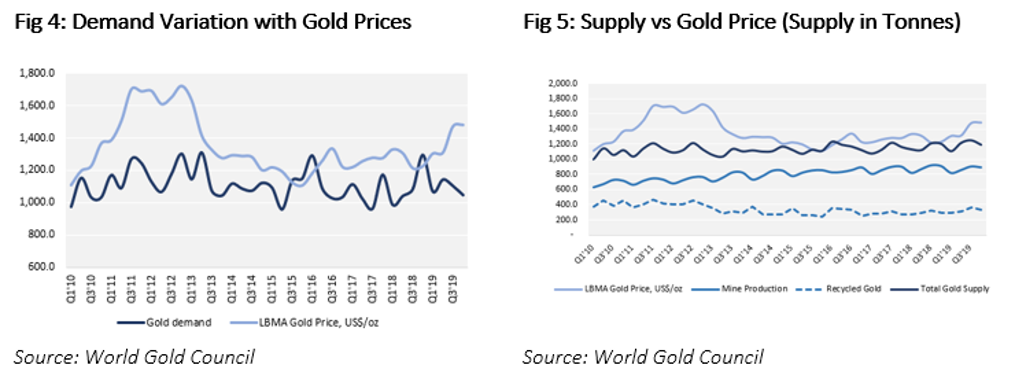
To understand the gold sector, first we need to understand the demand and supply dynamics of this commodity.
Demand: 2019 was a year of ups and downs, with the mega growth in Gold as an investment avenue and widespread decline in the consumption sector. The increase in demand from the ETF was enough to offset the decline in demand from other segments. 4Q19 recorded the highest buying of the gold by ETFs in the past 4 years. This coupled with the stable buying from the Central banks compensated for the decline in demand from the bars, coins and jewellery segments to propel the gold market. The uncertainties over Brexit, low-interest rates and IMF's prediction of lower global economic growth have made the investors to rebalance their portfolio in 2019.
.png)
Let’s take a detailed look at each factor which acts as the primary driver of the precious metal’s demand.
Jewellery: In 2019,The demand from Jewellery segment dipped by 6% to 2,107 tonnes, which is the lowest since 2011. The surging gold prices along with subdued economic conditions have had a major impact on the gold jewellery demand. India, one of the primary drivers for jewellery witnessed an annual decline of ~8.9%. The demand from Greater China region (including China, Taiwan & Hong Kong) declined by 8.3% y/y to 681.1 tonnes. In contrast to the most economies, US jewellery demand grew for a third successive year in 2019 to a 10-year high of ~131 tonnes. The demand from Europe was flat during the year. The annual demand in the Middle east fell mostly due to the economic and geopolitical challenges.
Bar and Coins: The Annual demand for gold bars and coins dropped almost 20% to ~871 tonnes which is the lowest since 2009 as the investors refrained from buying the physical gold and preferred the virtual form such as ETF.
ETF: During 2019, Gold ETFs bought ~401 tonnes of physical gold which provided the thrust to the gold industry. This, in turn shot up the physical gold holding with these ETFs to an all-time high of ~2,900 tonnes at the end of Q4CY19. The primary growth in ETF segment came from the places where sovereign bonds were yielding negative return (such as Germany, +~13% y/y) or the places that witnessed some political uncertainties (such as the UK, +~15% y/y). Australia listed funds experienced high growth during the year, ETFs Metal Securities alone added 4.2 tonnes of gold worth US $214 Million.
Central Banks' Demand: Central Banks across the geographies continued to buy the physical gold and bought ~650 tonnes (~USD 29 billion). During 1HCY19, central banks bought ~392 tonnes of gold (up 65% y/y); while in the second half; purchase was ~258 tonnes, down ~38% on an annual basis.
The above scenario showcased the retail demand versus investment scenario to some extent.
After getting a hang of the gold demand, let’s focus on how Australia is contributing in meeting the never-ending demand of the yellow metal.
Global Supply: The gold supply for 2019 stood at 4,776 tonnes,up 2% on an annual basis. The boost in supply came from the recycle segment triggered by a continuous rise in gold prices. The recycle gold supply experienced a 11% surge to 1,304 tonnes, the highest level seen since 2012. However, the global mine production declined by 1.3% to 3,463 tonnes.
Australia’s Contribution to Supply: During 2019, the total mine production increased by ~3.0% to ~311 tonnes. The growth in production largely came from the capacity expansion and the ramp up of existing mines such as Mount Morgans and Cadia Valley.
Supply Outlook: Going forward, production is expected to increase as some capacity addition such as Regis Resources’ McPhillamys mine (6.2 tonnes Gold capacity) and Capricorn Metals’ Karlawinda gold mine (4.0 tonnes Gold capacity) are expected to be commissioned in 2020 and 2021, respectively. As per our hypothetical estimates, the mine production supply from Australia in 2020 and 2021 is anticipated to be ~327 and ~335 tonnes of gold, respectively.
A higher demand triggers the upside trend in the prices of that specific commodity.After getting a grasp on the demand and supply dynamics, it’s time to understand the gold price movement.
Gold Price Movement: Gold is currently trading in a sweet spot with multiple factors aligning perfectly, such as lower interest rate, a slowdown in global economic activities, and market uncertainties. Amidst such backdrop, gold spot is hitting record high in Australia. As on 31 January 2020, Australian dollar-denominated gold spot touched a record high of $2,378.76 per ounce to mark the one-year return of ~ 30.0%.
To gauge the potential in the gold prices, we have considered several important technical factors. Let’s discuss in detail.
Future Curves: Gold futures curve, as of now, is showing an upward slope, which further suggests that the market is relatively bullish on gold. As per CAIA Institute, forward price of a commodity can be calculated as follow:
.JPG)
An upward sloping future curve also suggests that the convenience yield on gold is currently higher as compared to its storage cost, which could provide benefits to gold mining companies with large inventory.
Fig 6: Forward Curve
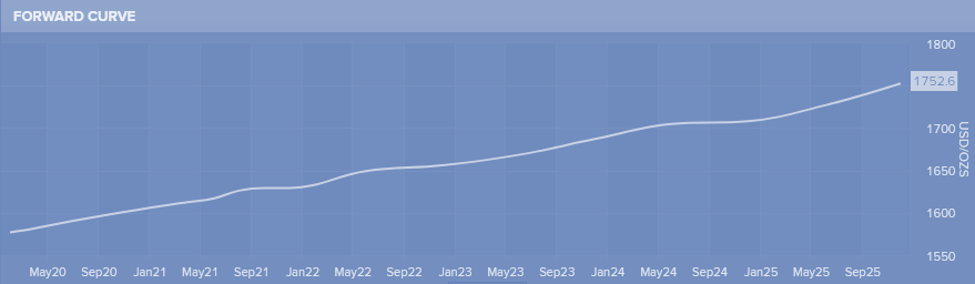
Source: www.gold.org
Net Longs: While the futures curve for gold is sloping upwards, the net longs in gold have increased substantially by ~181% in January 2020 as compared to its previous corresponding period. The increase in net longs, which is a momentum indicator, represents that the buying activities in gold have surged exponentially. Money managers held ~ 76% of total net longs in January 2020 with 1,083.66 contracts, against 45% of total net longs with 386.27 contracts in the previous corresponding period.
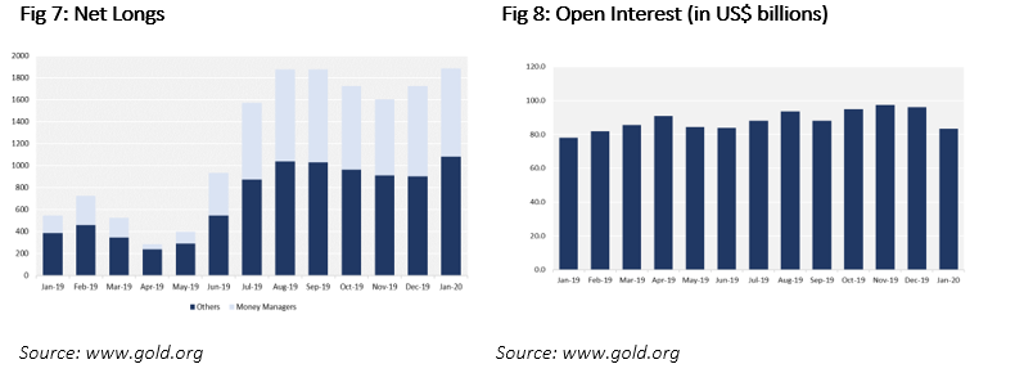
Open Interest: The open interest, which reflects the number of unclosed contracts in a trading period surged in January 2020, which combined with net longs number suggests that money managers or high net worth individuals are still favouring gold for short- to medium-term investments. The open interest for January 2020 stood at USD 83.4 billion, which remained ~ 7% higher against the previous corresponding period. The open interest rose significantly in 2019, and remained steady, which also reflects that demand for gold is on the surge, as inferred from significant unclosed contracts demanding physical delivery.
In general, when a commodity price surges, the producers enter net shorts to secure the future sales. This, with current net long positions held by investors along with hight open interest indicates that the demand for physical gold is also strong.
Breakout of Bullish Flag Pattern: The following technical chart is indicating ~22% potential upside in the gold prices in the medium term.
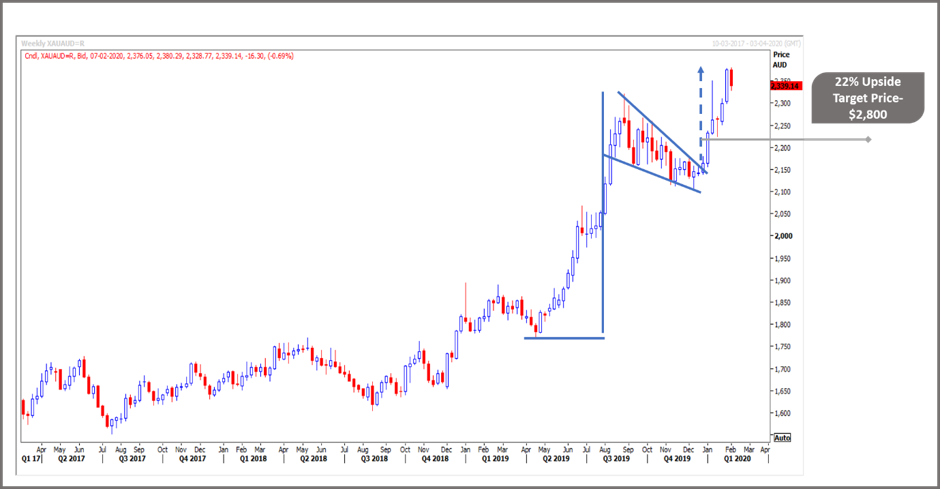
Source: Thomson Reuters
On the weekly chart, gold prices have given a breakout from a bullish flag pattern. The flag pattern suggests that gold is now set for a grand rally, with an upside potential of ~22 %, which would take the gold price near the levels of $2,800 an ounce.
Apart from the gold prices, there is one more factor which is favouring the domestic gold producers, which is domestic currency depreciation.
Depreciating Home Currency: There was a time when the Australian dollar was among top currencies with one AUD changing for USD 1.1087 in 2011. However, the slowdown in the domestic economy along with the sharp recovery in the United States had led to a substantial decline in the home currency. The AUD crashed from its decade peak of USD 1.1087 in 2011 to the low of USD 0.6669 in October 2019. The weak AUD has bolstered the revenue for many ASX gold miners amid higher realised exports.
Investment Theme and Stocks under Discussion
We expect the sector to remain attractive for the investors as the gold prices are expected to remain elevated in the near term and we expect a further low double-digit upside in the prices of the yellow metal. Most of the miners are focusing on capacity expansion either by acquisition or restart of closed mines or new project commencement. Since most of the output is exported, higher gold prices along with depreciating AUD may act as a booster to topline. To conclude, investors can pick the stocks suiting their requirement, to gain the benefits of rising gold prices amidst depreciating currency.
After understanding the nitty gritty of the sector, let’s take a detailed look at five miners in terms of their outlook and performance. To gauge the potential of the mining stocks, we have followed the market multiple approach and used the two metrics, namely ‘EV/EBITDA’ and ‘Price/Cashflow’. The peer group for each stock has been shortlisted based on their respective market capitalisation.
1. ASX: EVN (EVOLUTION MINING LIMITED)
(Recommendation: Buy, Potential Upside: 5% to 14%)
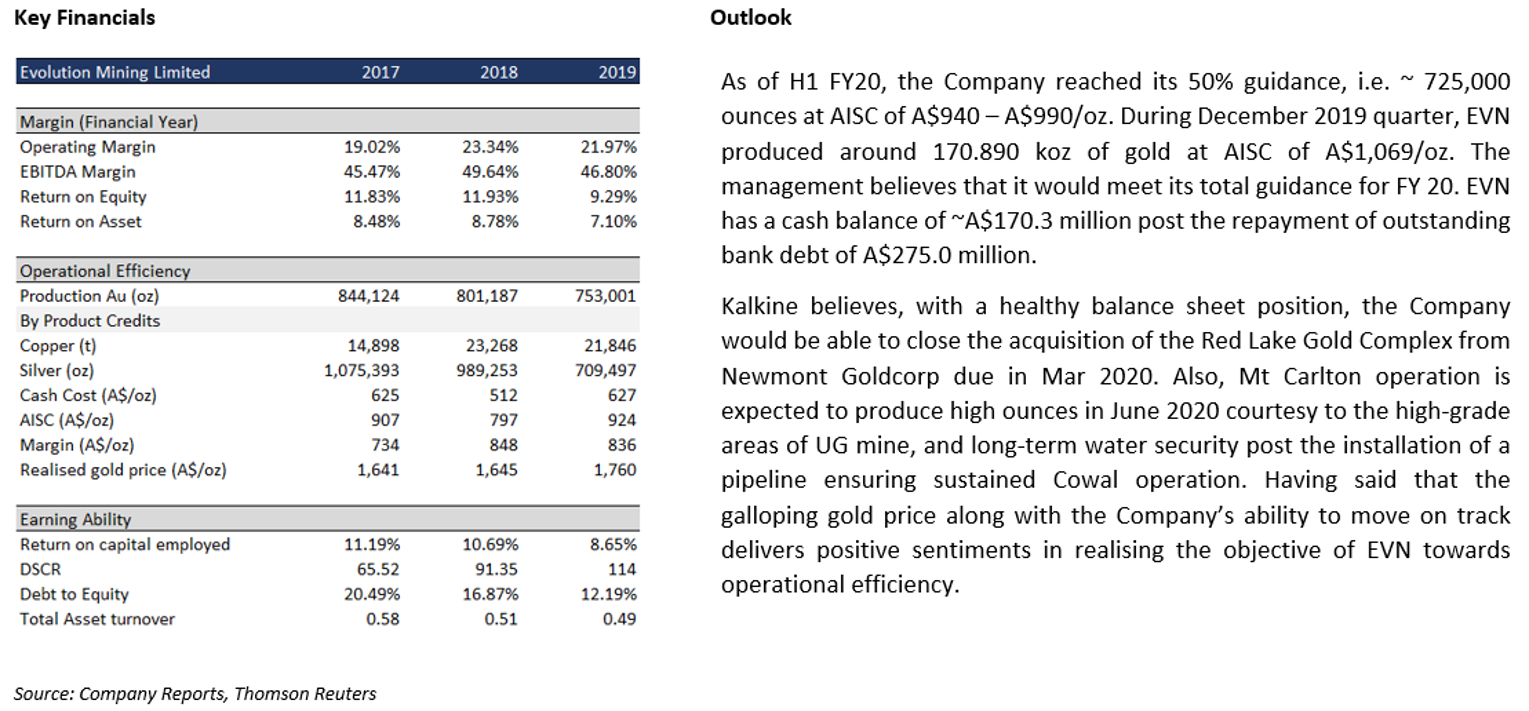
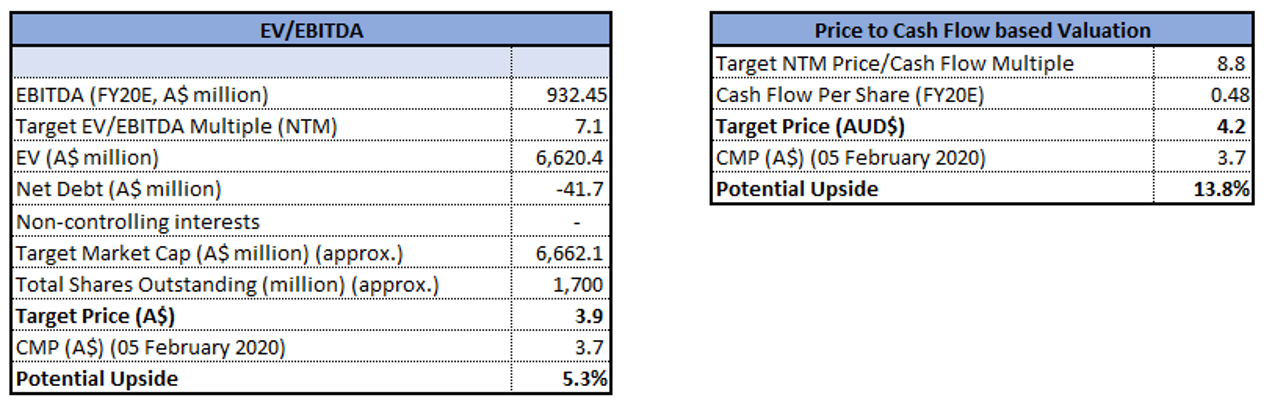
Valuation
Our valuation models suggest that stock has a potential upside in the range of ~5% to ~14% on 5 February 2020 closing price. We have taken NST, SAR and OZL as peer group for comparison purpose. The reason behind taking the targeted multiples (which suggest a slight premium over and above the peer average) is the acquisition of Red Lake Gold Operations which is expected to result in a capacity addition of ~200 koz.
2. ASX: OGC (OCEANAGOLD CORPORATION)
(Recommendation: Buy, Potential Upside: 9% to 14%)
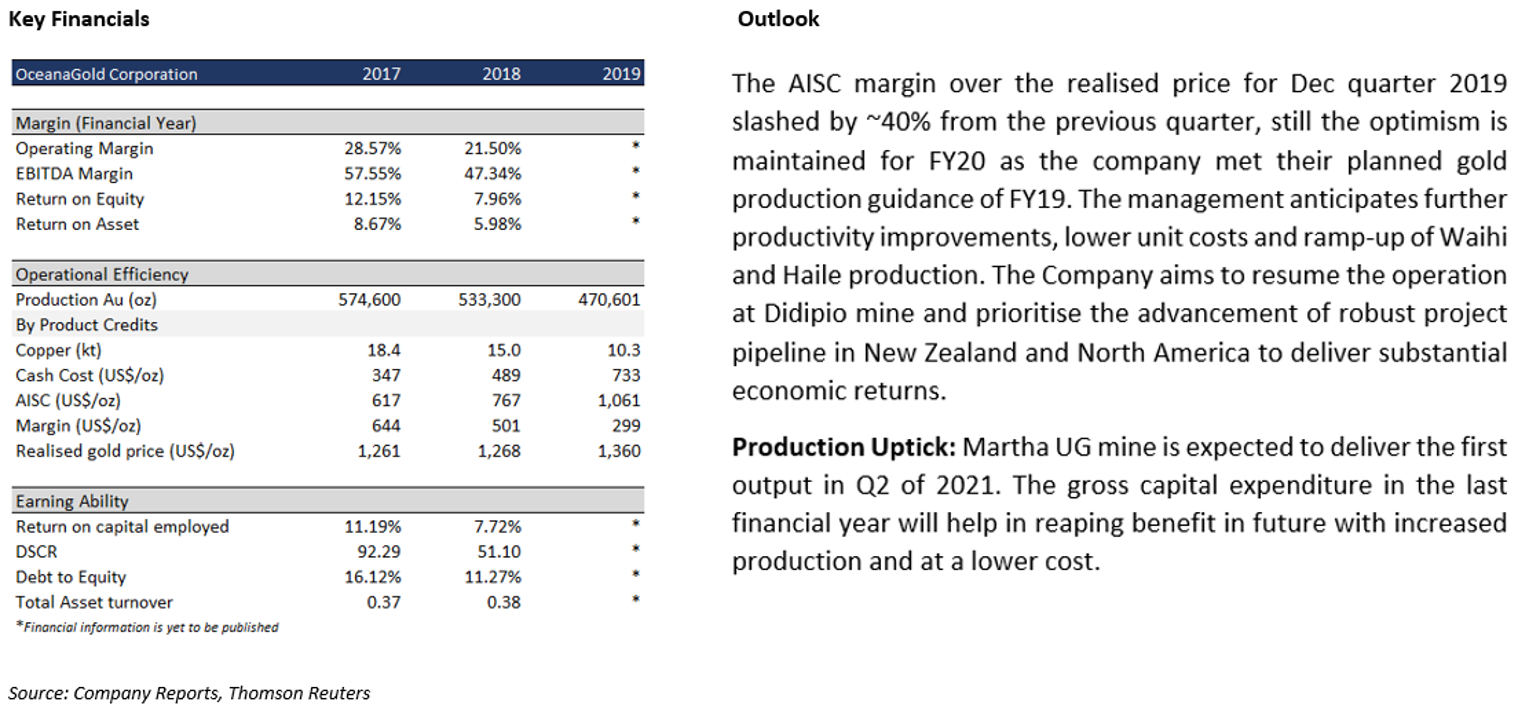
Valuation
Our valuation models suggest that stock has a potential upside in the range of ~9% to ~14% on 5 February 2020 closing price. We have taken RRL, SBM, SLR and PRU as peer group for comparison purpose. The reason behind taking the targeted multiples (which suggest a premium over and above the peer average) is the expansion in Haile processing plant’s capacity to 3.5 million tons of ore per annum in late 2019 and possibility of resource addition as indicated by drilling results of golden point deposit.
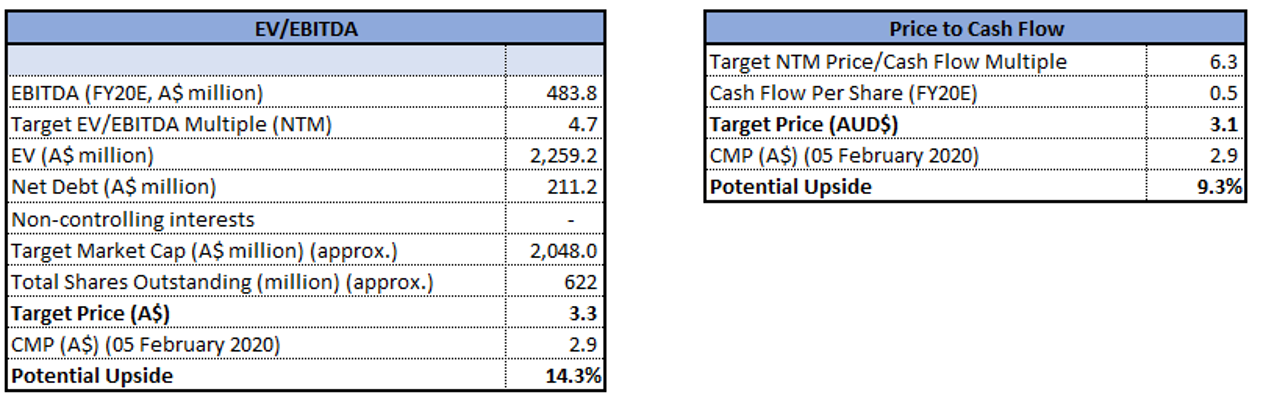
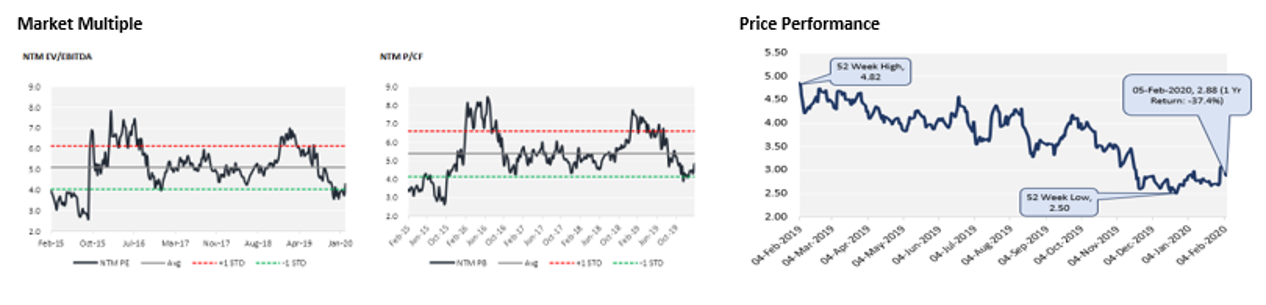
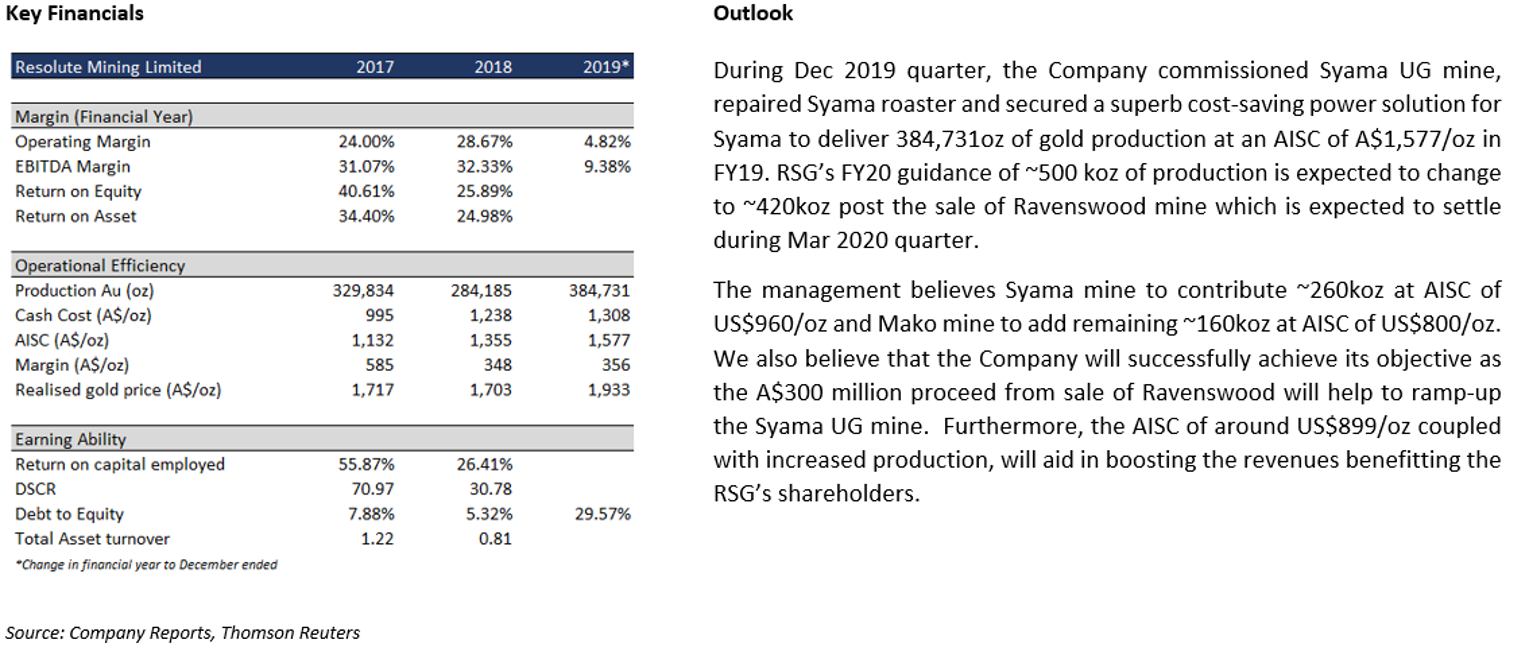
3. ASX: RSG (RESOLUTE MINING LIMITED)
(Recommendation: Buy, Potential Upside: 7% to 16%)
Valuation
Our valuation models suggest that stock has a potential upside in the range of ~7% to ~16% on 5 February 2020 closing price. We have taken OGC, SBM, and SLR as peer group for comparison purpose. The reason behind taking the targeted multiples (which suggest a premium over and above the peer average) is the sale of low margin Ravenswood assets and using the cash received to reduce the debt along with expectation of better output from Syama underground. Given the history for RSG, we have (to some extent) accounted for the risk relating to the company's ability to meet its production guidance for FY20.
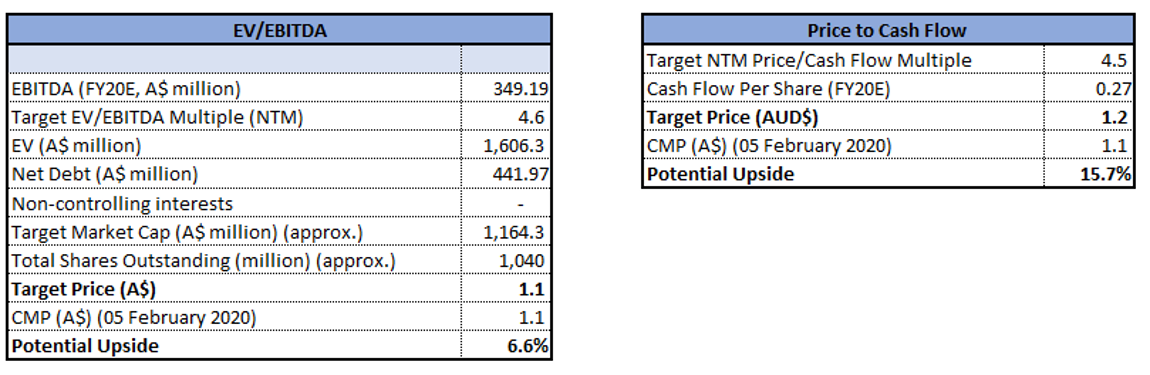
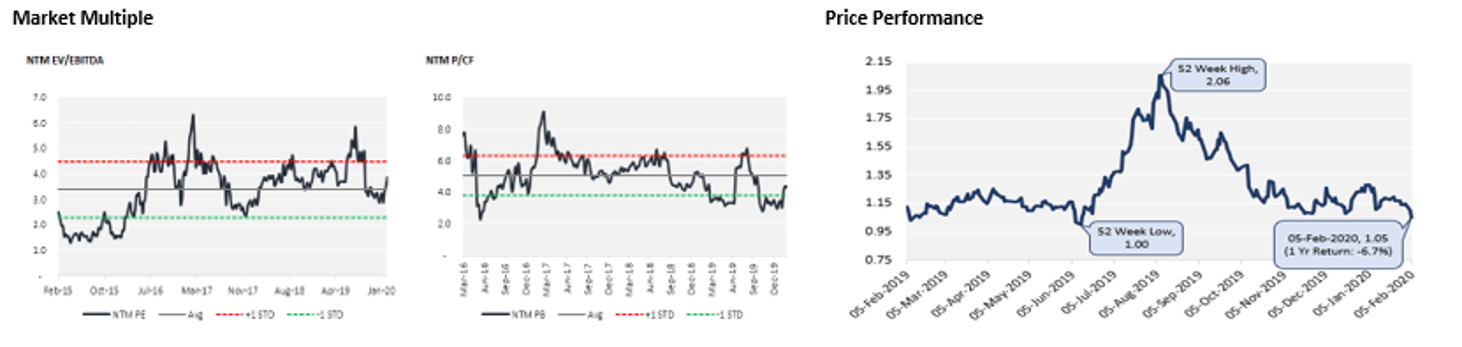
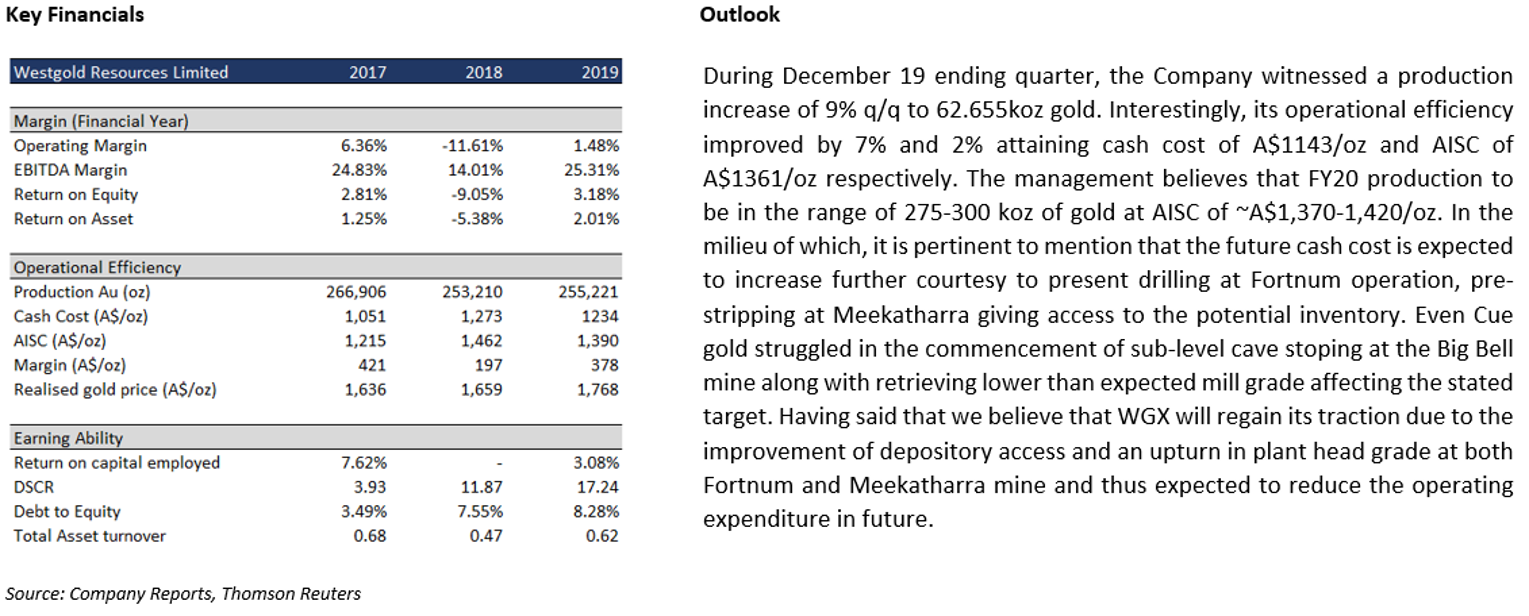
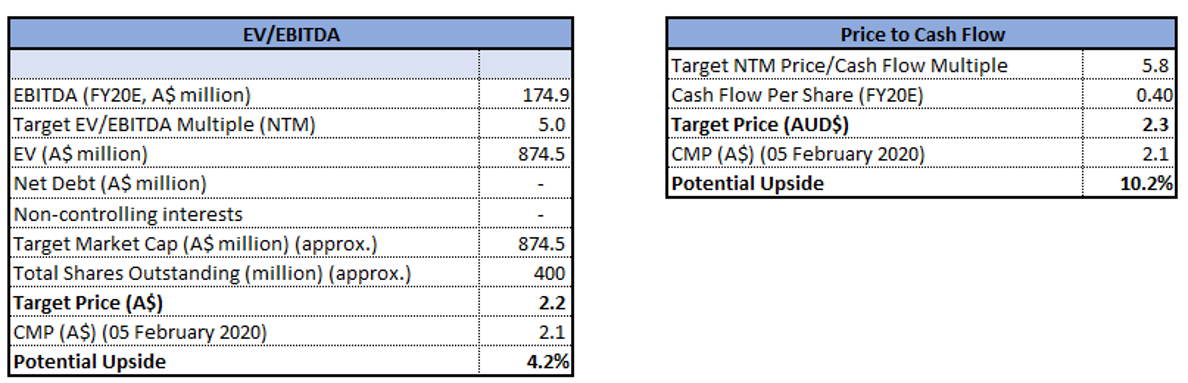
4. ASX: WGX (WESTGOLD RESOURCES LIMITED)
(Recommendation: Buy, Potential Upside: 4% to 10%)
Valuation
Our valuation models suggest that stock has a potential upside in the range of ~4% to ~10% on 5 February 2020 closing price. We have taken RSG, RMS and WAF as peer group for comparison purpose. The reason behind taking the targeted multiples (which suggest a premium over and above the peer average) is the expectation of commencement of pre-production from Bluebird pit by the end of March 2020 and underground Triton production by mid-2020. The company has demerged its polymetallic assets to focus solely on gold operations.
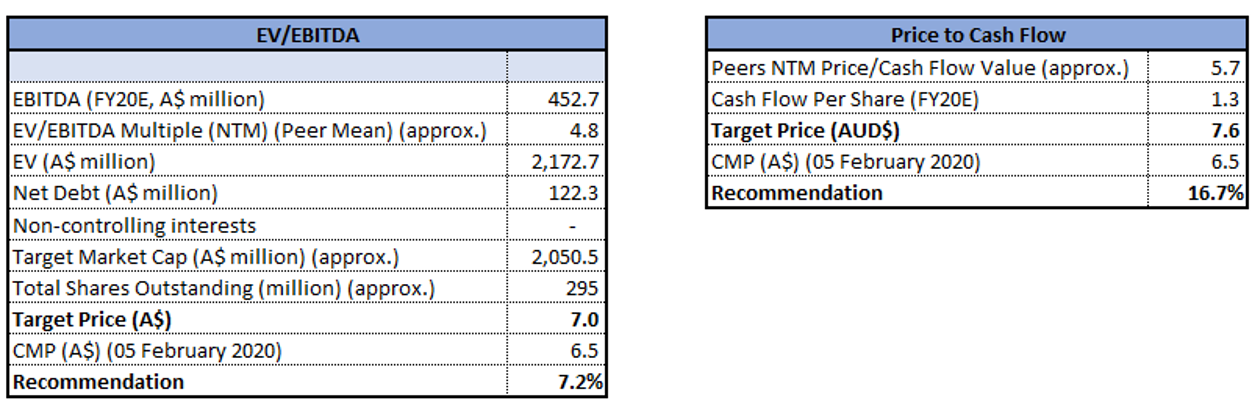
5. ASX: AQG (ALACER GOLD CORPORATION)
(Recommendation: Buy, Potential Upside: 7% to 17%)
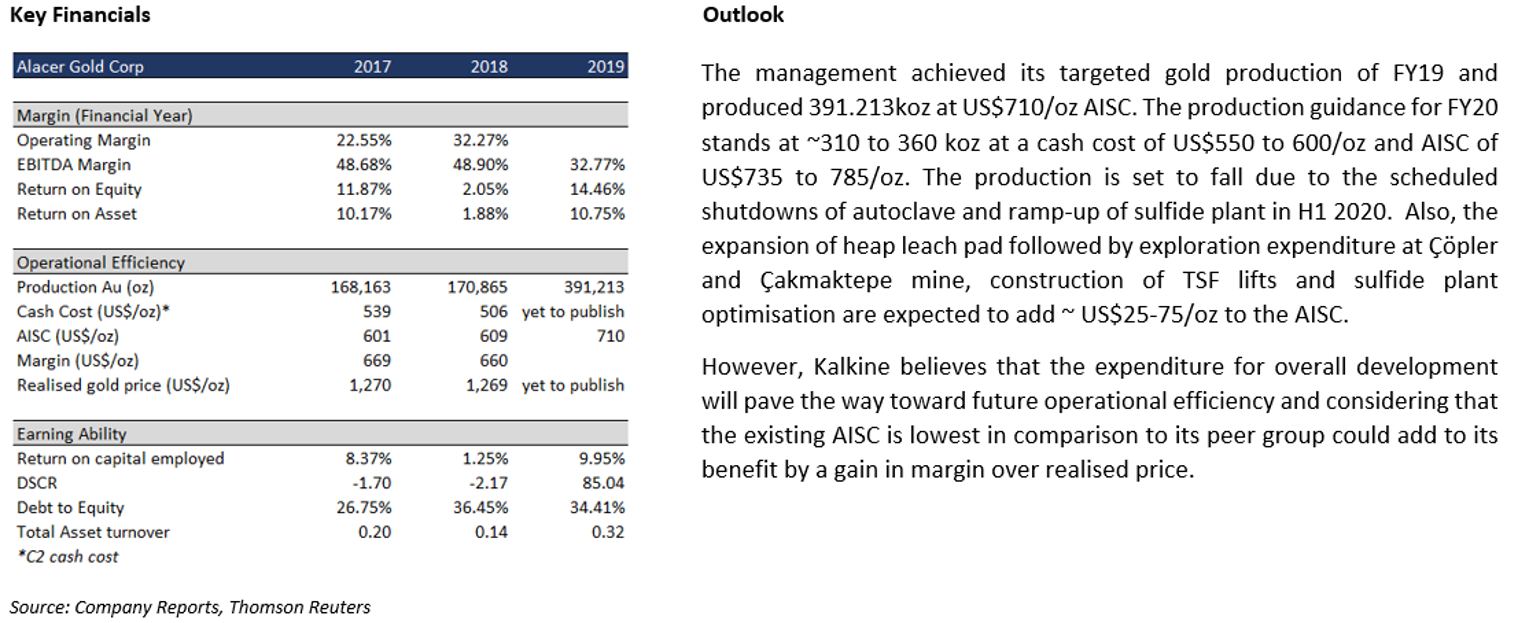
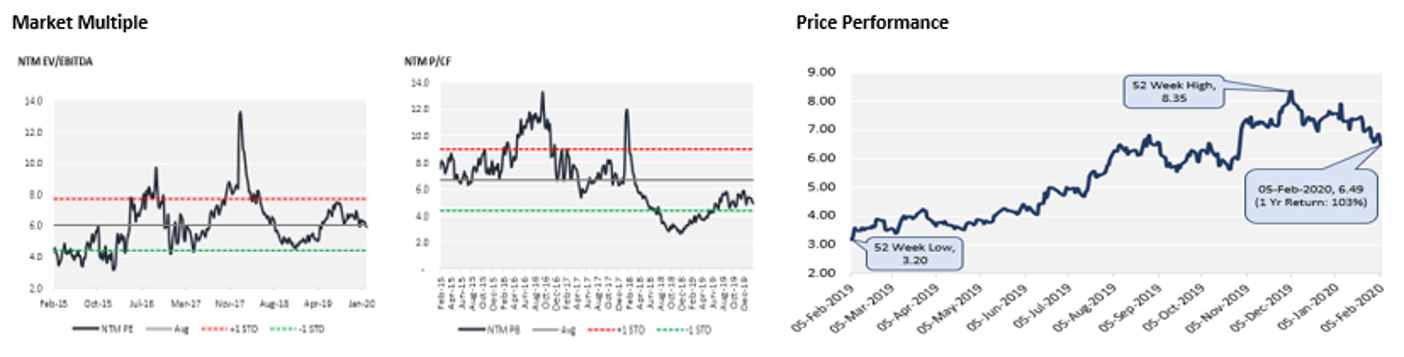
Valuation
Our valuation models suggest that stock has a potential upside in the range of ~7% to ~17% on 5 February 2020 closing price. We have taken RRL, SBM, PRU and SLR as peer group for comparison purpose. The reason behind taking the targeted multiples (which suggest a premium over and above the peer average) is the expected completion of phase 1 of Çöpler heap leach pad expansion in 2020.
Operational Performance Comparison
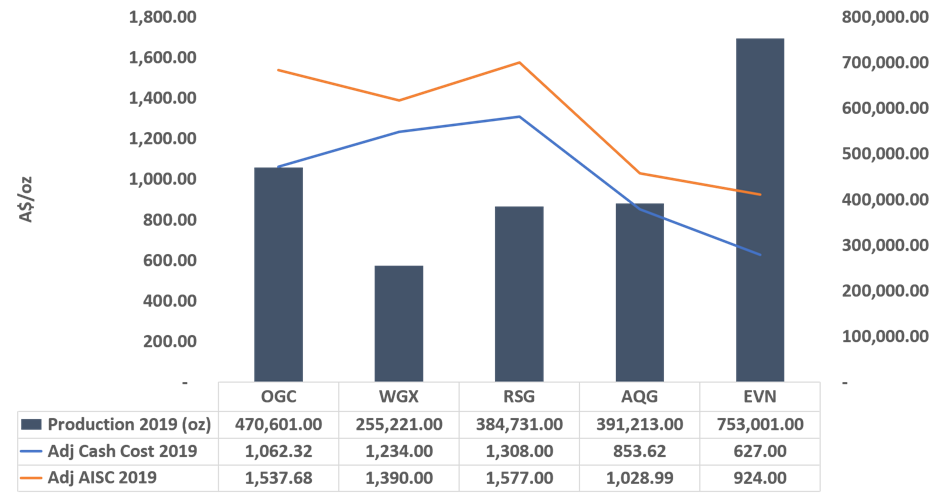
Note: All the recommendations and the calculations are based on the closing price of 5 February 2020. The financial information has been retrieved from the respective company’s website and Thomson Reuters.
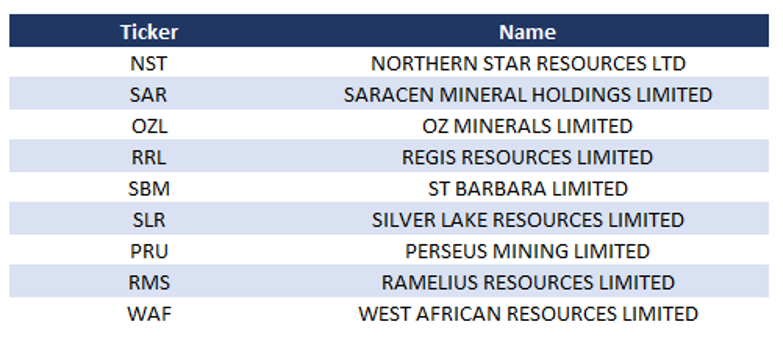
Following table represents the companies used for peer group selection
Disclaimer
The advice given by Kalkine Pty Ltd and provided on this website is general information only and it does not take into account your investment objectives, financial situation or needs. You should therefore consider whether the advice is appropriate to your investment objectives, financial situation and needs before acting upon it. You should seek advice from a financial adviser, stockbroker or other professional (including taxation and legal advice) as necessary before acting on any advice. Not all investments are appropriate for all people. Kalkine.com.au and associated pages are published by Kalkine Pty Ltd ABN 34 154 808 312 (Australian Financial Services License Number 425376). The information on this website has been prepared from a wide variety of sources, which Kalkine Pty Ltd, to the best of its knowledge and belief, considers accurate. You should make your own enquiries about any investments and we strongly suggest you seek advice before acting upon any recommendation. Kalkine Pty Ltd has made every effort to ensure the reliability of information contained in its newsletters and websites. All information represents our views at the date of publication and may change without notice. To the extent permitted by law, Kalkine Pty Ltd excludes all liability for any loss or damage arising from the use of this website and any information published (including any indirect or consequential loss, any data loss or data corruption). If the law prohibits this exclusion, Kalkine Pty Ltd hereby limits its liability, to the extent permitted by law to the resupply of services. There may be a product disclosure statement or other offer document for the securities and financial products we write about in Kalkine Reports. You should obtain a copy of the product disclosure statement or offer document before making any decision about whether to acquire the security or product. The link to our Terms & Conditions has been provided please go through them and also have a read of the Financial Services Guide. On the date of publishing this report (mentioned on the website), employees and/or associates of Kalkine Pty Ltd do not hold positions in any of the stocks covered on the website. These stocks can change any time and readers of the reports should not consider these stocks as personalised advice.
Past performance is not a reliable indicator of future performance.
 AU
AU

 Please wait processing your request...