Kalkine has a fully transformed New Avatar.

Company Overview: Fortinet, Inc. is a network security company. The Company provides cyber security solutions to a range of enterprises, service providers and government organizations across the world. Its network security solution consists of FortiGate physical, virtual machine and cloud platforms, which provide integrated security and networking functions to protect data, applications and users from network-and content-level security threats. The Company's product offerings consist of its FortiGate product family, along with its FortiManager central management and FortiAnalyzer central logging and reporting product families. Its cybersecurity platform includes a range of products, which include its FortiMail e-mail security, FortiSandbox advanced threat protection (ATP), FortiWeb Web application firewall, FortiDDos and FortiDB database security appliances, as well as its FortiClient endpoint security software, FortiAP secure wireless access points and FortiSwitch secure switch connectivity products.
(14).png)
FTNT Details
Market leader in Cybersecurity with Global Footprints: Fortinet Inc. (NASDAQ: FTNT) is a leading company in cybersecurity solutions, providing its services to a wide range of businesses, such as enterprises, communication service providers and small businesses. The company’s cybersecurity solutions are designed to provide broad visibility and segmentation of the digital attack surface through the integrated Security Fabric platform, which features automated protection, detection and responses. Business area of the company includes Network Security, Fortinet Security Fabric, Cloud Security and Internet of Things and Operational Technology. Security services provide extensive threat research and artificial intelligence capabilities from a global cloud network to deliver protection services to its customers. The company has a client base of more than 400,000, which includes 90% of S&P100 companies.
In FY18, the company recorded total revenue of $1.80 billion, an increase of 20% compared to $1.49 billion in FY17. Product revenue at $674.4 million in FY18 witnessed a growth of 17% on $577.2 million in FY17. Service revenue grew by 23% to $1.13 billion in 2018 against $917.7 million in 2017. Operating income during the period witnessed a healthy growth of 110% to $231.0 million in FY18. The period also saw a repurchase of 3.8 million shares under the Repurchase Program for an aggregate purchase price of $209.1 million. Looking at the past financial performance, Fortinet Inc. witnessed a CAGR growth of ~23.7% in revenue over the period of FY15-FY18 while net income recorded a stellar CAGR growth of ~90.3% during the same period. Going forward, considering the guidance given by the Management, CAGR growth in revenue over the period 2014 to 2019E is expected to be in the range of 22.2%-22.4%, driven by operating leverage, increased sales productivity, functionality and value in standalone and bundled subscription service offerings, etc.
Going forward, with the impact of product innovation strategy, growing sales to enterprise, service provider and government organizations, continued investments in research and development, integration of acquired companies and technologies along with expectations related to acquisitions, etc., the company is well-positioned for continued growth and market share gain.
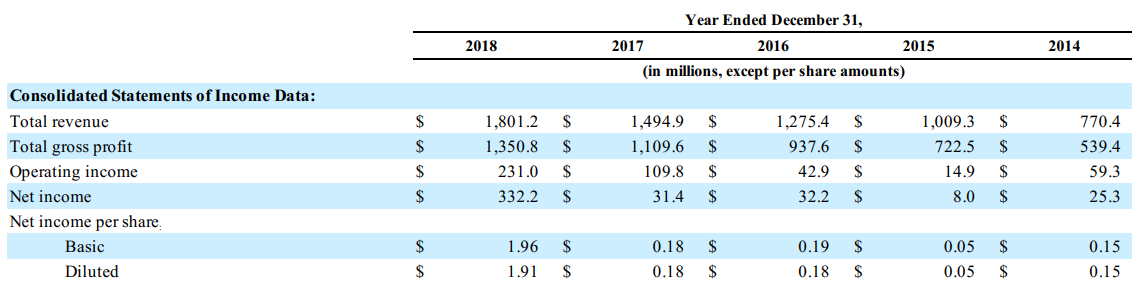
Financial Snapshot During 2014-2018 (Source: Company Reports)
Substantial Gain in Market Share: The company has increased its market share substantially over a period from 2009 to 2018. FTNT, across the Cybersecurity segment, stands as among the leaders with 13.1% market share in terms of revenue in 2018 from approximately 7.5% in 2009.
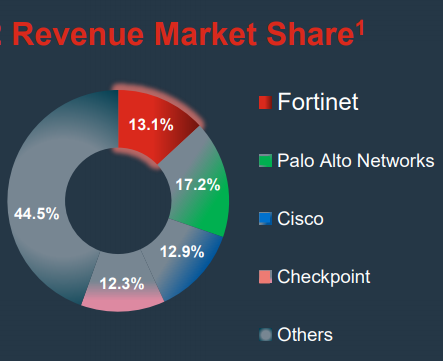
Revenue Market Share of Cybersecurity Players (Source: Company Reports)
Financial Highlights for the Second Quarter of 2019: The company recently posted a decent set of numbers for 2QFY19 with top-line and operating income growing at 18% and 48%, respectively.
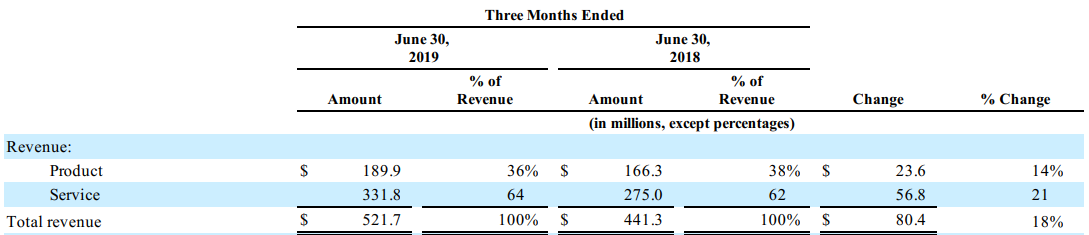
Revenue Recognition: The Company’s products and services are sold through a two-tier distribution model where the distributors sell to networking security and enterprise-focused resellers and service providers and managed security service providers. To support the broadly dispersed global channel and end-customer base, the company have sales professionals across 70 countries around the world. Fortinet, Inc. is focused on building the brand and driving end-customer demand for security solutions. FTNT uses a combination of internal marketing professionals and a network of regional and global channel partners. Coming to the bifurcation of revenue, product witnessed a decline as a percentage of total revenue and accounted for 36% in 2QFY19 from 38% in 2QFY18 whereas Service as a percentage of the total revenue increased to 64% in 2QFY19 from 62% in 2QFY18.
Proportion of Product and Service in Revenue (Source: Company Reports)
During 2QFY19, total revenue stood at $521.7 million, up 18% on prior corresponding period, followed by net income at $72.7 million, higher by 47.46% on pcp. Product revenue came in at $189.9 million during the second quarter of FY19, an increase of 14% on pcp. Expansion in Product revenue was largely led by growth in various hardware and software products due to an increase in unit shipments yoy, and a mix shift toward mid-range FortiGate appliances.
Service revenue witnessed a growth of 21% on pcp to $331.8 million. The increase in service revenue was primarily due to the recognition of revenue from company’s growing deferred revenue balance consisting of FortiGuard security subscription and FortiCare technical support and other contracts, which increased by $36.0 million, or 24%, and $20.8 million, or 16%, respectively, during 2QFY19 as compared to the prior corresponding period.
Total billings during the quarter stood at $622.4 million higher by 21% on FY18. During Q2FY19, the company reported a gross profit of $393.4 million, up 19.87% on y-o-y while gross margin stood at 75.41%. Research and development cost in terms of total revenue came in at 12.92% in Q2FY19 as compared to 13.87% in Q2FY18.
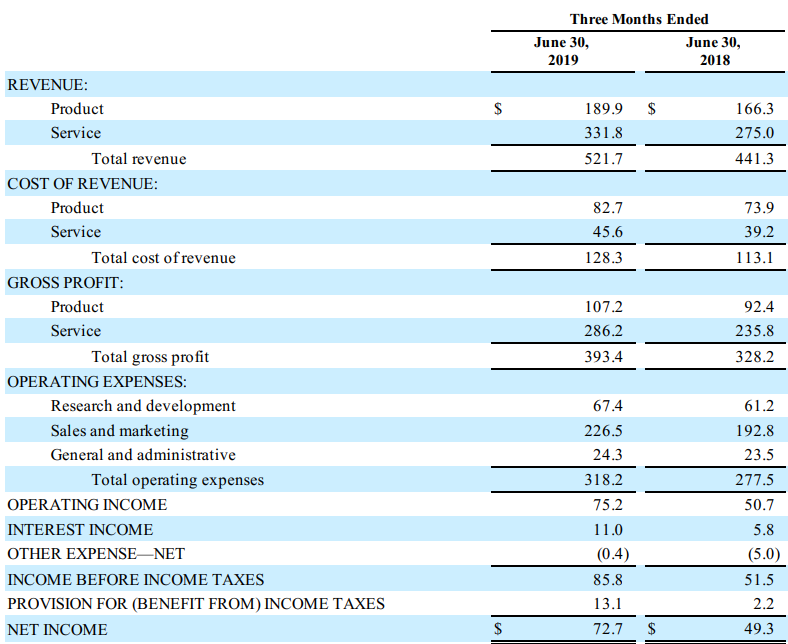
Q2FY19 Financial Highlights (Source: Company Reports)
Total gross margin at 75.4% saw a rise of 1.0 percentage points during the period, driven by improvements to both product and service gross margins. Product gross margin witnessed a growth of 0.9 percentage points on pcp. Product gross margin benefited from lower indirect product costs as a percentage of revenue, partially offset by an increase in direct product costs as a percentage of revenue, reflecting the shift in product mix. Service gross margin grew by 0.6 percentage points on pcp as service revenue growth outpaced the growth in related personnel costs.
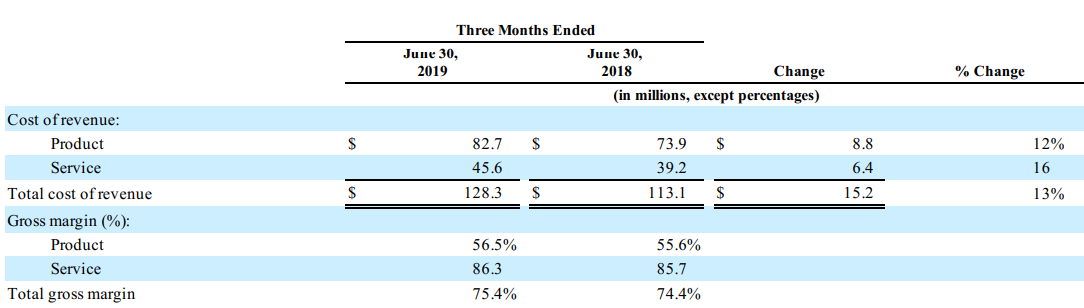
Cost of revenue and gross margin (Source: Company Reports)
Geography Wise Performance: Based on the geographic region, total operating revenue can be broadly classified into three segments such as Total Americas, Europe, Middle East and Africa (“EMEA”), and Asia Pacific (“APAC”). The quarter saw adiversification of revenue globally with the Americas, contributing the largest portion of the revenue growth on an absolute dollar basis. During Q2FY19, revenue from Total Americas stood at $225.5 million as compared to $189.3 million in Q2FY18, constituting ~43.22% of the total revenue. EMEA contributed ~36.80% to the total revenue at $192 million as compared to $164.4 million in the previous corresponding quarter. While revenue from the Asia Pacific stood at $104.2 million, deriving ~19.97% of the total operating revenue. Growth on pcp from all the geographies varied in the range of 17% to 19% in the quarter.
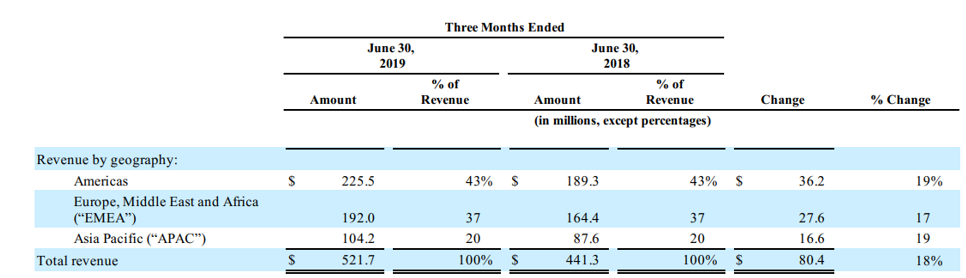
Geography-Wise Revenue (Source: Company Reports)
Q2FY19 Non-GAAP Financials: The Company reported total revenue of $522 million, up 18% on pcp while net income came in at $102 million as compared to $71 million in Q2FY18. During the quarter, the company reported a gross margin and operating margin at 76.4% and 23.6% as compared to 75.4% and 21.1% on pcp, respectively. Operating income stood at $123 million as compared to $93 million during the previous corresponding period. FTNT posted a deferred revenue of $1.87 billion during the quarter, higher from the previous corresponding quarter of $1.4 billion. Cash and Investment stood at $1.98 billion, followed by a total headcount of 6,293 as on 30 June 2019. Billings for the period saw a pcp growth of 21% to $622 million. Income from Product revenue and Service revenue came in at $190 million and $332 million, registering a growth of ~14% and ~21% on pcp, respectively.
Top 10 Shareholders: The top 10 shareholders have been highlighted in the table, which together form around 43.20% of the total shareholding. The Vanguard Group, Inc. and Xie (Michael) hold the maximum interests in the company at 10.08% and 8.28%, respectively.
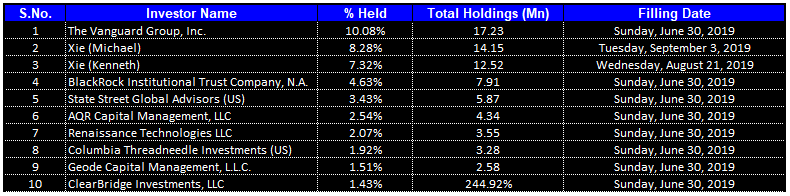
Top 10 Shareholders (Source: Thomson Reuters)
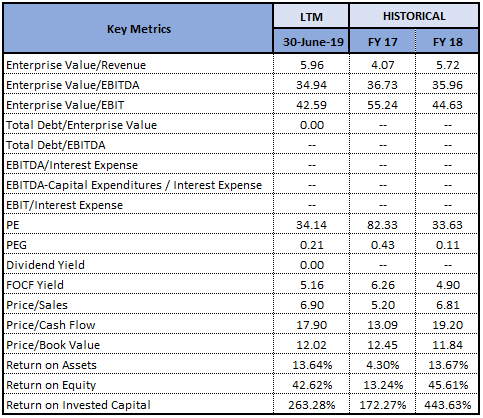
Key Metrics: The company posted decent margins in the second quarter of FY2019. Gross margin for Q2FY19 stood at 75.4%, lower than Q1FY19 but higher compared to Q2FY18. EBITDA and net margin for 2QFY19 came in at 17.3% and 13.9%, higher as compared to 14.6% and 11.2% in Q2FY18, respectively. Return on Equity (ROE) stood at 6.7% in Q2FY19, which is broadly in-line with the prior corresponding period.
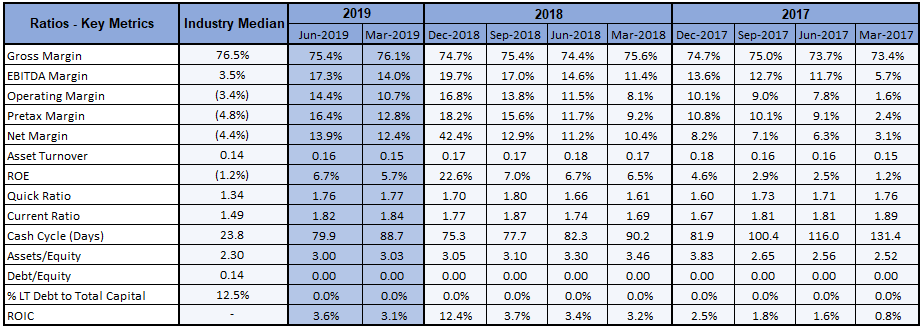
Key Metrics (Source: Thomson Reuters)
Manufacturing and Suppliers: The company outsources the manufacturing of security appliance products to a variety of contract manufacturers and original design manufacturers. The current manufacturing partners include ADLINK Technology, Inc., IBASE Technology, Inc., Micro-Star International Co., Senao Networks, Inc., Wistron Corporation, and several other manufacturers. Most of the hardware is manufactured in Taiwan, with some products manufactured in the United States and China.
Research and Development: FTNT focuses on research and development by developing new hardware and software products and services and adding new features to existing products and services. The development strategy emphasizes on products and systems for both software and hardware that expected to be important to the end-customers.
Recent Business Combination: The company recently acquired ZoneFox Holdings Limited on October 22, 2018 for the purchase price of $16.1 million. It is a privately held cloud-based company providing insider threat detection and response. Moreover, FTNT acquired Bradford Networks, Inc., a provider of network access control security products and services, on June 4, 2018 for the consideration of $6.8 million.
Key Valuation Metrics (Source: Thomson Reuters)
Outlook: The Management provided the guidance for third quarter of FY19, according to that revenue is expected to be within the range of $525 million to $540 million, and billings are likely to be between $600 million to $615 million. The gross margin as per non-GAAP basis is expected to come in the range of 75.5% to 76.5%, while operating margin is likely to be in the range of 23.0% to 23.5% on a non-GAAP basis. The Management expects diluted non-GAAP net income per share within $0.55 to $0.57, and tax-rate is assumed at 24% on non-GAAP terms.
Coming to the full year guidance for FY19, revenue is likely to be in the range of $2.10 billion to $2.12 billion, while Service revenue is expected between $1.34 billion to $1.36 billion. The Management expects FY19 Billings to be in the range of $2.51 billion to $2.54 billion, while diluted non-GAAP net income per share is projected to be in the range of $2.23 to $2.26, with non-GAAP effective tax rate of 24%. Gross margin and operating margin are projected at 75.5%-76.5% and 23.0%-23.5%, respectively.
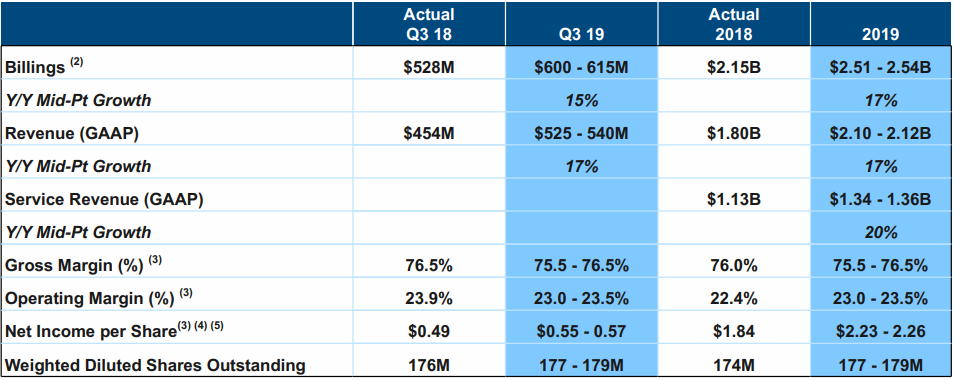
Non-GAAP Q3FY19 and FY19 Guidance (Source: Company Reports)
Valuation Methodologies:
Method 1: Price to Book Value Multiple Approach:
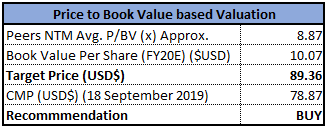
P/BV Multiple Valuation (Source: Thomson Reuters)
Method 2: Price to Cash Flow Multiple Approach:
(9).png)
P/CF Multiple Valuation (Source: Thomson Reuters)
Note: All forecasted figures and peers have been taken from Thomson Reuters, *NTM-Next Twelve Months
Stock Recommendation: At the current market price of $78.87, the stock is currently trading at a price to earnings multiple of 37.03x with a market capitalization of ~$13.48 Billion. The company witnessed a decent growth in recent times with billing and revenue expanding 21% and 18%, respectively, driven by strong performance in the United States that contributed the billing growth outpacing the competitors. Gross margin improved to 76.4% in 2QFY19 from 75.4% on pcp. FTNT saw a strong free cash flow of $178 million at the end of 2QFY19. The Management expects FY19 to be another year of better-than-industry growth, led by advanced security processing technology, new products and services offerings, and new market opportunities. Considering the aforesaid facts, we have valued the stock using two relative valuation methods, i.e., Price to Book Value and Price to cash flow multiple and arrived at a target price of the stock in the range of $89.36 to $92.45 (lower double-digit growth (in %)). Hence, we recommend a “Buy” rating on the stock at the current market price of $78.87, down 0.73% on 18 September 2019.
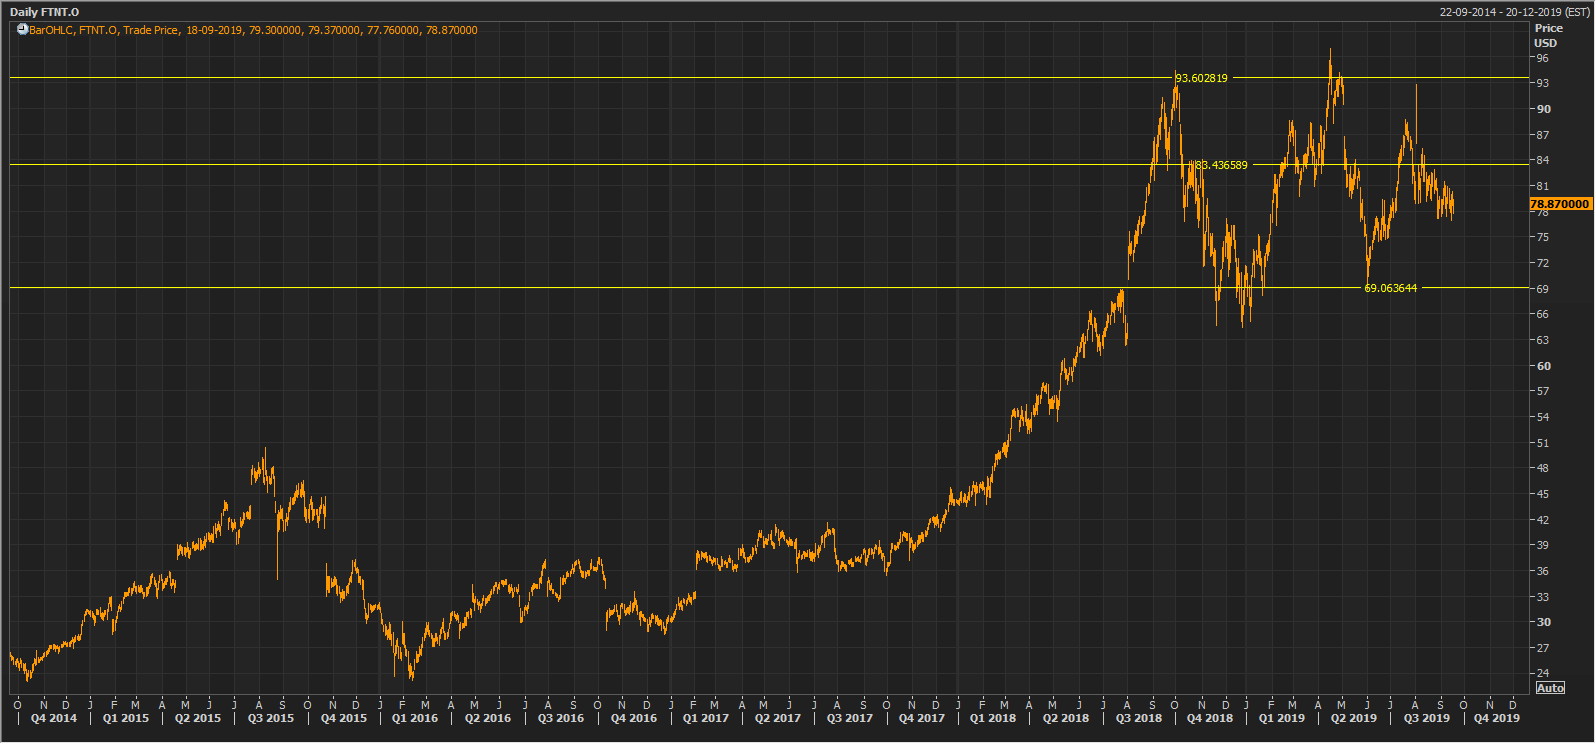
FTNT Daily Technical Chart (Source: Thomson Reuters)
Disclaimer
The advice given by Kalkine Pty Ltd and provided on this website is general information only and it does not take into account your investment objectives, financial situation or needs. You should therefore consider whether the advice is appropriate to your investment objectives, financial situation and needs before acting upon it. You should seek advice from a financial adviser, stockbroker or other professional (including taxation and legal advice) as necessary before acting on any advice. Not all investments are appropriate for all people. Kalkine.com.au and associated pages are published by Kalkine Pty Ltd ABN 34 154 808 312 (Australian Financial Services License Number 425376). The information on this website has been prepared from a wide variety of sources, which Kalkine Pty Ltd, to the best of its knowledge and belief, considers accurate. You should make your own enquiries about any investments and we strongly suggest you seek advice before acting upon any recommendation. Kalkine Pty Ltd has made every effort to ensure the reliability of information contained in its newsletters and websites. All information represents our views at the date of publication and may change without notice. To the extent permitted by law, Kalkine Pty Ltd excludes all liability for any loss or damage arising from the use of this website and any information published (including any indirect or consequential loss, any data loss or data corruption). If the law prohibits this exclusion, Kalkine Pty Ltd hereby limits its liability, to the extent permitted by law to the resupply of services. There may be a product disclosure statement or other offer document for the securities and financial products we write about in Kalkine Reports. You should obtain a copy of the product disclosure statement or offer document before making any decision about whether to acquire the security or product. The link to our Terms & Conditions has been provided please go through them and also have a read of the Financial Services Guide. On the date of publishing this report (mentioned on the website), employees and/or associates of Kalkine Pty Ltd do not hold positions in any of the stocks covered on the website. These stocks can change any time and readers of the reports should not consider these stocks as personalised advice.
Past performance is not a reliable indicator of future performance.
 Please wait processing your request...