
Company Overview: Fortescue Metals Group Ltd (ASX: FMG) is engaged in extracting and producing iron ore. It has its operations spread out in the Pilbara region of Western Australia, which comprises Chichester, Solomon, and Western mining hubs. China forms a significant part of its clientele, and it has also expanded its exports into the markets of Japan and South Korea. The company started trading on ASX in March 1987.
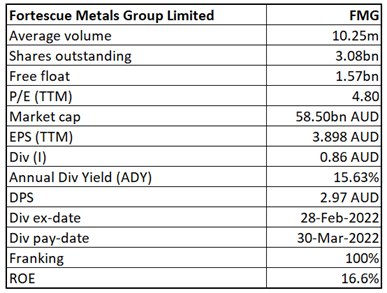
FMG Details
A Quick Look at 1HFY22 Results: The company remains well focused on iron ore and commodities, which maintain its objective of decarbonisation. FMG is also focused on creating a global portfolio of green hydrogen and green ammonia projects, for which it has established Fortescue Future Industries (FFI). FMG delivered a decent performance in 1HFY22 and reported record annual shipments during the year.
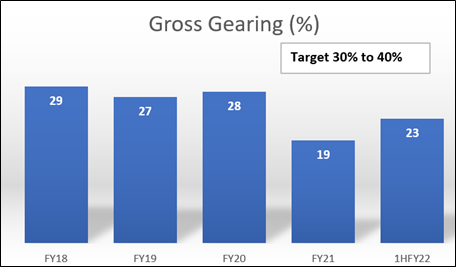
Gearing Highlight (Source: Analysis by Kalkine Group)
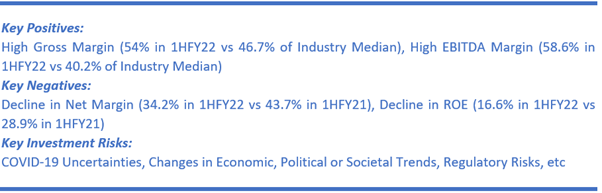
Key Metrics: For 1HFY22, FMG reported a gross margin of 54%, higher than the industry median of 46.7%.
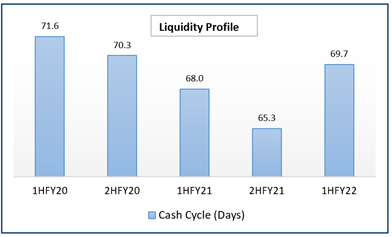
Liquidity Profile (Analysis by Kalkine Group)
Top 10 Shareholders:
The top 10 shareholders together form around 58.13% of the total shareholding, while the top four constitute the maximum holding. Forrest (John Andrew Henry) and Valin Investments (Singapore) Pte. Ltd. are holding a maximum stake in the company at 36.75% and 7.41%, respectively, as also highlighted in the chart below:

(Analysis by Kalkine Group)
Dividend Track Record:
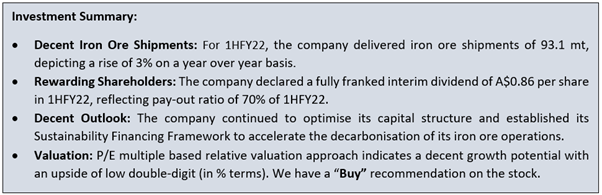
The company declared a fully franked interim dividend of A$0.86 per share in 1HFY22, reflecting pay-out ratio of 70% of 1HFY22. The dividend in absolute numbers amounted to A$2.65 billion during 1HFY22. It plans to maintain a dividend policy pay-out of 50 to 80% of the full-year NPAT. At a CMP of A$18.94, the company’s annual dividend yield stood at 15.63%.
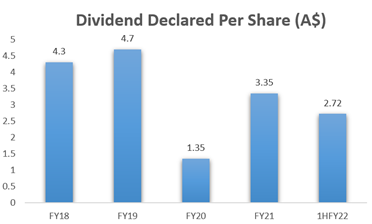
Dividend History (Source: Analysis by kalkine Group)
Key Risks: The company is exposed to the risk of adverse economic conditions triggered by the COVID-19 pandemic. The Group’s operations also expose its activities to be deemed harmful to the environment, and it is under the strict purview of regulatory bodies. Any adverse impact on the demand for iron ore might pose a threat to the profitability of the company.
Outlook: The company expects FY22 iron ore shipments to be between 180-185 mt. It anticipates the capital expenditure to be between US$3 billion – US$3.4 billion (excluding Fortescue Future Industries) in FY22 and expects C1 cost to be in the range of US$15- US$15.50/wmt. FMG’s balance sheet remains strong on low cost and maintains its flexibility to sustain ongoing operations and the capacity to fund future growth. The company continued to optimise its capital structure and established its Sustainability Financing Framework to accelerate the decarbonisation of its iron ore operations. Lastly, FMG’s Iron Bridge project progresses well, with the first production scheduled in December 2022.
Valuation Methodology: P/E Multiple Based Relative Valuation (Illustrative)
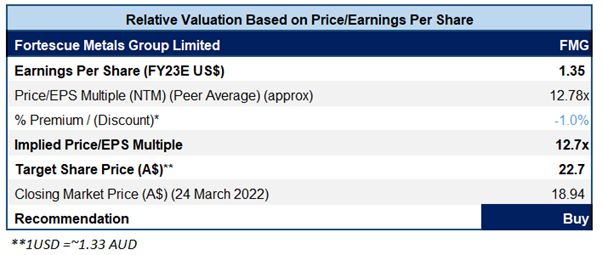
Source: Analysis by Kalkine Group
*% Premium/(Discount) is based on our assessment of the company’s NTM trading multiple after considering its key growth drivers, economic moat, stock's historical trading multiples versus peer average/median, and investment risks.
Stock Recommendation: As per a recent update, the company announced that it would appoint Dr Guy Debelle as its Chief Financial Officer (CFO), thus taking an essential step in delivering FFI’s global green energy vision. Over the last nine months, the stock has corrected by 16.6% and is trading lower than the average 52-week price level band of $13.9 - $26.58, offering a decent opportunity for accumulation. The stock has been valued using the P/E multiple based illustrative relative valuation method and arrived at a target price with an upside of low double-digit (in % terms). The company can trade at a slight discount to its peers, considering potential supply chain constraints and labour supply shortage. For valuation purposes, peers like Alumina Ltd (ASX: AWC), Mineral Resources Ltd (ASX: MIN), and OZ Minerals Ltd (ASX: OZL) have been considered. Given the increased shipments, diversification into global energy portfolio, decent long-term outlook, current trading levels, and upside indicated by valuation, we give a 'Buy' rating on the stock at the closing market price of $18.94, down by ~0.316% as of 24 March 2022.
Markets are trading in a highly volatile zone currently due to certain macro-economic issues and geopolitical tensions prevailing. Therefore, it is prudent to follow a cautious approach while investing.
.png)
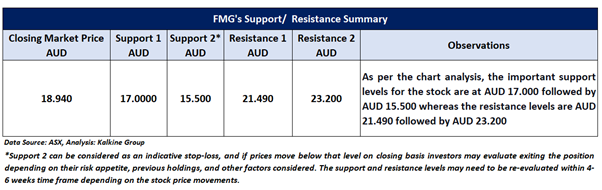
FMG Daily Technical Chart (Source: Refinitiv, Thomson Reuters)
Note 1: The reference data in this report has been partly sourced from REFINITIV.
Note 2: Investment decision should be made depending on the investors’ appetite on upside potential, risks, holding duration, and any previous holdings. Investors can consider exiting from the stock if the Target Price mentioned as per the Valuation has been achieved and subject to the factors discussed above.
Technical Indicators Defined:
Support: A level where-in the stock prices tend to find support if they are falling, and downtrend may take a pause backed by demand or buying interest.
Resistance: A level where-in the stock prices tend to find resistance when they are rising, and uptrend may take a pause due to profit booking or selling interest.
Stop-loss: It is a level to protect further losses in case of unfavourable movement in the stock prices.
Disclaimer - This report has been issued by Kalkine Pty Limited (ABN 34 154 808 312) (Australian financial services licence number 425376) (“Kalkine”) and prepared by Kalkine and its related bodies corporate authorised to provide general financial product advice. Kalkine.com.au and associated pages are published by Kalkine.
Any advice provided in this report is general advice only and does not take into account your objectives, financial situation or needs. You should therefore consider whether the advice is appropriate to your objectives, financial situation and needs before acting upon it.
There may be a Product Disclosure Statement, Information Statement or other offer document for the securities or other financial products referred to in Kalkine reports. You should obtain a copy of the relevant Product Disclosure Statement, Information Statement or offer document and consider the statement or document before making any decision about whether to acquire the security or product.
You should also seek advice from a financial adviser, stockbroker or other professional (including taxation and legal advice) as necessary before acting on any advice in this report or on the Kalkine website. Not all investments are appropriate for all people.
The information in this report and on the Kalkine website has been prepared from a wide variety of sources, which Kalkine, to the best of its knowledge and belief, considers accurate. Kalkine has made every effort to ensure the reliability of information contained in its reports, newsletters and websites. All information represents our views at the date of publication and may change without notice.
Kalkine does not guarantee the performance of, or returns on, any investment. To the extent permitted by law, Kalkine excludes all liability for any loss or damage arising from the use of this report, the Kalkine website and any information published on the Kalkine website (including any indirect or consequential loss, any data loss or data corruption). If the law prohibits this exclusion, Kalkine hereby limits its liability, to the extent permitted by law, to the resupply of services.
Please also read our Terms & Conditions and Financial Services Guide for further information.
On the date of publishing this report (referred to on the Kalkine website), employees and/or associates of Kalkine and its related entities do not hold interests in any of the securities or other financial products covered on the Kalkine website unless those persons comply with certain safeguards, procedures, and disclosures.
Kalkine Media Pty Ltd, an affiliate of Kalkine Pty Ltd, may have received, or be entitled to receive, financial consideration in connection with providing information about certain entity(s) covered on its website.
Past performance is not a reliable indicator of future performance.
 Please wait processing your request...