
Company Overview: F5 Networks, Inc. is a developer and provider of software defined application services. The Company is engaged in the development, marketing and sale of application delivery networking products that optimize the security, performance and availability of network applications, servers and storage systems. The Company's geographical segments include the Americas (primarily the United States); Europe, the Middle East, and Africa (EMEA); Japan, and the Asia Pacific region (APAC). The Company's Traffic Management Operating System (TMOS) based offerings include software products for local and global traffic management, network and application security, access management, Web acceleration and various network and application services. These products are available as modules that can run individually or as part of an integrated solution on the Company's purpose-built BIG-IP appliances and VIPRION chassis-based hardware, or as software-only Virtual Editions.
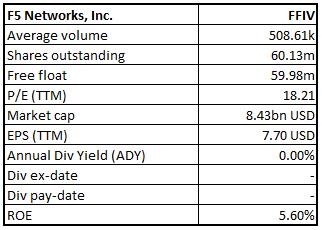
FFIV Details
Prominent name with esteemed clientele base: F5 Networks, Inc. (NASDAQ: FFIV) is an IT solution company, operating across application services, designed to ensure fast, secured and reliable delivery of applications and data in multi-cloud environments and data centers. The product offerings include hardware-based software, software-only solutions, cloud-based services and managed service offerings. The company sells its products through multiple indirect sales channels across the United States, Europe, the Middle East, and Africa (EMEA), and in the Asia Pacific region. FFIV has a decent client-base in technology, telecommunications, financial services, transportation, education, manufacturing and health care industries, which include some of prestigious names from Fortune 1000 or Business Week Global 1000 companies. The company also caters to government customers while enterprise customers from the above sectors make up the largest share.
In FY18 (ended on September 2018), total revenue stood at $2,161.4 million, posting a rise of 3.41% as compared to $2,090.04 million in FY17 while the company reported its bottom-line at $453.69 million, up 7.83% on y-o-y. Product revenue during FY18 stood at $960.1 million as compared to $964.66 million on pcp, contributing 44.4% to the total revenue as compared to 46.2% in previous year. FY18 service revenue stood at $1,201.3 million, contributing 55.6% of the total revenue, as compared to $1,125.38 million during FY17. Looking at the past performance, FFIV has delivered a CAGR growth of ~5.69% in revenue over the period of FY14 to FY18 while the bottom-line CAGR growth during the same period grew at 9.88%. Going forward, considering the guidance given by the Management, CAGR growth in revenue over the period 2014 to 2019E is expected to be in the range of 5.18% to 5.27%. The growth is largely driven by growing demand across software application services as clients are leaning towards consistent application security and reliable performance across private, public and multi-cloud environments provided by the company.
Going forward, proper execution of expanding strategy and transforming FFIV to a software-driven model aided by reprioritization of development resources, introduction of new, flexible consumption models. The recent acquisition and integration of NGINX with the company are likely to result in higher market share across Fortune 1000 and Business Week Global 1000 clients.
.png)
Financial Highlights During 2014-2018 (Source: Company Reports)
Q3FY19 Performance Highlights: The company recently reported results for the third quarter ended June 30, 2019 with net revenue increasing ~3.9% on pcp to $563.39 million, driven by higher software revenue including company’s subscription-based products and increased service revenue as a result of higher installed base of products. International revenues in 3QFY19 represented ~51.5% of total net revenues compared to ~49.3% in the previous corresponding quarter. The company reported its bottom-line at $85.905 million, lower than $122.743 million during Q3FY18.
.png)
Q3FY19 Financial Highlights (Source: Company Website)
Bi-furcation of Revenue: The company generates revenue from – (a) Product, (b) Subscription, and (c) Support and professional services. The Product includes Company's hardware and perpetual software products based on cloud and hardware. Subscription offers several products by subscription, either through term-based license agreements or as a service through its cloud-based Silverline platform. Support and professional services constitute telephonic support, updates, repair or replacement of any damaged product or component.
Revenue from Products and Service segments constituted ~44.2% and ~55.8% during the quarter. Product revenue during the quarter came in at $248.93 million as compared to $238.83 million in Q3FY18 while Service revenue stood at $314.46 million, higher from $303.37 million on pcp basis.
.png)
Q3FY19 Net Revenue constituents and proportion (Source: Company Reports)
Cost of net product revenues: Cost of net product revenues primarily constitutes finished products bought from the contract manufacturers and several manufacturing overheads. It also includes freight, warranty, provisions for excess and obsolete inventory and amortization. Cost of net product revenues during the quarter decreased ~1.8% on pcp, aided by a change in product mix. Cost of net product revenue during the quarter stood at $44.33 million as compared to $45.16 million in Q3FY18.
Cost of net service revenues: It consists of staff salaries and related benefits like travel, facilities and depreciation expenses. For Q3FY19, cost of net service revenues stood at $46.43 million as compared to $45.84 million. This segment witnessed an improvement in margin, driven by the scalability of the existing customer support infrastructure and higher revenue from maintenance contracts. Professional services headcount at the end of June 2019 increased to 926 from 906 at the end of June 2018.
In Q3FY19, gross profit came in at $472.627 million as compared to $451.194 million in Q3FY18, representing ~83.9% gross margin as compared to ~83.2% in previous corresponding year.
.png)
Cost of revenue and Gross margin and its proportion to Total Revenue (Source: Company Reports)
Sales and marketing expense: Sales and marketing expenses include salaries, commissions and related benefits related to the marketing staff along with the costs of several marketing programs. The company reported sales and marketing at $195.85 million, an increase of ~18.1% on pcp, which was primarily driven by $15.8 million expense in personnel costs during the quarter. Headcount in sales and marketing at the end of June 2019 stood at 2,092, higher from June 2018 figure of 1,721. In percentage terms, this segment stood at ~34.8% of the total revenue.
Research and development expense: The major components of R&D cost are salaries and benefits related to the product development personnel, prototype materials and other related along with depreciation. Research and development expenses during Q3FY19 came in at $116.89 million, increased ~24.3% from Q3FY18 due to an increase of $17.9 million in personnel costs. Research and development stood at ~20.7% of the total revenue.
General and administrative expense: General and administrative expenses consist of the staff salaries, benefits and related expenses accounted for executives of several functional segments like human resources, legal, IT, Finance and other third parties. This segment soared ~45.1% on pcp basis due to an additional $7.8 million fees paid to outside consultants for legal, accounting and tax services. Headcount from this segment during the quarter increased to 581 from 467 in Q3FY18.
.png)
Constituents of Operating Expenses and their Proportions (Source: Company Reports)
Nine-Months Overview: Revenue for nine-month of the financial year 2019 stood at $1,652.06 million as compared to $1,598.7 million during 9MFY18 while bottom-line stood at $332.89 million as compared to $320.81 million on pcp. Sales and marketing expenses during the first nine months of FY19 increased by 5.4% pcp to $531.06 million while research and development expense grew by 12.6% pcp to $305.246 million. Sales and marketing included $15.7 million as personnel costs and $3.7 million of higher corporate costs due shift of the company’s headquarter. Research and development head included a personnel cost of $19.7 million. During the nine months, general and administrative was increased by 23.4% on pcp basis to $146.34 million, primarily due to fees paid to outside consultants for the acquisition of Nginx. Sales and marketing represented 32.1% of total income while research and development, and General and administrative constituted 18.5% and 8.95 of the total revenue, respectively.
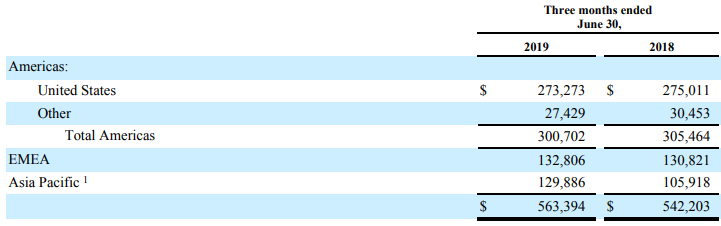
Segments as per Geography: The Company operates its business in three main geographic regions: the Americas (primarily the United States); Europe, the Middle East, and Africa (EMEA); and the Asia Pacific region (APAC). During Q3FY19, revenue from the Americas came in at $300.7 million, declined from $305.46 million in previous corresponding quarter, representing ~53.37% of the total revenue. While revenue from EMEA and Asia Pacific stood at $132.81 million and $129.89 million, representing ~23.57% and ~23.05% of the total revenue.
Segments as per Geography (Source: Company Reports)
Q3FY19 Non-GAAP Financials: Net income for the third quarter of fiscal year 2019 was $151.5 million as compared to the $150.1 million on Q3FY18. Diluted EPS during the quarter stood at $2.52 as compared to $2.44 during Q3FY18. Non-GAAP net income for the third quarter of the fiscal year 2019 excluded facility-exit costs related to the Company’s headquarters move, and costs related to the acquisition of NGINX.
Top 10 Shareholders: The top 10 shareholders have been highlighted in the table, which together form around 37.15% of the total shareholding. The Fidelity Management & Research Company and M & G Investment Management Ltd. hold the maximum interests in the company at 6.94% and 6.23%, respectively.
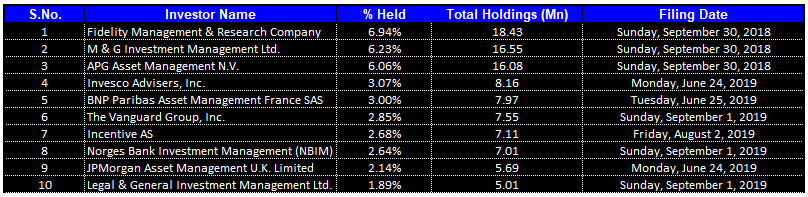
Top 10 Shareholders (Source: Thomson Reuters)
Key Metrics: The company posted decent margins in the third quarter of FY2019. Gross margin for Q3FY19 stood at 83.9%, higher than both Q2FY19 and Q3FY18. EBITDA and net margin for 3QFY19 came in at 21.5% and 15.2%, higher than the industry median of 13.1% and 2.5%, respectively. Return on Equity (ROE) stood at 5.6% in Q3FY19, higher than the industry median of 0.2%.
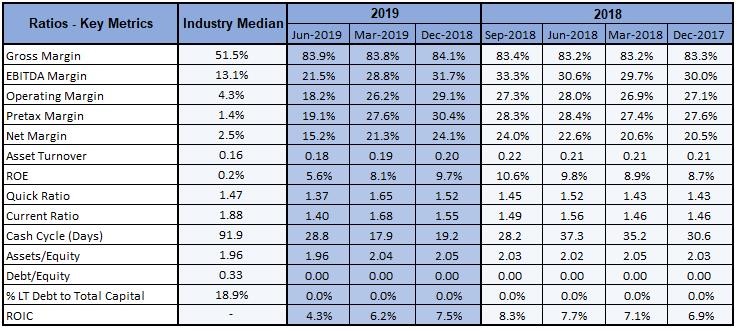
Key Metrics (Source: Thomson Reuters)
Strategic Acquisition to Support Topline Growth: During May 2019, FFIV successfully acquired Nginx, which operates in application delivery across modern applications. The acquisition will drive multi-cloud application services across all environments, providing the ease-of-use and flexibility that developers require. The development will also deliver the scale, security, reliability and enterprise readiness network operations teams demand. As per the merger agreement, at the effective time of the merger, the capital stock of Nginx and the vested outstanding and unexercised stock options in Nginx were cancelled and converted to the right to receive approximately $643.2 million in cash, subject to certain adjustments and conditions set forth in the Merger Agreement.
.png)
Key Valuation Metrics (Source: Thomson Reuters)
Outlook: The company provided guidance for the fourth quarter of fiscal year 2019 ending September 30, 2019. The Management expects to report revenue in the range of $577 million to $587 million with non-GAAP earnings in the range of $2.53 to $2.56 per diluted share in 4QFY19.
Valuation Methodologies
Method 1: Price to Cash Flow Multiple Approach:
.png)
P/CF Multiple Valuation (Source: Thomson Reuters)
Method 2: EV to Sales Multiple Approach:
.png)
EV/Sales Multiple Valuation (Source: Thomson Reuters)
Note: All forecasted figures and peers have been taken from Thomson Reuters, *NTM-Next Twelve Months
Stock Recommendation: At the current market price of $140.18, the stock is currently trading at a price to earnings multiple of 18.21x with a market capitalization of ~$8.43 billion. FFIV delivers cloud and security application services that pursue organizations to embrace the infrastructure, which they choose without sacrificing speed and control. Company’s strategy to capture growing demand for software-based or as-a-Service solutions through expansion in security offerings is likely to drive higher product penetration in the coming years. During the nine months of FY19, top-line and bottom-line posted a growth of 3.34% and 3.77%, respectively, with diluted EPS posting a growth of 6.78%. Considering the aforesaid facts, we have valued the stock using two relative valuation methods, i.e., Price to Cash Flow and Enterprise Value to Sales multiples and arrived at the target price for the stock in the range of $155.14 to $157.26 (lower double-digit upside (in % term). Hence, we recommend a “Buy” rating on the stock at the current market price of $140.18, up 1.82% on 25 September 2019.
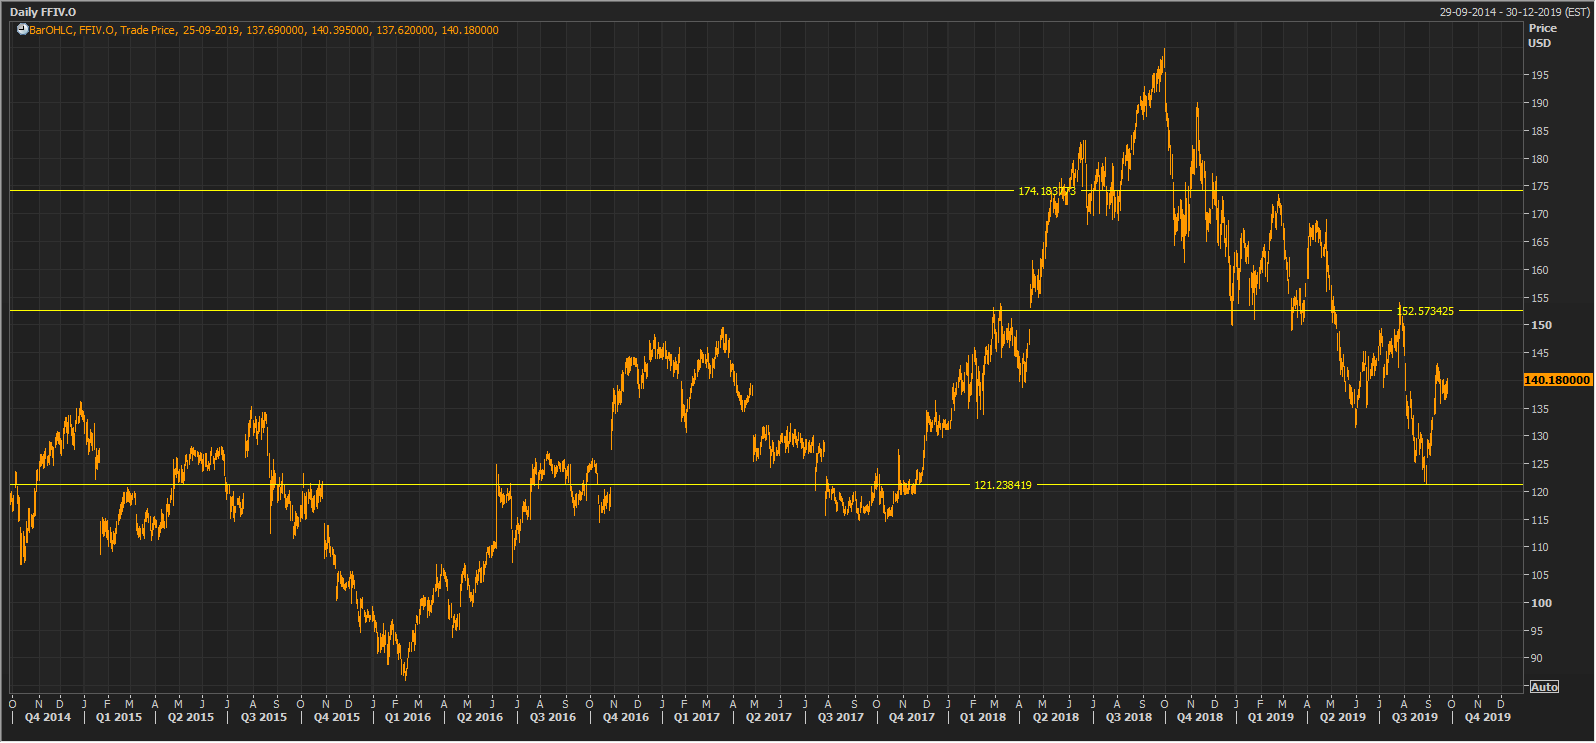
FFIV Daily Technical Chart (Source: Thomson Reuters)
Disclaimer
The advice given by Kalkine Pty Ltd and provided on this website is general information only and it does not take into account your investment objectives, financial situation or needs. You should therefore consider whether the advice is appropriate to your investment objectives, financial situation and needs before acting upon it. You should seek advice from a financial adviser, stockbroker or other professional (including taxation and legal advice) as necessary before acting on any advice. Not all investments are appropriate for all people. Kalkine.com.au and associated pages are published by Kalkine Pty Ltd ABN 34 154 808 312 (Australian Financial Services License Number 425376). The information on this website has been prepared from a wide variety of sources, which Kalkine Pty Ltd, to the best of its knowledge and belief, considers accurate. You should make your own enquiries about any investments and we strongly suggest you seek advice before acting upon any recommendation. Kalkine Pty Ltd has made every effort to ensure the reliability of information contained in its newsletters and websites. All information represents our views at the date of publication and may change without notice. To the extent permitted by law, Kalkine Pty Ltd excludes all liability for any loss or damage arising from the use of this website and any information published (including any indirect or consequential loss, any data loss or data corruption). If the law prohibits this exclusion, Kalkine Pty Ltd hereby limits its liability, to the extent permitted by law to the resupply of services. There may be a product disclosure statement or other offer document for the securities and financial products we write about in Kalkine Reports. You should obtain a copy of the product disclosure statement or offer document before making any decision about whether to acquire the security or product. The link to our Terms & Conditions has been provided please go through them and also have a read of the Financial Services Guide. On the date of publishing this report (mentioned on the website), employees and/or associates of Kalkine Pty Ltd do not hold positions in any of the stocks covered on the website. These stocks can change any time and readers of the reports should not consider these stocks as personalised advice.
Past performance is not a reliable indicator of future performance.
 Please wait processing your request...