Kalkine’s Global Travel & Leisure Report offers a comprehensive view of the key companies and evolving trends across the travel value chain covering countries including US, Canada, Australia, UK, and New Zealand. This includes airlines, hospitality chains, digital travel platforms, as well as the rapidly growing leisure, entertainment, and gaming segments that are redefining the way people engage with travel experiences.

- Global OTA market reached ~USD500 billion in gross bookings (2026), growing at 10-12% CAGR; top 4 players (Booking Holdings, Expedia Group, Trip.com, Airbnb) control 70-75% market share, with mobile bookings now representing 60-65% of transactions versus 45% in 2020.
- OTA business model generates blended take rates of 10-15% on accommodations (60-70% of revenue, 20-30% margins) and 5-8% on flights (20-25% of revenue, 3-5% margins); customer acquisition costs run USD50-150 per new booker, but repeat customers drive 70-80% of transactions with minimal incremental CAC.
- Competitive threats intensifying hotels recaptured 5-10% share through direct booking initiatives and loyalty programs; Google metasearch expansion threatens disintermediation; airlines commoditizing OTA distribution via NDC standards; alternative accommodations (Airbnb/Vrbo) growing 15-20% annually now represent 15-20% of bookings.
- Technology investment at 8-12% of revenue (USD3-5B annually for leaders) focuses on AI-driven personalization (15-20% conversion lift), mobile app optimization, dynamic pricing algorithms, and generative AI travel assistants; mobile now 60-65% of bookings, with continuous A/B testing driving incremental billions in gross bookings value.
- Post-pandemic recovery exceeded 2019 levels by 15-20% in 2026; structural shifts include flexible cancellation now standard (90% of bookings vs 50% pre-pandemic), "bleisure" segment at 25-30% of bookings (up from 15-20%), international travel at 85-90% of 2019 levels (lower than domestic 95-100%), and heightened regulatory scrutiny on market power and parity clauses.



- 2020 – Industry Near-Collapse and Liquidity Crisis: The OTA sector experienced catastrophic demand destruction, with gross bookings plummeting 70-80% YoY as global travel restrictions wiped out international tourism and business travel. Booking Holdings and Expedia Group collectively lost ~$4.5 billion in operating income, forced to raise $12+ billion in emergency financing while burning $300-400 million monthly in cash. Refund volumes overwhelmed customer service infrastructure (5-10x normal call volumes), and commission clawbacks from cancellations devastated cash flow. Companies implemented 20-30% workforce reductions, suspended marketing spend by 50-70%, and negotiated supplier payment deferrals. Alternative accommodation platforms (Airbnb, Vrbo) proved more resilient with domestic/drive-to destinations maintaining 40-50% of 2019 bookings versus hotels' 20-30%.
- 2021 – Domestic Recovery and Mobile-First Acceleration: Gross bookings recovered to 40-50% of 2019 levels, driven entirely by domestic leisure travel in U.S./Europe and pent-up demand for road trips and outdoor experiences. Alternative accommodations captured 60-70% market share of recovery bookings as travelers avoided dense urban hotels, accelerating the "Airbnb shift" that would permanently reshape the industry. OTAs pivoted to flexible cancellation as standard (offering free cancellation on 80-90% of inventory versus 50% pre-pandemic), sacrificing margin for conversion as consumer confidence remained fragile. Mobile bookings surged to 55-60% of transactions (from 45% in 2019) as last-minute, spontaneous travel dominated. Marketing efficiency improved dramatically—customer acquisition costs dropped to $30-50 (from $100-150 in 2019) as Google/Meta ad rates collapsed, allowing OTAs to rebuild customer bases profitably.
- 2022 – Revenge Travel Boom and Pricing Power Returns: International borders reopened, unleashing explosive pent-up demand that drove gross bookings to 85-90% of 2019 levels with revenue exceeding pre-pandemic on higher take rates. Average booking values increased 15-25% as consumers traded up to premium accommodations and longer stays, while OTAs successfully raised commission rates by 100-200 basis points by offering flexible terms and loyalty rewards that suppliers valued. Operating margins expanded rapidly—Booking Holdings achieved 35-40% EBITDA margins (versus 45-50% in 2019 but on much lower marketing spend), while Expedia reached 25-30%. Supply constraints benefited OTAs as hotel inventory shortages (staffing issues kept 10-15% of rooms offline) and flight capacity reductions created scarcity that drove consumers to aggregators for availability rather than direct booking. The shift to package bookings accelerated (now 25-30% of transactions versus 20% historically) as travelers sought convenience and bundling economics.
- 2023 – Full Recovery, Margin Restoration, and Google Threat Intensifies: Gross bookings exceeded 2019 levels by 5-10%, reaching $480-500 billion globally, with international travel fully recovered and "bleisure" (business-leisure hybrid) emerging as 25-30% of bookings versus 15-20% pre-pandemic. OTA revenues surpassed $70 billion industry-wide as companies restored marketing spend to 30-35% of revenue (still below 40-45% historically) while maintaining improved unit economics. Alternative accommodations reached 20-25% of total lodging bookings permanently, forcing traditional OTAs to integrate more Airbnb-style inventory. Google launched aggressive travel metasearch expansion, capturing 30-35% of travel research traffic and threatening OTA traffic acquisition costs—leading to antitrust investigations in EU/U.S. Customer acquisition costs normalized at $80-120, higher than 2021 lows but still below 2019, as competition for digital traffic intensified. Airlines' NDC (New Distribution Capability) rollout began pressuring air booking commissions down 50-100 basis points.
- 2024 – Profitability Peak, AI Integration, and Supplier Tensions: The OTA industry generated record operating income exceeding $18-20 billion globally, with Booking Holdings alone producing $8+ billion EBIT on revenue approaching $25 billion. Gross bookings reached $520-540 billion, growing 8-10% as international travel exceeded 2019 by 15-20% while domestic moderated. Technology investment accelerated to 10-12% of revenue as companies deployed generative AI for customer service (reducing live agent interactions by 30-40%), dynamic pricing optimization, and personalized recommendations that drove conversion improvements of 15-20%. Direct booking initiatives by hotel chains (Marriott Bonvoy, Hilton Honors) recaptured 5-8 percentage points of share through aggressive loyalty marketing and "book direct" campaigns, though OTAs maintained 55-60% online market share. Mobile penetration hit 62-65% of bookings, with app users generating 2-3x higher lifetime value than web-only customers. Regulatory scrutiny intensified—EU investigations into pricing parity clauses and market dominance, plus U.S. DOJ reviews of mergers and supplier relationships.
- 2025 – Moderate Growth, Structural Headwinds, and Platform Evolution: Industry gross bookings are projected to reach $560-580 billion, growing 6-8% as travel demand normalizes and easy recovery comps disappear. International travel growth moderates to 5-7% as pent-up demand exhausts, while "bleisure" stabilizes at 28-30% of bookings as remote work policies solidify. OTAs face mounting pressures: Google's travel integration captured 35-40% of initial search traffic, forcing customer acquisition costs up 10-15%; hotel direct bookings continue growing 5-10% faster than OTA channels as loyalty programs mature; airline NDC adoption reaches 40-50% of bookings, reducing air commissions by another 50-100 basis points; and alternative accommodations approach 25% of lodging inventory with Airbnb/Vrbo now fully competitive on supply breadth. Companies respond by doubling down on AI-powered personalization, expanding connected trip offerings (bundling flights, hotels, cars, activities for 25-30% margin premiums), and exploring Web3 loyalty programs. Margin compression begins—industry EBITDA margins decline 100-200 basis points to 28-30% as marketing costs rise and commission pressure intensifies. The industry shifts from recovery-driven growth to structural competition for share in a maturing digital travel market, favoring platforms with superior technology, diversified inventory (including alternative accommodations), and loyalty ecosystems—an environment where scale advantages compound but require continuous innovation investment.
Kalkine’s Global Travel & Leisure Report covers the Investment Highlights, Key Financial Metrics, Risks, Technical Analysis along with the Valuation, Target Price, and Recommendation on Expedia Group Inc (NASDAQ: EXPE).
Section 1: Company Overview and Fundamentals Insights
Overview: Expedia Group, Inc. (NASDAQ: EXPE) is an online travel company. The Company’s segments include B2C, B2B, and trivago. The B2C segment provides a full range of travel and advertising services to its customers worldwide through a variety of consumer brands including: Expedia.com, Hotels.com, Vrbo, Orbitz, Travelocity, Wotif Group, ebookers, CheapTickets, Hotwire.com and CarRentals.com.
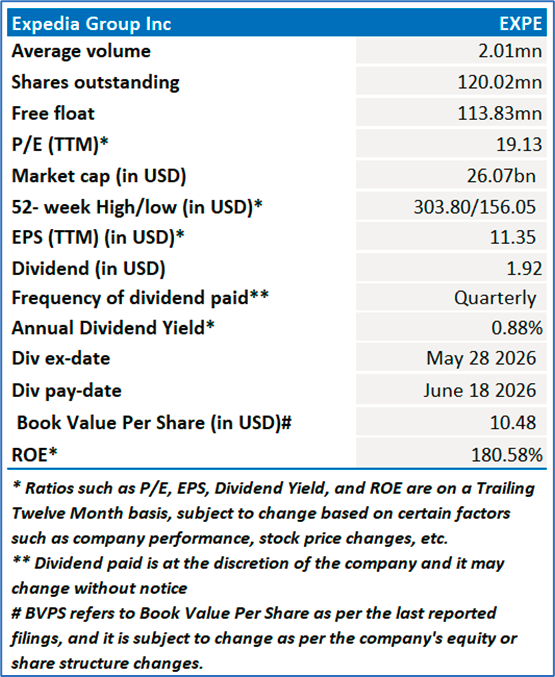
Kalkine’s Global Travel and Leisure Report covers the Investment Highlights, Key Financial Metrics, Risks, and Technical Analysis along with the Valuation, Target Price, and Recommendation on the stock.
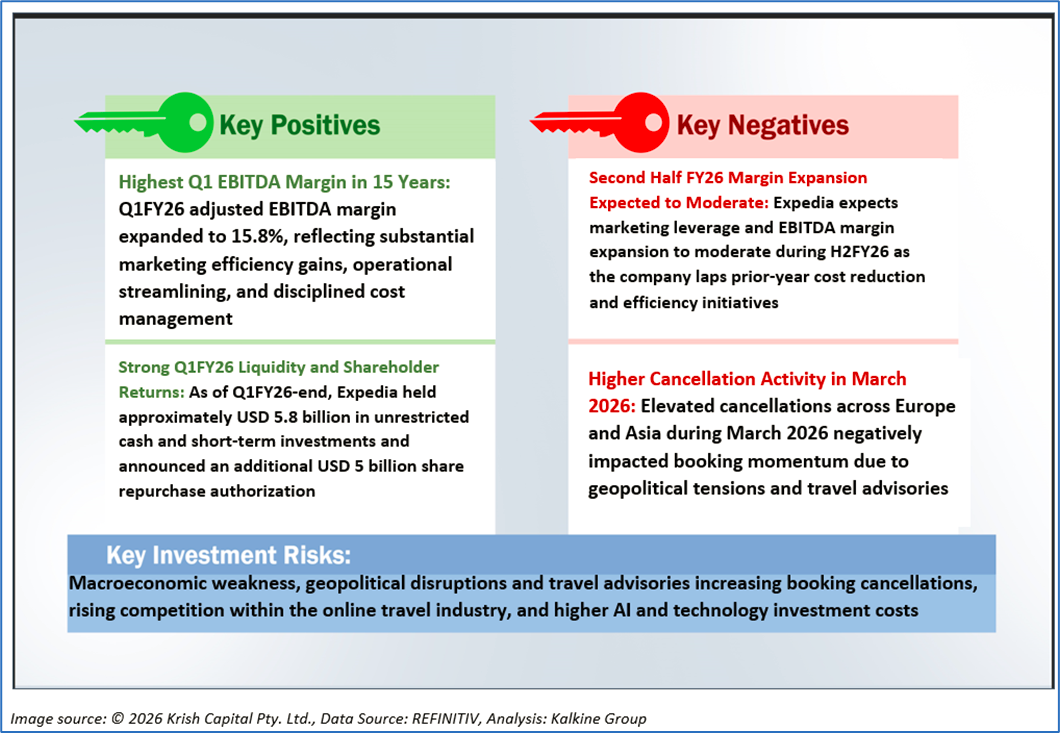
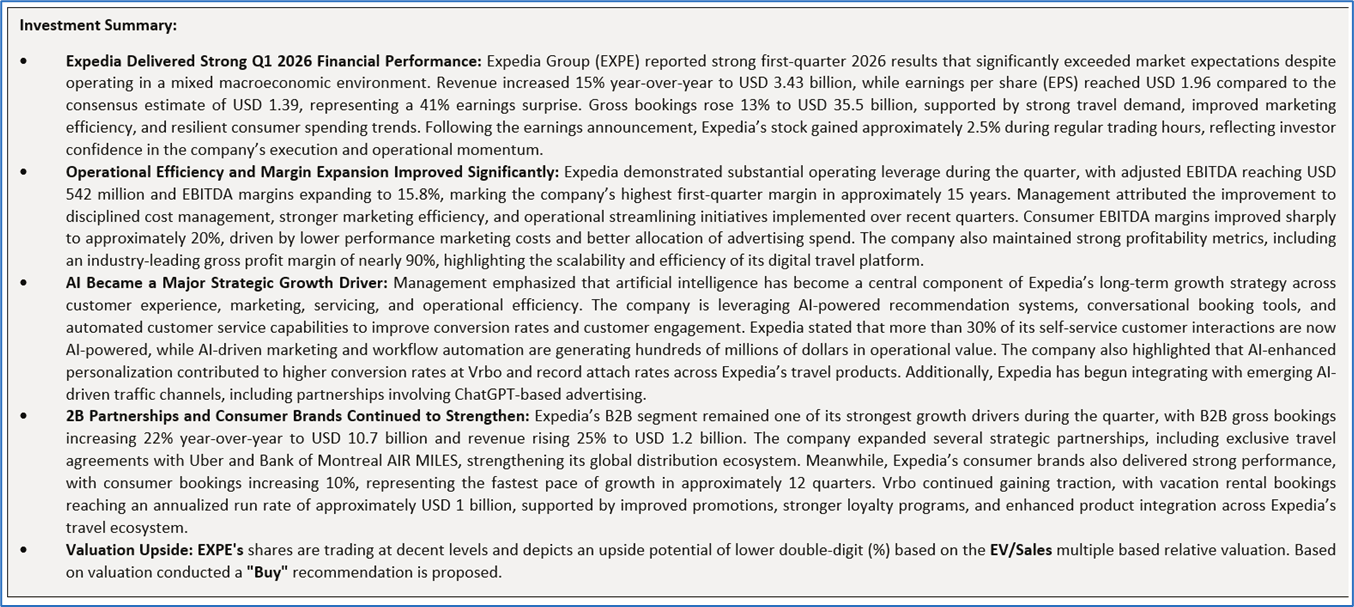
1.2 The Key Positives, Negatives, Investment Highlights, and Risks
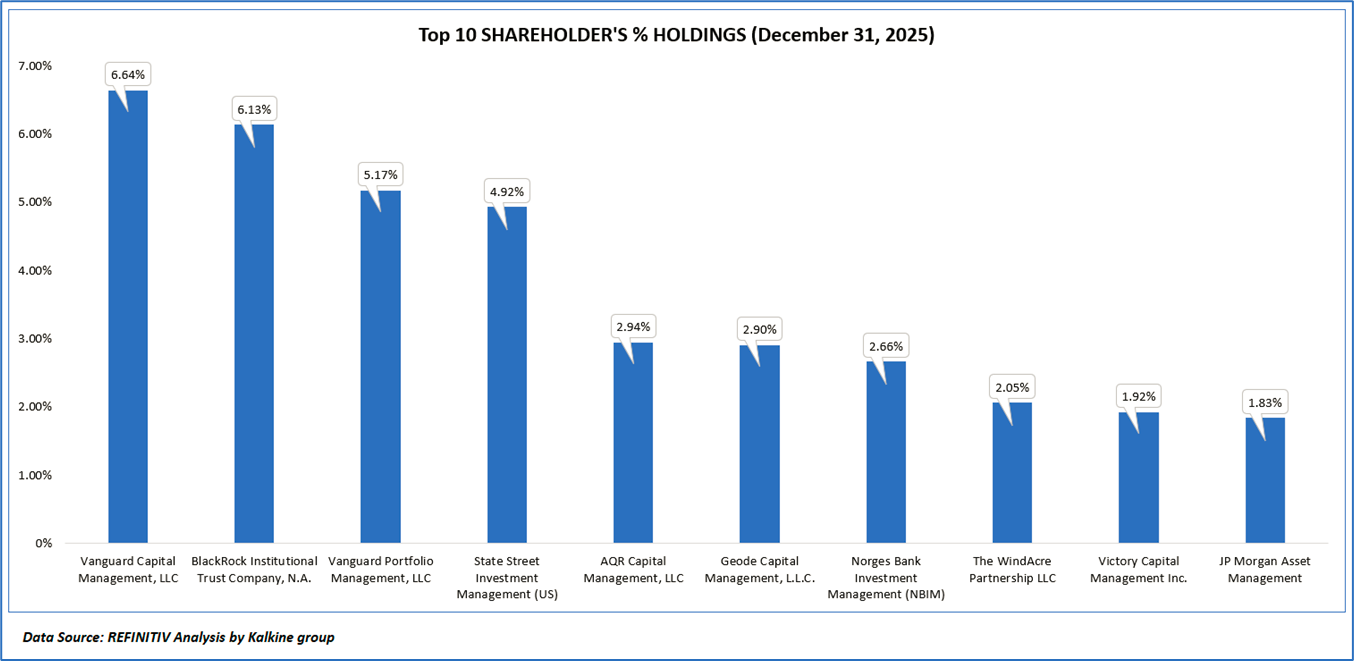
1.3 Top 10 Shareholders:
The top 10 shareholders together form ~37.16% of the total shareholding, signifying concentrated holding. The Vanguard Group, Inc and BlackRock Institutional Trust Company, N.A. hold maximum stakes of 6.64% and 6.13%, respectively.
1.4 Key Metrics:
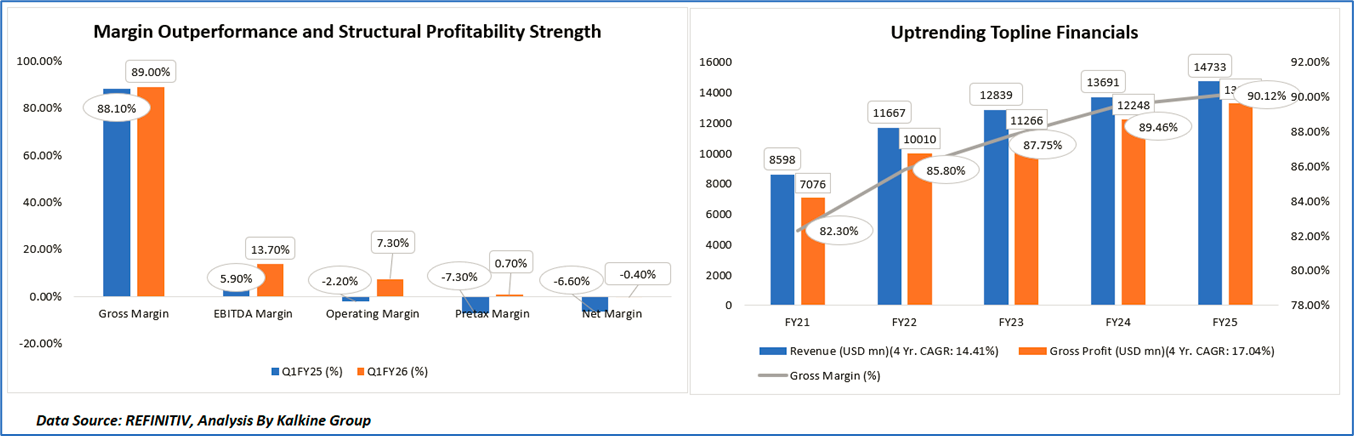
- Revenue Growth and Business Expansion Analysis: Expedia Group (EXPE) demonstrated strong and consistent top-line expansion over FY21–FY25, reflecting the continued recovery and structural growth of global travel demand alongside improved execution across its platform ecosystem. Revenue increased from approximately USD 8.6 billion in FY21 to USD 14.7 billion in FY25, representing a robust 4-year CAGR of 14.41%. The growth was supported by increasing gross bookings, expanding B2B partnerships, rising room-night demand, improving travel trends, and stronger monetization across Expedia, Vrbo, Hotels.com, and API-driven distribution channels. The company’s ability to sustain double-digit growth through varying macroeconomic conditions highlights the resilience and scalability of its diversified online travel platform.
- Gross Profitability and Margin Expansion Analysis: Gross profit expanded from approximately USD 7.1 billion in FY21 to USD 13.3 billion in FY25, reflecting a strong 4-year CAGR of 17.04%, which outpaced revenue growth over the same period. Gross margin improved consistently from 82.3% in FY21 to 90.12% in FY25, demonstrating substantial operating leverage and the efficiency of Expedia’s asset-light digital marketplace model. The margin expansion reflects stronger contribution from higher-margin B2B operations, improved marketing efficiency, increased direct traffic, and ongoing optimization of customer servicing and payment infrastructure. The sustained increase in gross margin also indicates Expedia’s ability to scale revenue faster than associated operating costs while benefiting from technology-driven efficiencies and AI-enabled productivity gains.
- Q1FY26 Profitability Improvement Analysis: Expedia’s quarterly profitability metrics improved materially during Q1FY26 compared with Q1FY25, reflecting stronger operational discipline and significant margin recovery. EBITDA margin expanded sharply from 5.9% in Q1FY25 to 13.7% in Q1FY26, supported by improved marketing leverage, cost optimization initiatives, and higher revenue flow-through. Operating margin improved substantially from negative 2.2% to positive 7.3%, indicating meaningful recovery in core operating profitability as the company benefited from lower relative operating expenses and stronger booking volumes. Pretax margin also improved from negative 7.3% to positive 0.7%, demonstrating a significant reduction in profitability pressure despite ongoing macroeconomic volatility and geopolitical disruptions during the quarter.
- Net Margin Recovery and Financial Outlook: Net margin improved significantly from negative 6.6% in Q1FY25 to negative 0.4% in Q1FY26, indicating that Expedia is approaching normalized profitability levels following prior-period earnings pressure. Although the company still reported a marginal net loss, the sharp improvement reflects stronger EBITDA generation, improved operational efficiency, disciplined cost management, and continued recovery in travel demand trends. The financial trajectory suggests that Expedia’s ongoing investments in AI-powered personalization, B2B expansion, and marketing optimization are increasingly translating into higher profitability and scalable earnings growth. Going forward, continued margin expansion, disciplined capital allocation, and sustained free cash flow generation are expected to remain key drivers supporting long-term shareholder value creation.
Section 2: Business Updates, Financial and Operational Highlights
2.1 Recent Business Updates:

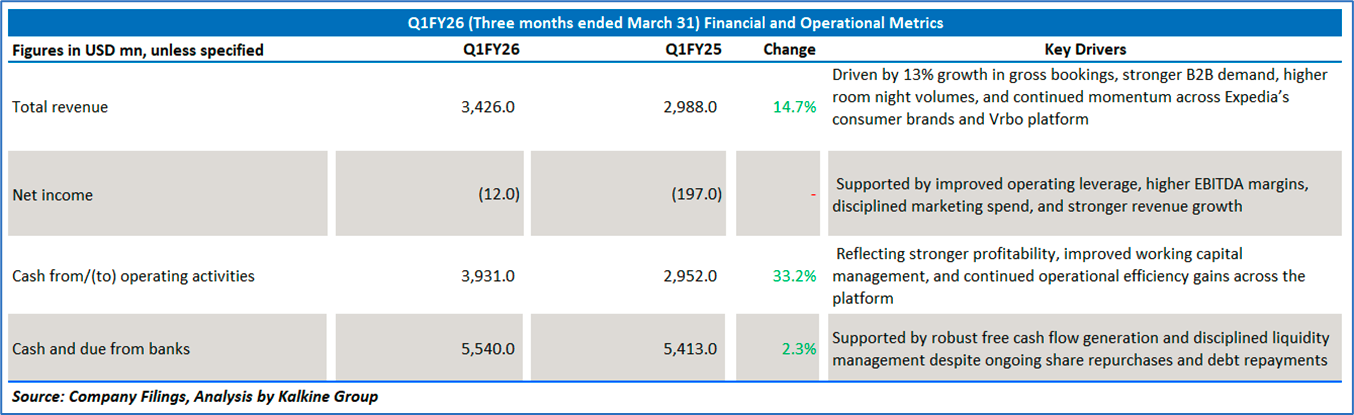
2.2 Q1FY26 (Three months ended March 31, 2026): Below are some key financial highlights:
Section 3: Key Risks and Outlook:
Section 4: Stock Recommendation Summary
4.1 Price Performance and Technical Summary
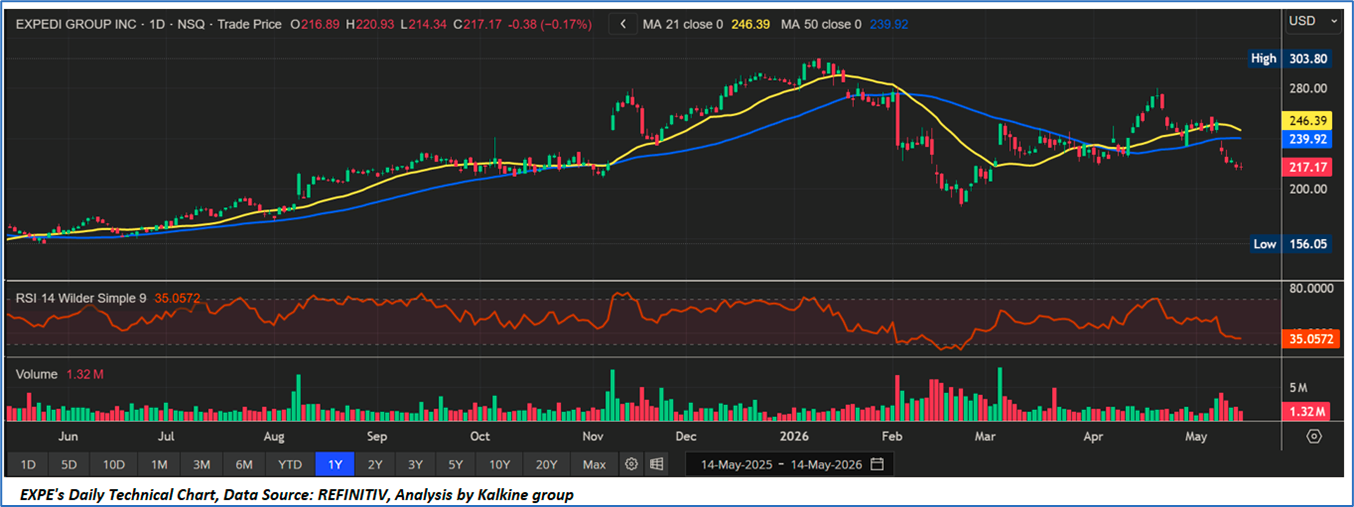
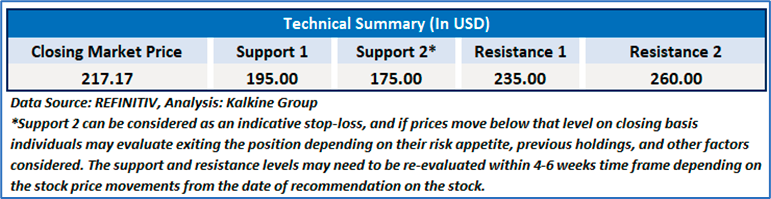
- Trend Structure and Moving Average Analysis: Expedia Group (EXPE) has recently entered a corrective consolidation phase after failing to sustain momentum near its 52-week high around USD 303.80. The stock is currently trading near USD 217.17, notably below both its 21-day moving average (USD 246.39) and 50-day moving average (USD 239.92), reflecting weakening short-term and medium-term momentum. The downward crossover between shorter-term and longer-term moving averages indicates increasing bearish pressure following the sharp pullback witnessed since February 2026. Price action also suggests that the stock has broken below a prior consolidation zone, increasing the importance of nearby support levels.
- Momentum Indicators and Volume Behaviour: The Relative Strength Index (RSI-14) is currently positioned near 35.1, approaching oversold territory but still remaining above the critical 30 threshold. This indicates weakening momentum and persistent selling pressure, although the stock may begin approaching technical stabilization if RSI continues to compress toward oversold levels. Trading volume patterns during recent declines suggest elevated distribution activity, particularly during the breakdown from the USD 240–USD 250 range. However, recent sessions show somewhat moderating selling volumes, which may indicate that aggressive downside momentum is beginning to cool. Sustained improvement in RSI and stronger accumulation volumes would be required to confirm any meaningful reversal.
- Key Support, Resistance, and Technical Outlook: From a technical perspective, immediate support for EXPE is visible near the USD 200–USD 205 range, which previously acted as a demand zone during March 2026. A failure to hold this region could expose the stock to further downside toward the broader long-term support area near USD 180 and potentially the 52-week low zone around USD 156. On the upside, immediate resistance is now positioned near the 50-day moving average around USD 240, followed by stronger resistance near the USD 246–USD 250 range where the 21-day moving average and prior supply zones converge. Overall, the technical structure currently reflects a cautious near-term outlook, with the stock requiring sustained recovery above key moving averages and improving momentum indicators to re-establish a constructive bullish trend.
4.2 Fundamental Valuation
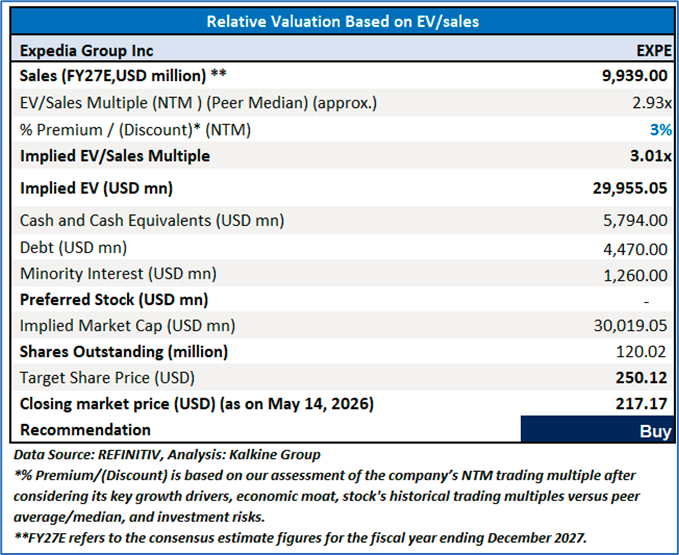
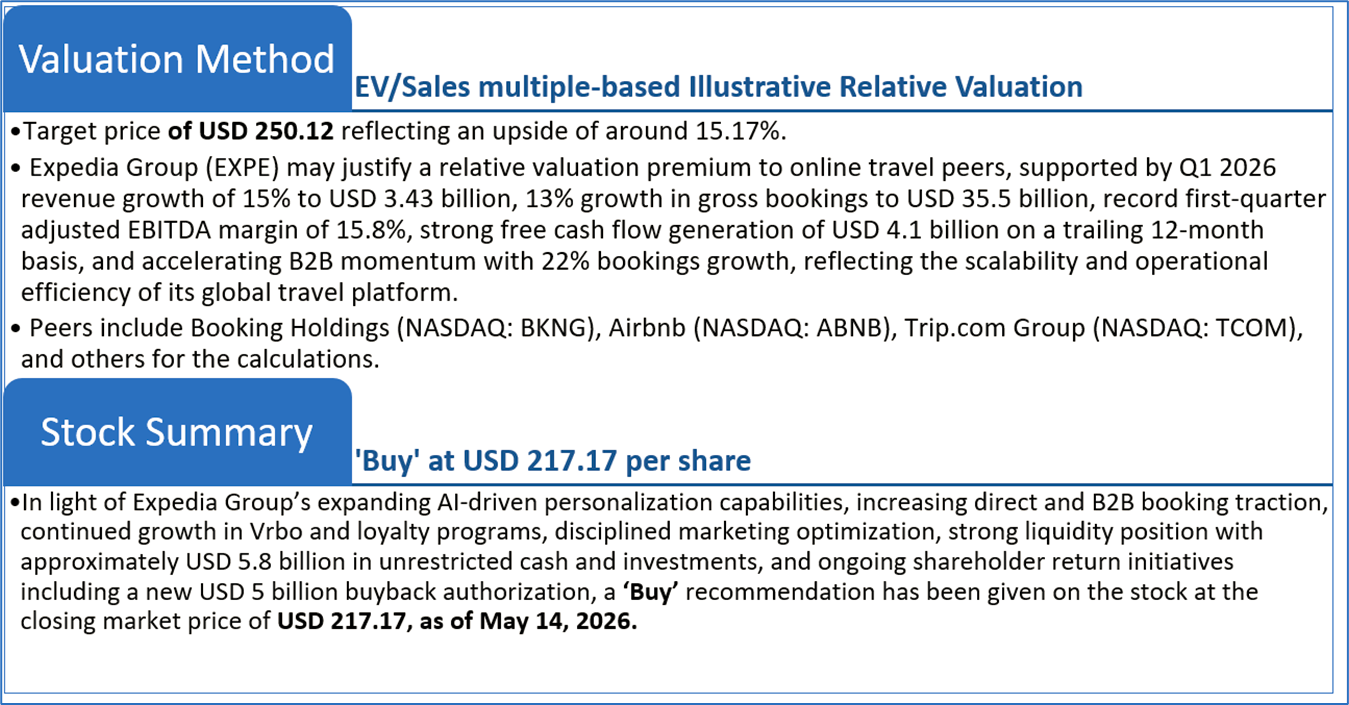
Valuation Methodology: EV/Sales Multiple Based Relative Valuation (Illustrative)
Markets are trading in a highly volatile zone currently due to certain macro-economic issues and geopolitical tensions prevailing. Therefore, it is prudent to follow a cautious approach while investing.
Note 1: Past performance is neither an indicator nor a guarantee of future performance.
Note 2: The reference date for all price data, currency, technical indicators, support, and resistance levels is 14 May 2026. The reference data in this report has been partly sourced from REFINITIV.
Note 3: Investment decisions should be made depending on an individual's appetite for upside potential, risks, holding duration, and any previous holdings. An 'Exit' from the stock can be considered if the Target Price mentioned as per the Valuation and or the technical levels provided has been achieved and is subject to the factors discussed above.
Note 4: Dividend Yield may vary as per the stock price movement.
Note 5: Kalkine reports are prepared based on the stock prices captured either from REFINITIV or Trading View. Typically, REFINITIV or Trading View may reflect stock prices with a delay which could be a lag of 25-30 minutes. There can be no assurance that future results or events will be consistent with the information provided in the report. The information is subject to change without any prior notice.
Technical Indicators Defined: -
Support: A level at which the stock prices tend to find support if they are falling, and a downtrend may take a pause backed by demand or buying interest. Support 1 refers to the nearby support level for the stock and if the price breaches the level, then Support 2 may act as the crucial support level for the stock.
Resistance: A level at which the stock prices tend to find resistance when they are rising, and an uptrend may take a pause due to profit booking or selling interest. Resistance 1 refers to the nearby resistance level for the stock and if the price surpasses the level, then Resistance 2 may act as the crucial resistance level for the stock.
Stop-loss: It is a level to protect further losses in case of unfavourable movement in the stock prices.
Disclaimer-
This report (“Report”) has been issued by Kalkine Pty Limited (ABN 34 154 808 312) (Australian financial services licence number 425376) (“Kalkine”) and prepared by Kalkine and its related bodies corporate who are authorised to provide general financial product advice. Kalkine.com.au and its associated pages are published by Kalkine.
Any advice provided in this Report is general advice only and does not take into account your objectives, financial situation or needs. You should therefore consider whether the advice is appropriate for your objectives, financial situation and needs before acting upon it.
There may be a Product Disclosure Statement, Information Memorandum or other offer document (“Offer Document”) for the securities or other financial products referred in this Report. You should obtain a copy of the relevant Offer Document and consider it before making any decision about whether to acquire the security or financial product.
Kalkine strongly recommends that you seek advice from a financial adviser, stockbroker or other professional (including taxation and legal advice) before acting on any of the general advice in this Report or on the Kalkine website. Not all investments are appropriate for all people.
The information in this Report and on the Kalkine website has been prepared from a wide variety of sources, which Kalkine, to the best of its knowledge and belief, considers accurate. Kalkine has made every effort to ensure the reliability of the information contained in its reports (including this Report), newsletters and websites. All information represents our views at the date of publication and may change without notice.
The information in this Report does not constitute an offer to sell securities or other financial products or a solicitation of an offer to buy securities or other financial products. Our reports contain general recommendations to invest in securities and other financial products. Kalkine is not responsible for, and does not guarantee, the performance of, or returns on, any investments mentioned in this Report.
Kalkine does not issue, sell or deal in any financial products.
This Report may contain information on past performance of particular investments. Past performance is not a reliable indicator of future performance. Returns stated do not take into account transaction costs and taxes. To the extent permitted by law, and excluding any dishonesty or gross negligence by Kalkine, Kalkine disclaims and excludes all liability for any direct, indirect, implied, punitive, special, incidental or other consequential loss or damage arising from the use of or reliance on this Report, the Kalkine website and any information published on the Kalkine website without any warranties or representations by Kalkine to you. To the extent the law prohibits or limits this exclusion, Kalkine limits its liability to the resupply of services.
Please also read our Terms & Conditions and Financial Services Guide for further information. Employees and/or associates of Kalkine and its related entities may hold interests in the securities or other financial products covered in this Report or on the Kalkine website. Any such employees and associates are required to comply with certain, procedures and disclosures as required by law.
Kalkine Media Pty Ltd, an affiliate of Kalkine Pty Ltd, may have received, or be entitled to receive, financial consideration in connection with providing information about certain entity(s) covered on its website including entities covered in this Report.
Copyright 2026 Krish Capital Pty. Ltd. (ABN 61629651510). All Rights Reserved. No part of this report, or its content, may be reproduced in any form without our prior consent.
Past performance is not a reliable indicator of future performance.

 CA
 NZ
 UK
 US
 IND

 AU

 Please wait processing your request...