This report is an updated version of the report published on 05 September 2025 at 01:25 PM AEST
Section 1: Company Overview, Low Carbon Emission Initiatives and Fundamentals
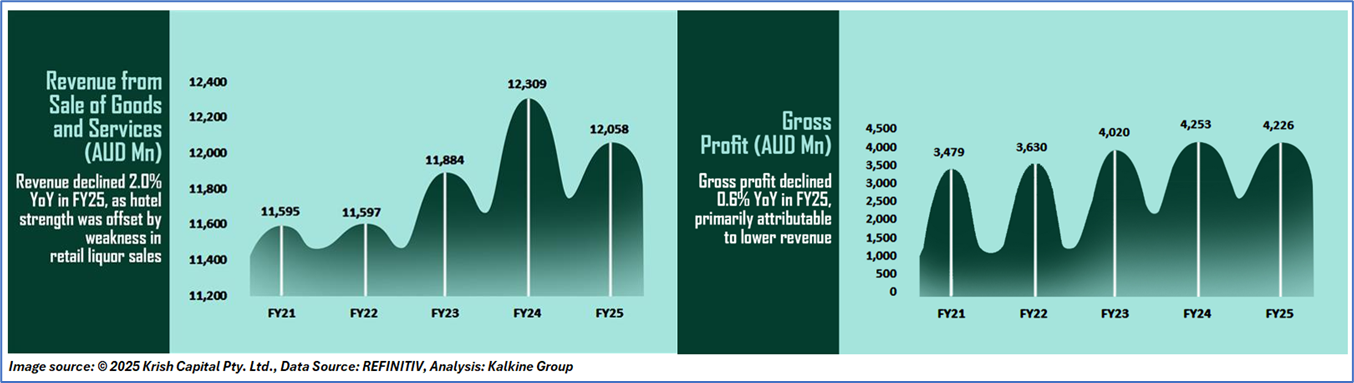
Section 1.1: Endeavour Group Limited (ASX: EDV) is Australia’s retail drinks and hospitality business. It operates well-known brands including Dan Murphy’s, BWS, ALH Hotels, and Pinnacle Drinks, supported by over 30,000 employees across Australia and New Zealand. Kalkine’s Low Carbon Research Report covers the Investment Highlights, Low Carbon Emission Initiatives, Key Financial Metrics, Risks, and Technical Analysis along with the Valuation, Target Price, and Recommendation on the stock.
Section 1.2: Why Low Carbon Emission Matters?
The shift toward a low-carbon economy is one of the most significant challenges of current time, spurred by the urgent need to combat climate change and reduce the environmental impact of corporate activities. This report covers the ASX-listed low-carbon emission company, Endeavour Group Ltd (ASX: EDV), that is committed to sustainability and responsible environmental practices.
Carbon and Waste Management - Key Metrics
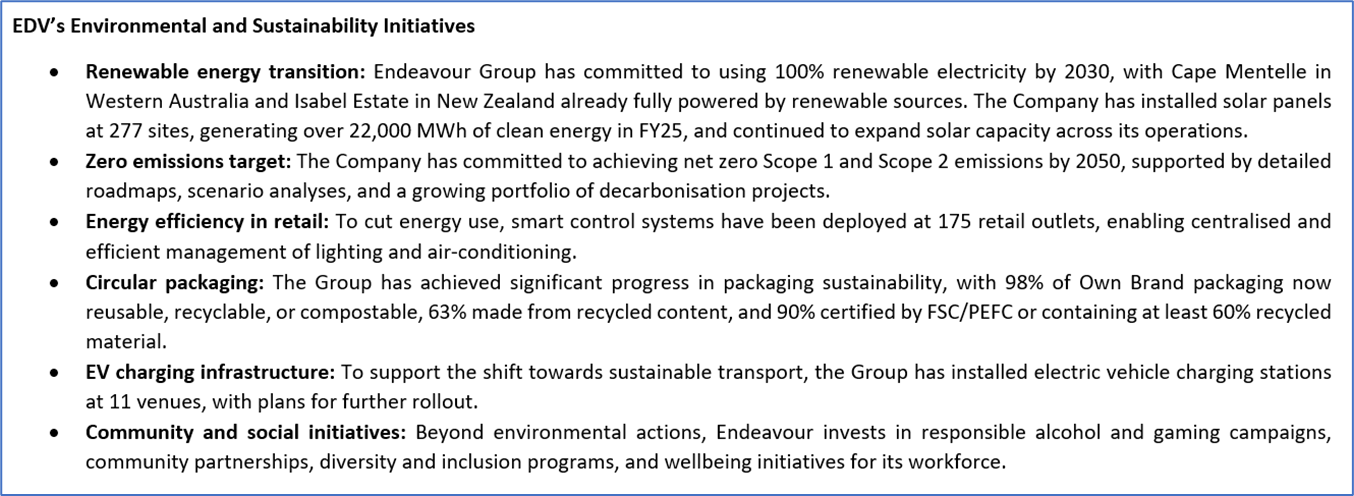
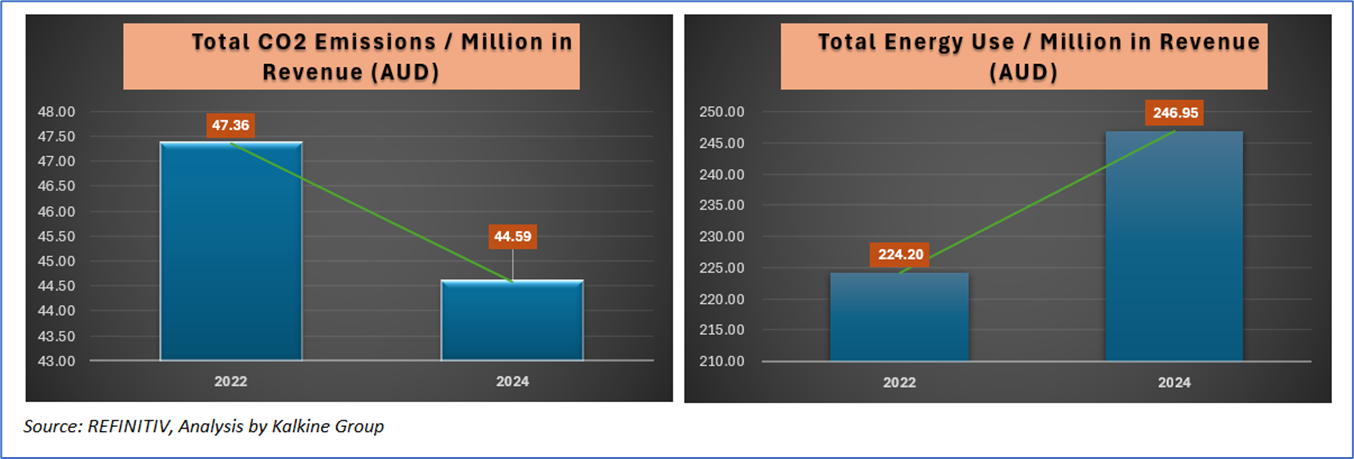
The image below highlights Endeavour Group’s progress and challenges in its environmental performance. Between 2022 and 2024, total CO₂ emissions per million AUD in revenue declined from 47.36 to 44.59, reflecting the company’s initiatives to decarbonise operations. This reduction demonstrates that EDV’s investment in renewable energy, solar expansion, and low-emission refrigeration systems are starting to deliver measurable results. It indicates improved carbon efficiency, with less greenhouse gas emitted for every unit of revenue generated. However, during the same period, total energy use per million AUD in revenue increased from 224.20 to 246.95. This suggests that while carbon intensity has improved, overall energy consumption relative to revenue has risen. In line with its sustainability strategy, EDV continues to address this challenge by expanding renewable energy adoption, installing smart energy control systems across retail outlets, and transitioning towards 100% renewable electricity by 2030. These steps are critical to ensuring that future growth is decoupled from energy intensity while maintaining the downward trajectory in carbon emissions.
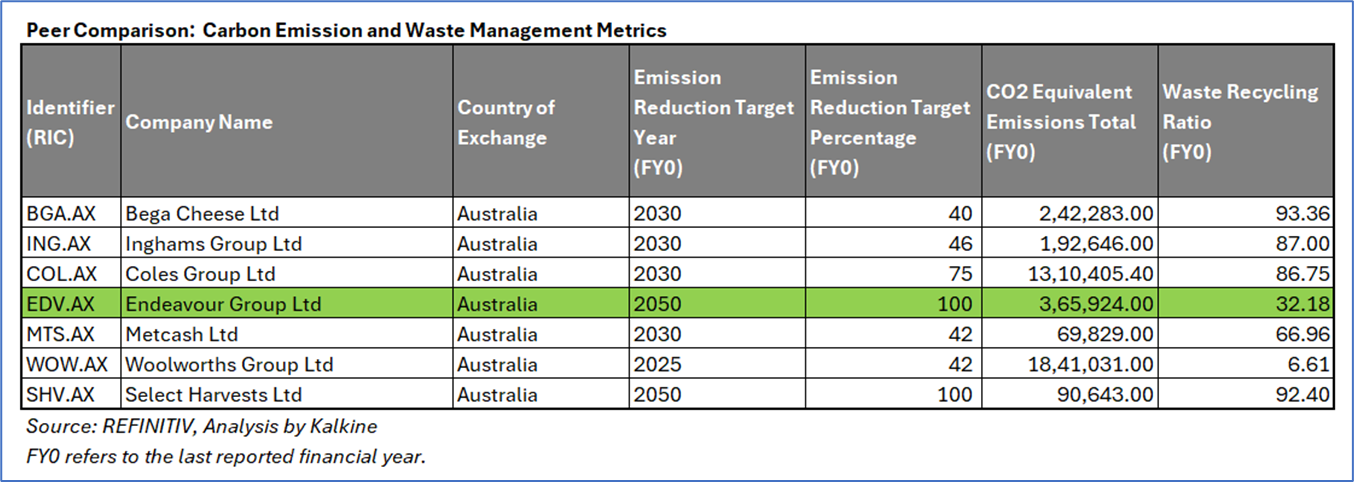
Peer Comparison: Carbon Emission and Waste Management Metrics
The peer comparison chart below highlighted that Endeavour Group has committed to achieving net zero Scope 1 and 2 emissions by 2050, making it one of the more ambitious long-term decarbonisation targets among its ASX peers. EDV reported 365,924 tonnes of CO₂ equivalent emissions, reflecting its large hospitality and retail footprint, but it has begun reducing its carbon intensity through initiatives such as transitioning to 100% renewable electricity by 2030, rolling out solar at 277 sites, adopting CO₂-based refrigeration systems, installing smart energy controls across retail outlets, and expanding EV charging stations. While its waste recycling ratio of 32.18% is below peers like Coles, Woolworths, and Bega, EDV is addressing this gap by ensuring 98% of Own Brand packaging is recyclable, reusable, or compostable, increasing recycled content in packaging, and introducing lightweight glass bottles. Overall, the company shows progress on emissions reduction and energy efficiency but will need to accelerate improvements in waste recycling and circularity to match industry leaders.
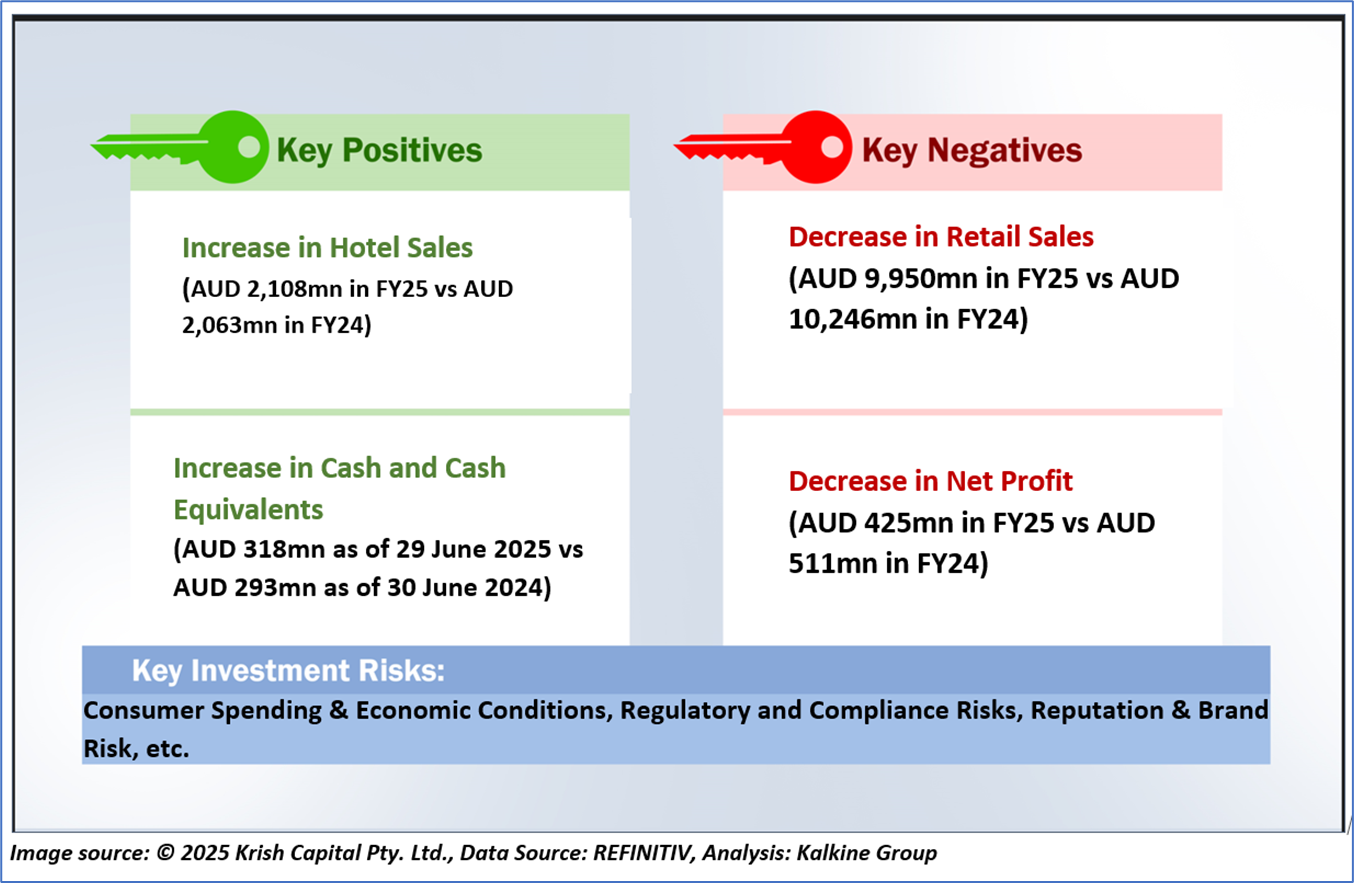
1.3 The Key Positives, Negatives, Investment Highlights, and Risks
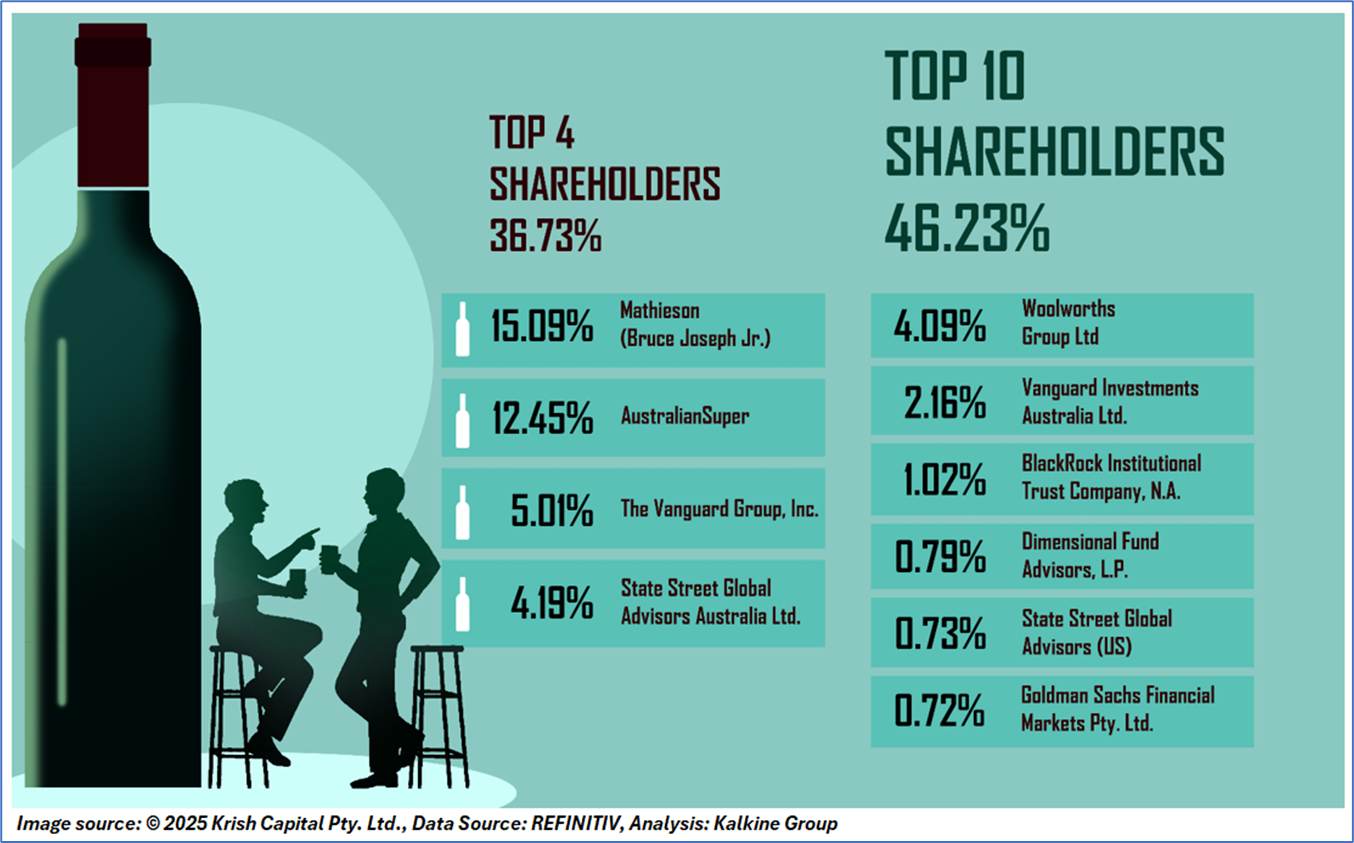
1.4 Top 10 Shareholders:
The top 10 shareholders together form ~46.23% of the total shareholding. Mathieson (Bruce Joseph Jr.), and AustralianSuper hold maximum stakes in the company at ~15.09% and ~12.45%, respectively.
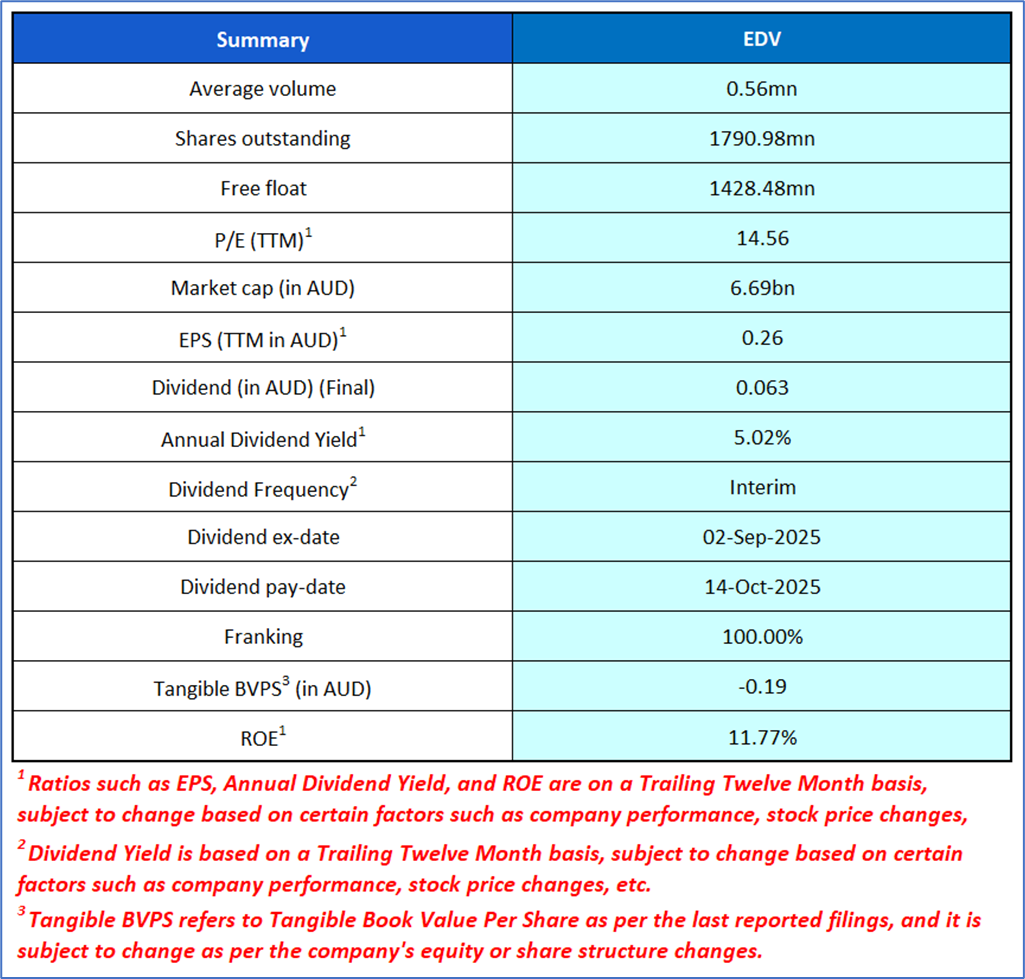
1.5 Key Metrics: In FY25, EDV's net margin stood at 3.5% vs industry median of 2.1%. Below are captured other metrics:
Section 2: Business Updates, Financial and Operational Highlights
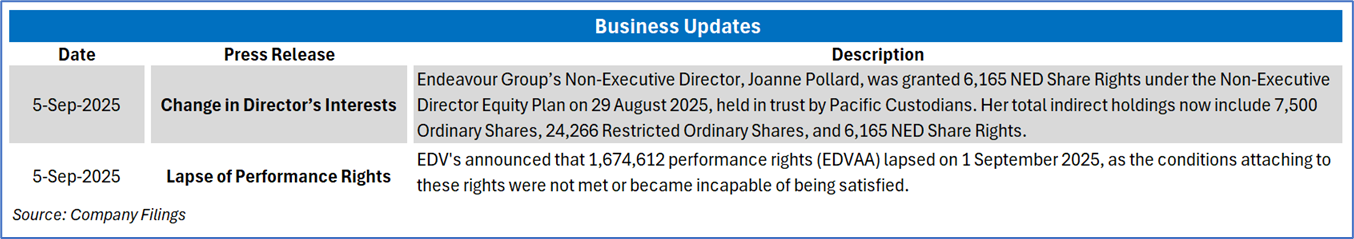
2.1 Recent Business Updates:
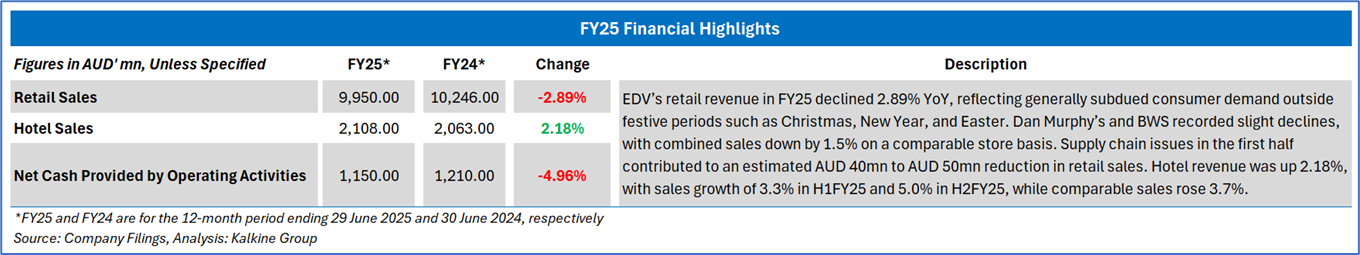
2.2 Results Highlights
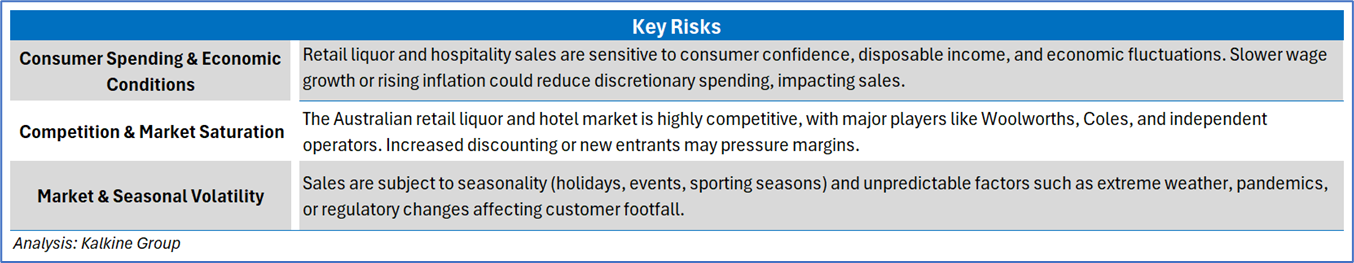
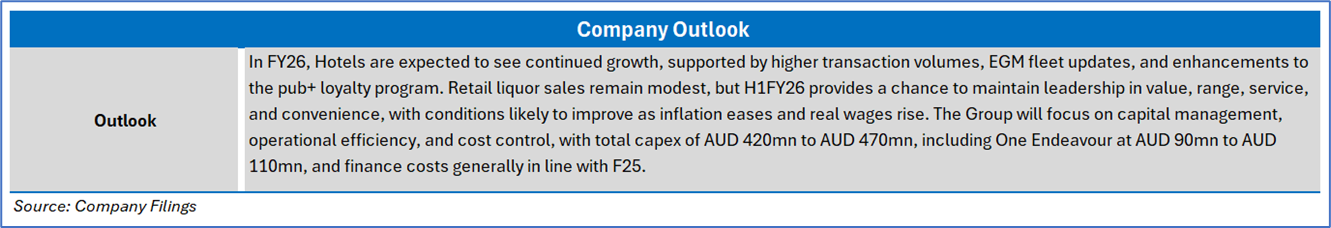
Section 3: Key Risks and Outlook:
Section 4: Stock Recommendation Summary
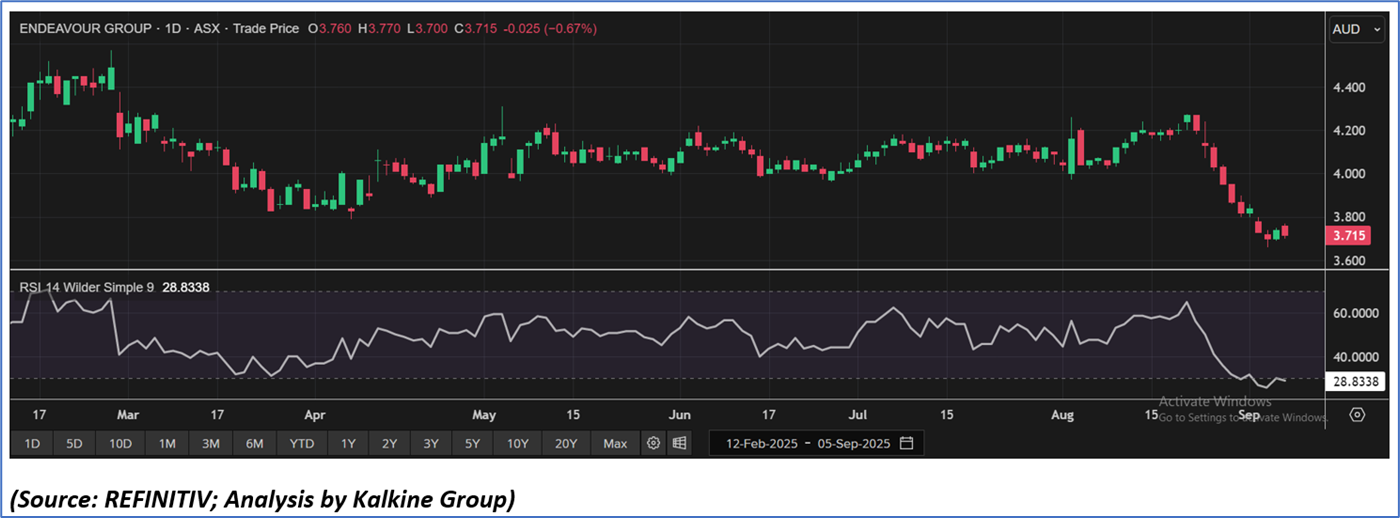
4.1 Price Performance and Technical Summary
The stock price has declined by ~9.47% in the last three months, whereas over the last six months, it has declined by ~10.12%. The stock has a 52-week low and 52-week high of AUD 3.660 and AUD 5.130, respectively, and is currently trading below its 52-week high-low average. EDV was last covered in a report dated ‘30 January 2025’.
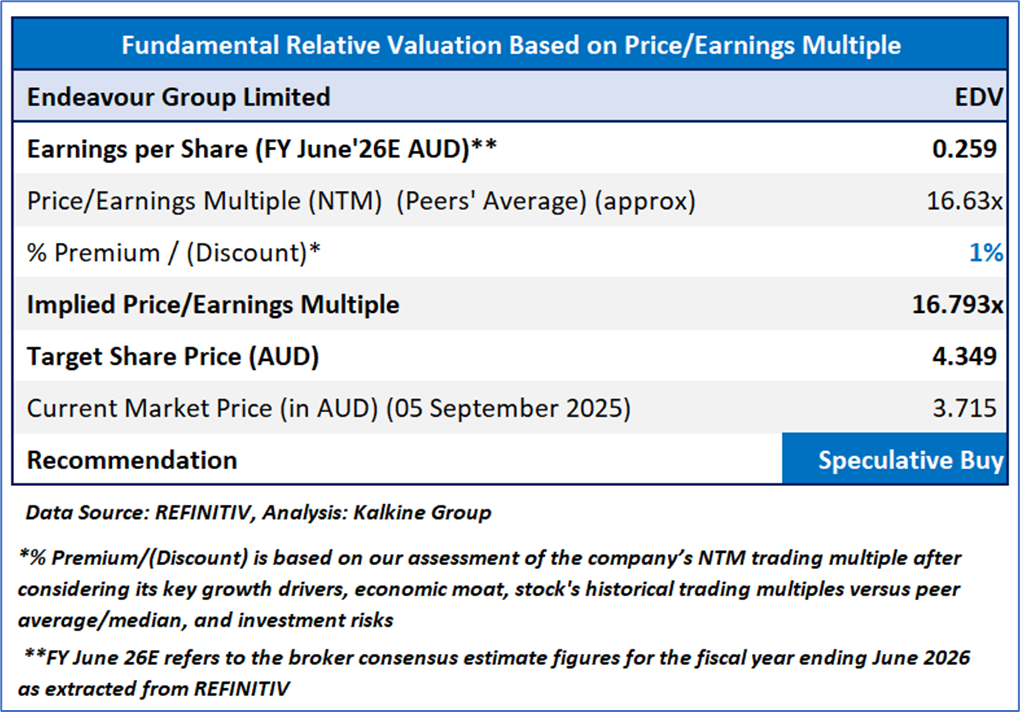
4.2 Fundamental Valuation
Valuation Methodology: P/E Multiple Based Relative Valuation (Illustrative)

Markets are trading in a highly volatile zone currently due to certain macro-economic issues and geopolitical tensions prevailing. Therefore, it is prudent to follow a cautious approach while investing.
Note 1: Past performance is neither an indicator nor a guarantee of future performance.
Note 2: The reference date for all price data, currency, technical indicators, support, and resistance levels is 05 September 2025. The reference data in this report has been partly sourced from REFINITIV.
Note 3: Investment decisions should be made depending on an individual's appetite for upside potential, risks, holding duration, and any previous holdings. An 'Exit' from the stock can be considered if the Target Price mentioned as per the Valuation and or the technical levels provided has been achieved and is subject to the factors discussed above.
Note 4: Dividend Yield may vary as per the stock price movement.
Note 5: Kalkine reports are prepared based on the stock prices captured either from REFINITIV or Trading View. Typically, REFINITIV or Trading View may reflect stock prices with a delay which could be a lag of 25-30 minutes. There can be no assurance that future results or events will be consistent with the information provided in the report. The information is subject to change without any prior notice.
Technical Indicators Defined: -
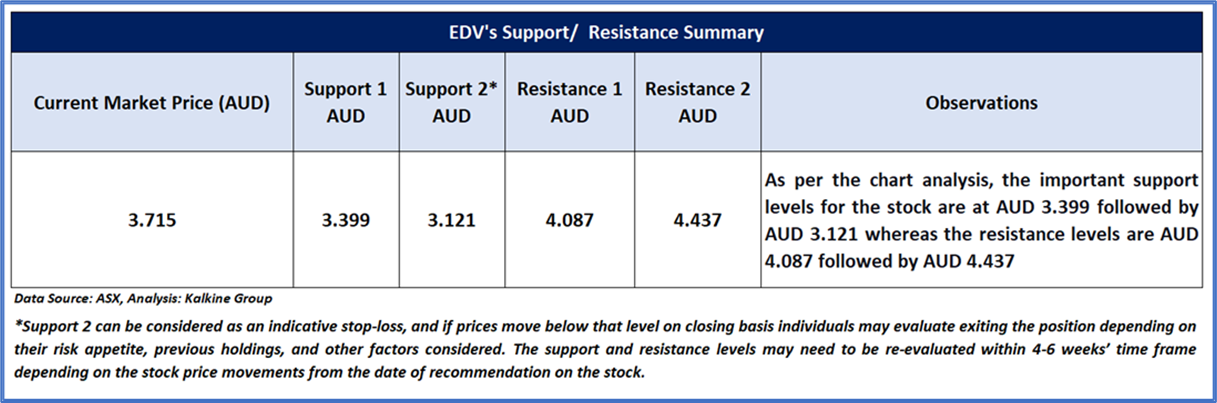
Support: A level at which the stock prices tend to find support if they are falling, and a downtrend may take a pause backed by demand or buying interest. Support 1 refers to the nearby support level for the stock and if the price breaches the level, then Support 2 may act as the crucial support level for the stock.
Resistance: A level at which the stock prices tend to find resistance when they are rising, and an uptrend may take a pause due to profit booking or selling interest. Resistance 1 refers to the nearby resistance level for the stock and if the price surpasses the level, then Resistance 2 may act as the crucial resistance level for the stock.
Stop-loss: It is a level to protect further losses in case of unfavourable movement in the stock prices.
This report (“Report”) has been issued by Kalkine Pty Limited (ABN 34 154 808 312) (Australian financial services licence number 425376) (“Kalkine”) and prepared by Kalkine and its related bodies corporate who are authorised to provide general financial product advice. Kalkine.com.au and its associated pages are published by Kalkine.
Any advice provided in this Report is general advice only and does not take into account your objectives, financial situation or needs. You should therefore consider whether the advice is appropriate for your objectives, financial situation and needs before acting upon it.
There may be a Product Disclosure Statement, Information Memorandum or other offer document (“Offer Document”) for the securities or other financial products referred in this Report. You should obtain a copy of the relevant Offer Document and consider it before making any decision about whether to acquire the security or financial product.
Kalkine strongly recommends that you seek advice from a financial adviser, stockbroker or other professional (including taxation and legal advice) before acting on any of the general advice in this Report or on the Kalkine website. Not all investments are appropriate for all people.
The information in this Report and on the Kalkine website has been prepared from a wide variety of sources, which Kalkine, to the best of its knowledge and belief, considers accurate. Kalkine has made every effort to ensure the reliability of the information contained in its reports (including this Report), newsletters and websites. All information represents our views at the date of publication and may change without notice.
The information in this Report does not constitute an offer to sell securities or other financial products or a solicitation of an offer to buy securities or other financial products. Our reports contain general recommendations to invest in securities and other financial products. Kalkine is not responsible for, and does not guarantee, the performance of, or returns on, any investments mentioned in this Report.
Kalkine does not issue, sell or deal in any financial products.
This Report may contain information on past performance of particular investments. Past performance is not a reliable indicator of future performance. Returns stated do not take into account transaction costs and taxes. To the extent permitted by law, and excluding any dishonesty or gross negligence by Kalkine, Kalkine disclaims and excludes all liability for any direct, indirect, implied, punitive, special, incidental or other consequential loss or damage arising from the use of or reliance on this Report, the Kalkine website and any information published on the Kalkine website without any warranties or representations by Kalkine to you. To the extent the law prohibits or limits this exclusion, Kalkine limits its liability to the resupply of services.
Please also read our Terms & Conditions and Financial Services Guide for further information. Employees and/or associates of Kalkine and its related entities may hold interests in the securities or other financial products covered in this Report or on the Kalkine website. Any such employees and associates are required to comply with certain, procedures and disclosures as required by law.
Kalkine Media Pty Ltd, an affiliate of Kalkine Pty Ltd, may have received, or be entitled to receive, financial consideration in connection with providing information about certain entity(s) covered on its website including entities covered in this Report.
Copyright 2025 Krish Capital Pty. Ltd. (ABN 61629651510). All Rights Reserved. No part of this report, or its content, may be reproduced in any form without our prior consent.
Past performance is not a reliable indicator of future performance.
 Please wait processing your request...