
Company Overview: Electronic Arts Inc. develops, markets, publishes and distributes games, content and services that can be played by consumers on a range of platforms, which include consoles, personal computers (PCs), mobile phones and tablets. The Company's games and services are based on a portfolio of intellectual property that includes established brands, such as FIFA, Madden NFL, Star Wars, Battlefield, the Sims and Need for Speed. The Company markets and sells its games and services through retail channels and through digital distribution channels. The Company's PC games and additional content can be downloaded directly through its Origin online platform, as well as through third-party online download stores. Its mobile, tablet and PC free-to-download games and additional content are available through third-party application storefronts, such as the Apple Application Store and Google Play.
.png)
EA Details
Innovative Product Portfolio to Aid Business Growth: Electronic Arts Inc. (NASDAQ: EA) is a global leader in digital interactive entertainment. The company is engaged in developing, marketing, publishing and delivering games and services, playable and watchable on a cluster of platforms, such as PCs, mobile phones and tablets. The company develops and publishes games and services across diverse genres, such as sports, first-person shooter, action, role-playing and simulation. Further, the business offers multiple business models and distribution channels, such as retail, download, subscription and free-to-play. EA operates through – (a) wholly-owned subsidiaries like Battlefield, The Sims, Apex Legends, Anthem, etc., and (b) license from others such as FIFA, Madden NFL, etc.
In FY19 (for the period ended on March 2019), total net revenue stood at $4,950 million, posting a marginal decline of 0.38% as compared to $5150 million during FY18. Net profit for the company was recorded at $1,019 million, declining 2.3% on y-o-y. Looking at the past performance, EA delivered a CAGR growth of ~2.33% in revenue over the period of FY15 to FY19, while net profit posted a CAGR growth of ~3.02% during the same period.
Going forward, the Management expects to continue the investment in the business to remain competitive, including investments in technology to connect the players to each other and to the games they love, and in infrastructure to power the games and services.
.png)
Five-Year Income Statement (Source: Company Reports)
Revenue Recognition: EA derives its revenue primarily from sales of games, and related extra-content and services that can be played by customers on a variety of platforms, which include game consoles, PCs, mobile phones and tablets. The offerings include the followings:
1. Full games with both online and offline functionality;
2. Full games with online-only functionality, which require an Internet connection
3. Extra content related to games with services and online-hosted service
4. Subscriptions, such as Origin Access, Origin Access Premier and EA Access, that generally offers access to a selection of full games, in-game content, online services and other benefits.
5. Licensing the company’s games to third parties to distribute and hosting of the company’s games.
Revenue Classification: EA classifies its revenue as either product revenue or service and other revenue.
Product revenue: This segment includes revenue allocated to the software license performance obligation. Product revenue also includes revenue from the licensing of software to third parties.
Service and other revenue:This segment includes revenue allocated to the future update rights and the online hosting performance obligations.
.png)
Revenue Classification (Source: Company Reports)
Electronic Arts Inc. caters to a dynamic industry, which experiences periods of rapid fundamental change. In order to remain competitive, the business requires to anticipate, sometimes years in advance, the ways in which the products and services will compete in the market.EA adapts the business through several investments across creative and technical talent and new technologies, evolving the business strategies and distribution methods, and developing new and engaging products and services. In the recent past, the company launched two new intellectual properties (Anthem and Apex Legends), brought Apex Legends to market as the first free-to-play console product, added frontline titles to the Origin Access Premier subscription service, and invested in more ways to reach the players now and in the future, such as cloud gaming and esports.
Q2FY20 Operating Performance for the period ended 30 September 2019: EA reported its second-quarter results, wherein the company reported total net revenue at $1,209 million as compared to $1,137 million during Q2FY19. The company reported net income at $1,421 million as compared to $293 million on account of $985 million received as a benefit from income taxes.
Supplemental Net Revenue by Composition: As per the categorization, the business divides its income into two segments, namely digital net revenue and packaged goods net revenue.
Digital net revenue constitutes full-game downloads, live services, and mobile revenue. Full game downloads include revenue from digital sales of full games on console and PC while live services include revenue from sales of extra content for console, PC, browser games, game software licensed to company’s third-party publishing partners who distribute digitally, via subscription, and advertising. Mobile includes revenue from the sale of full games and extra content on mobile phones and tablets. Digital revenue during the quarter stood at $1,049 million, increased 10% from Q2FY19 primarily driven by FIFA Ultimate Team, Apex Legends and The Sims 4.
Packaged goods net revenue includes revenue from the software, which is sold physically. This segment includes revenue from brick and mortar retailers, and the business’s software licensing revenue from third parties like makers of console platforms, personal computers, or computer accessories. Other revenue includes non-software licensing revenue. During the quarter, packaged goods and other net revenue posted revenue at $160 million, decreased 11% on y-o-y basis on account of $66 million decrease in FIFA and Need for Speed franchises and Star Wars Battlefront II, partially offset by a $46 million increase, primarily from Anthem and the Battlefield franchise.
.png)
Q2FY20 Supplemental Net Revenue by Composition (Source: Company Reports)
Net bookings during the quarter came in at $743 million as remain flat compared to $749 million in Q2FY19. Net Bookings were primarily driven by sales related to FIFA Ultimate Team, The Sims 4 and Apex Legends. Digital net bookings stood at $701 million for Q2FY20 stood almost flat as compared to the previous corresponding period. During the second quarter of FY20, live services grew by ~12% on y-o-y basis, aided by Apex Legends and The Sims 4, partially offset by Battlefield 1.
.png)
Q2FY20 Net Bookings (Source: Company Reports)
.png)
Q2FY20 Financial Highlights (Source: Company Reports)
Cost of Revenue: It consists of expenses related to manufacturing royalties, certain royalty expenses for celebrities, net of volume discounts and other vendor reimbursements, professional sports leagues, movie studios and other organizations, and independent software developers, inventory costs, expenses incurred for defective products, write-offs of post launch prepaid royalty costs and losses on previously unrecognized licensed intellectual property commitments, amortization of certain intangible assets, personnel-related costs, and warehousing, payment processing fees and distribution costs. This segment derives 15.5% of the total net revenue. During the second quarter of FY20, the cost of revenue came in at $187 million as compared to $215 million.
.png)
Q2FY20 Cost of Revenue Details (Source: Company Reports)
Research and development expenses: It denote 32% of the total revenue and consist of expenses related to the production studios for personnel-related costs, related overhead costs, contracted services, depreciation. Any impairment of prepaid royalties for pre-launch products is also included within this segment. Research and development expenses for online products include expenses incurred by the studios, consisting of direct development and related overhead costs in connection with the development and production of the online games. Expenses associated with the digital platform, software licenses and maintenance, and management overhead are also included within the segment. During the quarter, EA reported higher R&D expense at $381 million as compared to $362 million in the previous corresponding quarter, primarily due to an increase in head count.
Marketing and Sales expenses: It consist of expenses related to personnel-related costs, overhead costs, advertising, marketing and promotional costs followed by net of qualified advertising cost reimbursements from third parties. Marketing and sales expenses, during the second quarter of FY20 stood at $110 million, decreased 21% on pcp basis on account of the decrease in advertising and promotional expenditure, followed by a $7 million decrease in personnel-related costs due to decline in headcount. Marketing and sales expenses accounted for 9% of the total net revenue.
General and Administrative expense during the quarter came in at $110 million as compared to $114 million in Q2FY18 aided by lower personnel-related costs. Under the General and administrative expenses, the company includes costs related to personnel, executive and administrative staff followed by corporate expenses such as finance, legal, human resources. Furthermore, expenses incurred from information technology, related overhead costs, fees for professional services such as legal and accounting, and allowances for doubtful accounts are also included. General and administrative expenses accounted for 9% of the total revenue at $110 million as compared to $114 million (pcp), depicting 15.5% of the total net revenue.
Top 10 Shareholders: The top 10 shareholders have been highlighted in the table, which together form around 35.97% of the total shareholding. The Vanguard Group, Inc. and T. Rowe Price Associates, Inc. hold the maximum interests in the company at 7.55% and 5.68%, respectively.
.png)
Top 10 Shareholders (Source: Thomson Reuters)
Key Metrics: The Company posted decent margins in the second quarter of FY20. Gross margin for Q2FY20 stood at 70%, higher than Q2FY19 and industry median of 67.5% and 48.5%, respectively. EBITDA and pretax margin for Q2FY20 came in at 23.4% and 21.1%, higher than Q2FY19 of 23.1% and 21.5%, respectively. Return on Equity (ROE) stood at 12.5% in Q2FY20, higher than the industry median of 2.3%.
.png)
Key Metrics (Source: Thomson Reuters)
.png)
Key Ratios (Source: Thomson Reuters)
Outlook: As per the Management guidance, FY20 net revenue is expected to come in around $5.410 billion, while online-enabled games are expected to be approximately $130 million. The company expects $155 million of fees income from its Mobile platform. EA expects FY20 net income at around $2.841 billion, including a one-time income tax benefits of around $1.705 billion. Diluted EPS is expected roughly at $9.57, and around $5.74 is related to the one-time income tax benefits. The business expects operating cash flow at around $1.625 billion. EA estimates a share count of $297 million for the purpose of calculating FY20 diluted earnings per share. The net bookings are expected to be at $5.125 billion for FY20.
For Q3FY20, EA has forecasted net revenue at around $1.510 billion while income from online-enabled games is expected to be approximately $470 million.The company expects Mobile platform fees at around $(40) million. The net income is expected at around $272 million. The company is expecting diluted earnings per share at $0.92. As per the Management guidance, EA expects a share count of $295 million for purposes of calculating the third quarter fiscal year 2020 diluted earnings per share. Last but not the least, the company assumes net bookings at around $1.940 billion.
Valuation Methodologies
Method 1: Price to Earnings Multiple Approach:
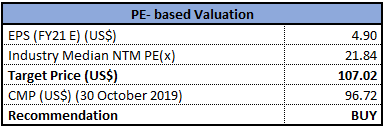
PE Based Valuation (Source: Thomson Reuters), *NTM-Next Twelve Months
Method 2: Enterprise Value to Sales Multiple Approach:
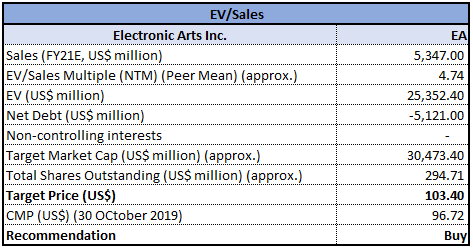
EV/Sales Based Valuation (Source: Thomson Reuters), *NTM-Next Twelve Months
Method 3: Enterprise Value to EBITDA Multiple Approach:
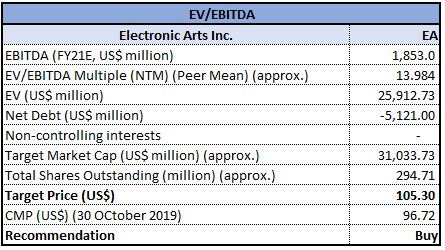
EV/EBITDA Based Valuation (Source: Thomson Reuters), *NTM-Next Twelve Months
Note: All forecasted figures and peers have been taken from Thomson Reuters, *NTM-Next Twelve Months
Stock Recommendation: At the current market price of $96.72, the stock is trading at a price to earnings multiple of 10.52x with a market capitalization of ~$28.50 billion. With new games like Star Wars Jedi: Fallen Order, Need for Speed, Plants vs. Zombies and more great content across the top franchises, the business is set to deliver entertainment to players during the upcoming holiday season, and is likely to continue the momentum for FY20. Decent set of quarterly numbers indicates the power of the live services and the core franchises. EA witnessed better than expected online live services performance during the quarter. Looking ahead, the business is doubling down on live services, combined with the core franchises, and will focus on growth and profitability for the company. Considering the aforesaid facts, we have valued the stock, using three relative valuation methods, i.e., Price to Earnings Multiple, Enterprise Value to Sales multiple, and Enterprise Value to EBITDA multiple, and arrived at a target price of higher single digit to lower double-digit growth (in % term). Hence, we recommend a “Buy” rating on the stock at the current market price of $96.72, up 2.45% on 30 October 2019.
.jpg)
EA Daily Technical Chart (Source: Thomson Reuters)
Disclaimer
The advice given by Kalkine Pty Ltd and provided on this website is general information only and it does not take into account your investment objectives, financial situation or needs. You should therefore consider whether the advice is appropriate to your investment objectives, financial situation and needs before acting upon it. You should seek advice from a financial adviser, stockbroker or other professional (including taxation and legal advice) as necessary before acting on any advice. Not all investments are appropriate for all people. Kalkine.com.au and associated pages are published by Kalkine Pty Ltd ABN 34 154 808 312 (Australian Financial Services License Number 425376). The information on this website has been prepared from a wide variety of sources, which Kalkine Pty Ltd, to the best of its knowledge and belief, considers accurate. You should make your own enquiries about any investments and we strongly suggest you seek advice before acting upon any recommendation. Kalkine Pty Ltd has made every effort to ensure the reliability of information contained in its newsletters and websites. All information represents our views at the date of publication and may change without notice. To the extent permitted by law, Kalkine Pty Ltd excludes all liability for any loss or damage arising from the use of this website and any information published (including any indirect or consequential loss, any data loss or data corruption). If the law prohibits this exclusion, Kalkine Pty Ltd hereby limits its liability, to the extent permitted by law to the resupply of services. There may be a product disclosure statement or other offer document for the securities and financial products we write about in Kalkine Reports. You should obtain a copy of the product disclosure statement or offer document before making any decision about whether to acquire the security or product. The link to our Terms & Conditions has been provided please go through them and also have a read of the Financial Services Guide. On the date of publishing this report (mentioned on the website), employees and/or associates of Kalkine Pty Ltd do not hold positions in any of the stocks covered on the website. These stocks can change any time and readers of the reports should not consider these stocks as personalised advice.
Past performance is not a reliable indicator of future performance.
 Please wait processing your request...