Kalkine has a fully transformed New Avatar.

Company Overview: Cromwell Property Group (ASX: CMW) is a diversified real estate investor and manager involved primarily in property investment, funds management, property management and property development. CMW has a global investor base and its operations are spread across three continents. The company has three business segments which include – Direct investment, Indirect investment, and Funds and asset management. The company is a trusted capital partner and fund manager to a range of global and local investors..png)
CMW Details
.PNG)
Well-Placed to Manage Covid-19 Impacts: Cromwell Property Group (ASX: CMW) is a diversified real estate investor and manager with a market capitalisation of $2.18 billion as on 4 June 2020. The company’s strategy involves maintaining a strong balance sheet and long-dated direct property portfolio and its objective is to provide securityholders with an attractive combination of stable long-term cash flows, demonstrating asset enhancement capabilities and transactional profits. The company has a strong track record of creating value and delivering superior risk weighted returns throughout the real estate investment cycle.
Amid Covid-19 situation, the company’s goal is to minimize and mitigate the financial impact of the pandemic on the company’s earnings and balance sheet. CMW has recently assured that its business is operating at full capacity with minimal disruption to services. The company’s performance over the last few months has demonstrated that it is a resilient business that will continue to perform as markets recover. This further assures that the company is well placed to manage through the current period of uncertainty and benefit as market conditions improve. Moving forward, the company expects its existing infrastructure, including systems, processes, people and regulatory approvals and licences to support strong growth in funds under management when the crisis abates.
FY19 Performance Highlights: For the financial year 2019, the company reported an operating profit of $174.2 million, up 11% on pcp, driven by the growth in direct and indirect property investment. For FY19, direct property investment segment reported a profit of $136.1 million, up 12.9% from the prior period, driven by strong like-for-like net operating income (NOI) growth. Further, the indirect property investment segment’s profit increased by 94.9% to $45.4 million in FY19. The operating profit from the company’s Funds and asset management segment, after finance costs, was $28.5 million down from $35 million in FY18.
During FY19, the company made two large, multi-country transactions on behalf of the Cromwell European REIT or CEREIT. The first transaction involved the acquisition of 23 assets in five countries and the second for six assets in two countries, for a combined value of $775 million. For the full year, the company declared total distributions of 7.25 cents per share, representing a payout ratio of 90%. .png)
Key Financial Highlights (Source: Company Reports, Thomson Reuters)
H1FY20 Results Highlights: For the first half of FY20, the company reported a statutory profit of $227.3 million, up 105% on pcp. Further, the company reported an operating profit of $134.1 million, up 62.4% on pcp, driven by the growth in all three segments. The direct property investment segment reported a profit of $105.7 million, up 68.6% on pcp, driven by strong like-for-like NOI growth. The indirect property investment segment reported a 33.0% growth in profit to $25.8 million. During the half-year period, the Funds and asset management segment profit also reported a growth of 67.2%.
For the half-year period, the company announced distributions per security of 3.75 cps, up 3.3% on pcp, representing a payout ratio of 72.7%. As on 31 December 2019, the company had cash and cash equivalents of $186.8 million, up 83.9% on the previous half.
During the half-year period, the company progressed on its ‘Invest to Manage’ strategy, which involves investing to acquire or develop assets, creating new funds, selling down to capital partners and then recycling the proceeds. Over H1FY20, the company sold Northpoint Tower and recycled capital into 400 George Street. The company also exchanged contracts to sell a 50% interest in 475 Victoria Avenue, Chatswood to a private fund managed by BlackRock Real Estate..png)
H1FY20 Segment Performance (Source: Company Reports)
Top 10 Shareholders: The top 10 shareholders have been highlighted in the table, which together forms around 54.98% of the total shareholding.
.png)
Top 10 Shareholders (Source: Refinitiv, Thomson Reuters)
A Quick Look at Key Ratios: For H1FY20, the company’s gross margin stood at 88.7%, higher than the industry median of 73.7%. Further, the company reported a net margin of 97.1%, higher than the industry median of 54.9%. The company has a ROE of 9.3%, higher than the industry median of 4.5%. The company’s current ratio stands at 0.86x, higher than the industry median of 0.45x, demonstrating that the company is well equipped to pay its short-term obligations. .png)
Key Metrics (Source: Refinitiv, Thomson Reuters)
Consistent and Reliable Distributions: The company understands that securityholders value the consistency and reliability of its quarterly distributions, and its policy has been to ensure that distributions are maintained wherever possible. For the past five years, the company has been consistently paying distributions to its stakeholders. In FY19, the company paid a total distribution of 7.25 cents per share, representing a payout ratio of 90%. And for H1FY20, the company paid distributions per security of 3.75 cps, up 3.3% on pcp, representing a payout ratio of 72.7%. For the June 2020 quarter, the company intends to pay a distribution of 1.875 cents per security, which will be covered by earnings and cash flow.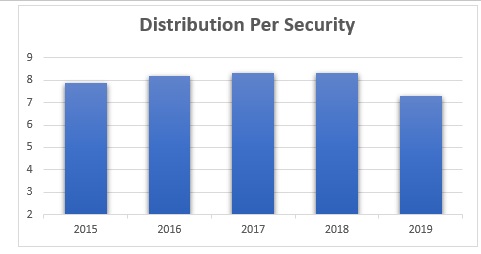
Distribution Trend (Source: Company Reports)
Managing Covid-19 Impacts: In a business update provided on 4 June 2020, the company informed that it is focused on minimising and mitigating the financial impact of the Covid-19 pandemic on the company’s earnings and balance sheet. So far, all three business segments have contributed to meet this objective. The company’s investment in systems, processes and people has ensured that there has been no interruption to its business, despite having its entire workforce working remotely. The company believes that it is well placed to manage through this period of uncertainty and benefit as market conditions improve.
June Quarter Distribution: In the recent business update, the company informed that it is going to pay June 2020 quarter of 1.875 cents per security in full, in line with the company’s original guidance. And, it will be payable on 21 August 2020 with ex-date of 29 June 2020 and record date of 30 June 2020. On the other hand, the company’s Dividend Reinvestment Plan (DRP) will not operate for the June quarter distribution due to Cromwell’s security price being below the per unit NTA (net tangible assets). At CMP of $0.870, annual dividend yield of the company stood at ~8.9%, which looks a bit inflated due to steep price correction lately, however, the stock still seems to have decent fundamental value in the long-term.
What to Expect: Before Covid-19, the company was expecting its FY20 operating profit per share to be around 8.30 cps; and its FY20 distribution to be at 7.50 cps, representing an operating profit yield of 7.03% and a distribution yield of 6.36%, respectively. However, due to the uncertainty surrounding the impacts of Covid-19, the company withdrew its FY20 guidance.
The company is now focused on managing the financial impacts of the pandemic on the earnings. With 44% of gross passing rent in Australia coming from government sources, CMW is well-positioned to manage through the current period of uncertainty and benefit as market conditions improve. The company also expects its existing infrastructure, including systems, processes, people and regulatory approvals and licences to support strong growth in funds under management when the crisis abates.
Currently, the company’s active risk management approach is seeing 57% of total exposure either floating or hedged through interest rate caps, allowing the business to benefit from the current low rate environment. At the end of FY20, the company expects to have around $670 million of cash and available undrawn facilities. .png)
Key Valuation Metrics (Source: Refinitiv, Thomson Reuters)
Valuation Methodology: P/E Multiple Based Relative Valuation (Illustrative).png)
P/E Multiple Based Relative Valuation (Source: Refinitiv, Thomson Reuters)
Note: All the forecasted figures are taken from Thomson Reuters, NTM: Next Twelve Months
Stock Recommendation: Cromwell Property Group has a clear proven strategy, a long-WALE portfolio of balance sheet properties, a $1.2 billion plus value-add development pipeline, a host of ‘Invest to Manage’ opportunities, a successful and growing business in Singapore and a robust platform and presence in Europe. The stock of CMW has declined by 31.28% in the past six months and is inclined towards its 52 weeks low level of $0.675, offering investors a decent opportunity for accumulation. We have valued the stock using Price to Earnings multiple based illustrative valuation method and have arrived at a target price with low double-digit upside (in % terms). Considering the company’s resilient performance amid Covid-19, its consistent and reliable distribution payment, decent H1FY20 performance, and current trading levels, we give a “Buy” recommendation on the stock at the current market price of $0.870, up 4.192% on 4 June 2020.
.png)
CMW Daily Technical Chart (Source: Refinitiv, Thomson Reuters)
Disclaimer
The advice given by Kalkine Pty Ltd and provided on this website is general information only and it does not take into account your investment objectives, financial situation or needs. You should therefore consider whether the advice is appropriate to your investment objectives, financial situation and needs before acting upon it. You should seek advice from a financial adviser, stockbroker or other professional (including taxation and legal advice) as necessary before acting on any advice. Not all investments are appropriate for all people. Kalkine.com.au and associated pages are published by Kalkine Pty Ltd ABN 34 154 808 312 (Australian Financial Services License Number 425376). The information on this website has been prepared from a wide variety of sources, which Kalkine Pty Ltd, to the best of its knowledge and belief, considers accurate. You should make your own enquiries about any investments and we strongly suggest you seek advice before acting upon any recommendation. Kalkine Pty Ltd has made every effort to ensure the reliability of information contained in its newsletters and websites. All information represents our views at the date of publication and may change without notice. To the extent permitted by law, Kalkine Pty Ltd excludes all liability for any loss or damage arising from the use of this website and any information published (including any indirect or consequential loss, any data loss or data corruption). If the law prohibits this exclusion, Kalkine Pty Ltd hereby limits its liability, to the extent permitted by law to the resupply of services. There may be a product disclosure statement or other offer document for the securities and financial products we write about in Kalkine Reports. You should obtain a copy of the product disclosure statement or offer document before making any decision about whether to acquire the security or product. The link to our Terms & Conditions has been provided please go through them and also have a read of the Financial Services Guide. On the date of publishing this report (mentioned on the website), employees and/or associates of Kalkine Pty Ltd do not hold positions in any of the stocks covered on the website. These stocks can change any time and readers of the reports should not consider these stocks as personalised advice.
 Please wait processing your request...