
Company Overview: Cromwell Property Group is a global real estate investment manager. The Company is engaged in property investment, funds management, property management and property development. Its segments include Property investment, Property/internal funds management, External funds management-retail, External funds management-wholesale and Property development. Property investment segment is engaged in the ownership of investment properties located throughout Australia. The Property/internal funds management includes property and facility management, leasing and project management for its managed investment schemes. The External funds management-retail segment includes external funds for retail investors. External funds management-wholesale includes establishment and management of external funds for wholesale investors. The Property development segment includes property development, including development management, development finance and property development related joint venture activities.
.png)
CMW Details
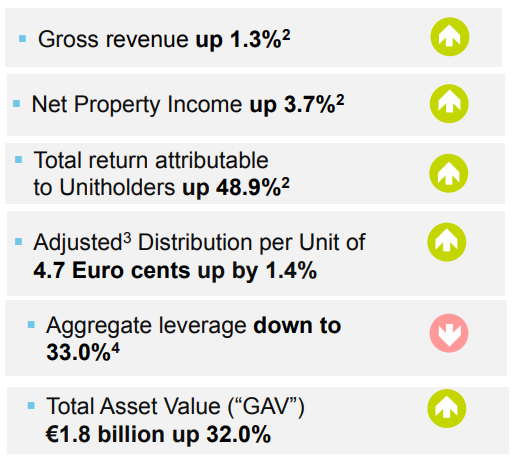
Statutory and Operating Profit Increase in 1HFY19 (YoY): Cromwell Property Group (ASX: CMW) is a mid-cap Real Estate Investment Trust with the market capitalisation of circa $2.43 Bn as of 4 April 2019. Recently, the company delivered decent 1HFY19 results in which statutory profit substantially grew by 37.5 percent and amounted to $ 111.1 Mn in 1HFY19 over the prior corresponding period (PCP). Operating profit stood at $82.6 Mn in 1HFY19, showing decent growth of 7.6 percent on a PCP basis. This performance might support to achieve an EPS guidance of around 8 cents per share and DPS of around $0.0725 per security in FY19. At the end of December 2018, the company was having a decent customer base as it was managing over 3,700 tenant customers in 15 countries, who lease over 3.8 million square meters of space. The value of total assets under management (AUM) is $11.5 billion. Further, the management of the company stated that the objectives of the investment management strategy will support to build enterprise value, add medium-term earnings and generate higher total securityholder return. Cromwell is maintaining a robust and secure balance sheet and is also having long-dated Australian property portfolio which enables it to recycle the assets as well as reinvest into the property investment and funds management businesses. The company is maintaining an allocation in its direct portfolio to Core+ assets from which the company can generate value as well as reap the benefits of short-term market trends. At CMP of $1.085, the stock of the company is trading at P/E multiple 13.56x of FY20E EPS. By looking at its first half year performance, maintaining decent dividend pay-out ratio, and long-term potential in the company, we have valued the stock using two Relative valuation methods, EV/Sales and Price/Cash flow and have arrived at target price upside of about single-digit growth (in %) for the next 12-24 months. Key Risks related to rating include Global trade tensions, Brexit resolution, and the possibility of modest economic growth in China, Europe, and the U.S.
.png)
Key Financial Metrics (Source: Company Reports, Thomson Reuters)
Significant Improvement Witnessed in Key Margins: Cromwell Property is having strong standing with respect to its key margins as its net margin stood at 69.1% which implies a rise of 17.7% on the YoY basis which reflects the company’s improved capability to convert its top line into the bottom line. Operating margin substantially rose from 4.3% in 1HFY18 to 50.3% in 1HFY19, representing strategies targeting efficient cost management.
The company is also having a decent liquidity position which is reflected in its current ratio of 2.09x (in 1H FY 2019) signifying that CMW is having decent footing when it comes to meet its short-term obligations. Also, it reflects that the company can make deployments towards the business activities which might help it in achieving long-term growth. At the end of December 2018, the company had respectable total current assets base of $262.2 million. We expect that the company’s decent liquidity levels coupled with the total current assets base, sound total assets under management base and ‘Invest to Manage’ strategy would support it in tapping growth opportunities moving forward. At the end of half-year ended December 2018, the company’s total AUM amounted to $11.5 billion.
A Look at Direct Property Investment Segment: Direct Property Investment Segment’s Core portfolio consisted of 10 assets and accounted for 67% of the company’s total direct portfolio by value. It has essentially full occupancy at 99%. The like for like NOI (or net operating income) growth for Core portfolio stood at 4.2% for the half-year ended December 2018 which was above the target growth of 3%. Coming to the Core + portfolio, it consisted of 7 assets and accounted for 29% of the company’s total direct portfolio by value and has a 95% occupancy rate. The like for like NOI growth for Core+ stood at 8.3% which was because of NOI growth witnessed at 207 Kent Street, NSW of 18% and NOI growth at 200 Mary Street, QLD of 30%. Further, the Active portfolio consists of 3 assets, which represent 4.3% of the portfolio by value. This segment included Tuggeranong Office Park, ACT, 13 Keltie Street, ACT, and Wakefield Street, SA. The company stated that 13 Keltie Street, ACT is presently 35% occupied and is having a WALE of 0.3 years. As of now, the company is in the process of identifying repositioning opportunities for the property.
.png)
Direct Property Investment Segment (Source: Company Reports)
What’s Happening In Indirect Property Investment Segment: CEREIT (or Cromwell European Real Estate Investment Trust) had made an announcement of the acquisition of 23 properties across three portfolios in Europe with a total purchase price of €384 million (or $600 million) on October 31, 2018. This is to be partially equity funded with the help of an equity raising amounting to around €224 million (or $350 million). At the end of the half-year, Cromwell owned 35% of CEREIT. The operating profit for indirect property investment segment amounted to $19.4 million reflecting a rise from $7.9 million in the prior period which was primarily because of CEREIT.
CEREIT Key Financial Highlights for 2018 (Source: Company Reports)
Funds and Asset Management Segment- AUM Remains Unchanged: The funds and asset management segment generated profit amounting to $18.6 million which implies a fall from $25.4 million posted in the same period of previous year. However, total AUM was unchanged and amounted to $8.7 billion in 1HFY19. In Europe, 45% of $6.0 billion (or €3.7 billion) under management happens to be more permanent capital which is up from nil 18 months ago. The company’s top management had stated that private equity would continue to be a crucial source of capital. Further, they added that the company would continue to recycle the shorter dated mandates into longer dated longer term funds and match the opportunities which they identify in its unique platform with the capital partners focused towards long term income to build recurring revenue streams for the group.
Cromwell Responded to Media Speculation: Cromwell had confirmed that it had made an approach to RDI Reit PLC (LSE: RDI) with regards to a potential transaction. Cromwell added that any transaction will be consistent with its strategy to work with the capital partners to grow funds under management and continue to enhance the investment footprint in the UK and Europe. Over half of CMW’s A$11.5 bn of assets under management as at 31 December 2018 is concentrated in Europe. In pursuant to Rule 2.6(a) of the UK City Code on Takeovers and Mergers, Cromwell is required, by not later than on 23 April 2019 to either make an announcement about a firm intention to make an offer for RDI in pursuant with Rule 2.7 of the Code or to make an announcement that it does not intend to make an offer.
Cash Management: Cromwell had made deployments of some operating profit towards value adding opportunities within the business. The company had made distributions amounting to $76.4 million in the half-year ended December 2018 to the securityholders which reflects a rise of 2.7% on the YoY basis. The company’s distributions per security stood at 3.63 cps which is on track to the full-year guidance of 7.25 cps. Additionally, the company has been maintaining a respectable pay-out ratio of 92.5% in the half-year ended December 2018. We expect that the company’s strong cash management strategy would continue to support it in shelling out distributions and maintaining pay-out ratio of around 90% in FY19E which might attract the attention of market players.
What To Expect From CMW Moving Forward: Cromwell had stated that global trade worries, Brexit and possibility of a slowdown in the economic growth in China, Europe, and the US have led to the downward revisions to global growth forecasts. With regards to Australia, the company stated that uncertainty related to the federal election, the downturn in residential market and implications for financial services sector from Hayne Royal Commission have led to significant decline in Australian consumer confidence and business conditions.
However, the company’s management had stated that they have placed Cromwell in a robust position to manage the risks and to be able to capitalise on the opportunities which might arise if the risks reduce. The company had wrapped up the 2 for 13 non-renounceable rights offer in December and proceeds have been utilised towards the repayment of debt and increasing the liquidity. The company had maintained FY 2019 guidance and stated that operating profit is anticipated to be not less than 8.00 cps and distributions are expected to be minimum of 7.25 cps. The company stated that its business is well-placed to meet the risks on the back of robust balance sheet with low gearing, long debt tenor, long WALE as well as favourable lease expiries.
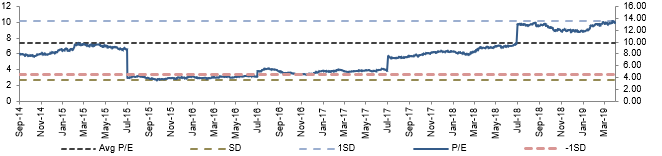
Historical P/E Band (Source: Company Reports)
Stock Recommendation: The stock of Cromwell Property had delivered decent returns as, in the span of previous three months, it posted 10.10% return while, on the YTD basis, it delivered 10.66% return. Moving forward, the company is expected to be supported by strengthening of the balance sheet position. Its cash and cash equivalents stood at $172.5 million at the end of December 2018. The company’s total assets have witnessed a rise of 6.3% and stood at $3,684.3 million while the borrowings reduced by 4.1% and stood at $1,354.4 million which might potentially act as another tailwind for the long-term growth.
Also, Cromwell is having substantial liquidity as well as assets available which could be recycled, and it had already invested into opportunities that would generate operating profit growth moving forward. Also, the company is possessing an annual dividend yield of 6.9% which is higher than the industry median of 5.4%. RoE stood at 5.4% in 1HFY19 which is higher than the industry median of 5.0%, displaying sustainable returns to the shareholders. Hence, by looking at its first half year performance, decent dividend pay-out ratio, and long-term potential, we have valued the stock using two Relative valuation methods, EV/Sales and Price/Cash flow and have arrived at target price upside of about single-digit growth (in %) for the next 12-24 months. Considering the aforesaid facts and a decent relative valuation, we have a “Buy” recommendation on the stock at the current market price of A$1.080 per share (down 0.917% on April 04, 2019).
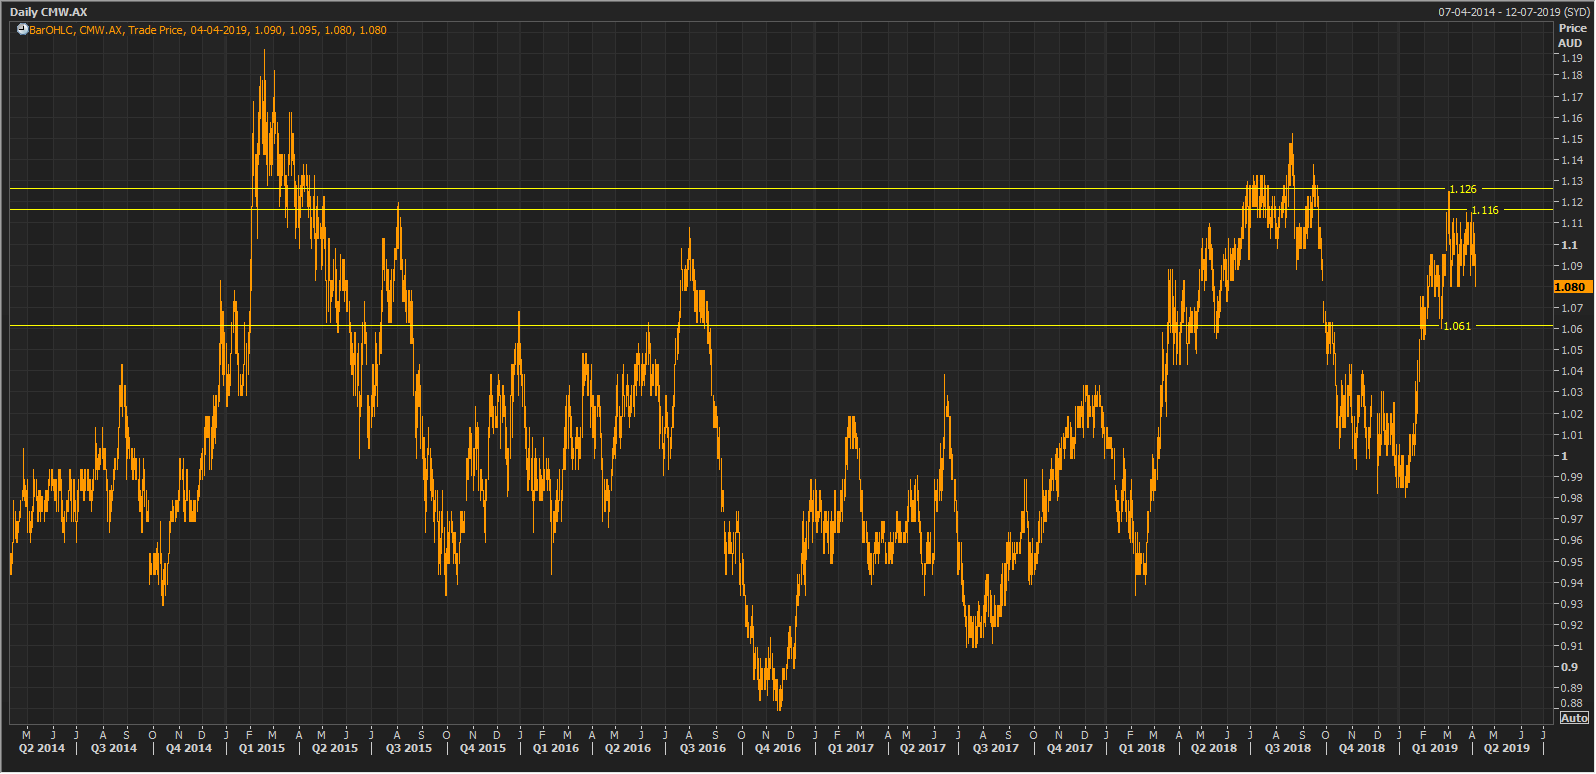
CMW Daily Chart (Source: Thomson Reuters)
Disclaimer
The advice given by Kalkine Pty Ltd and provided on this website is general information only and it does not take into account your investment objectives, financial situation or needs. You should therefore consider whether the advice is appropriate to your investment objectives, financial situation and needs before acting upon it. You should seek advice from a financial adviser, stockbroker or other professional (including taxation and legal advice) as necessary before acting on any advice. Not all investments are appropriate for all people. Kalkine.com.au and associated pages are published by Kalkine Pty Ltd ABN 34 154 808 312 (Australian Financial Services License Number 425376). The information on this website has been prepared from a wide variety of sources, which Kalkine Pty Ltd, to the best of its knowledge and belief, considers accurate. You should make your own enquiries about any investments and we strongly suggest you seek advice before acting upon any recommendation. Kalkine Pty Ltd has made every effort to ensure the reliability of information contained in its newsletters and websites. All information represents our views at the date of publication and may change without notice. To the extent permitted by law, Kalkine Pty Ltd excludes all liability for any loss or damage arising from the use of this website and any information published (including any indirect or consequential loss, any data loss or data corruption). If the law prohibits this exclusion, Kalkine Pty Ltd hereby limits its liability, to the extent permitted by law to the resupply of services. There may be a product disclosure statement or other offer document for the securities and financial products we write about in Kalkine Reports. You should obtain a copy of the product disclosure statement or offer document before making any decision about whether to acquire the security or product. The link to our Terms & Conditions has been provided please go through them and also have a read of the Financial Services Guide. On the date of publishing this report (mentioned on the website), employees and/or associates of Kalkine Pty Ltd do not hold positions in any of the stocks covered on the website. These stocks can change any time and readers of the reports should not consider these stocks as personalised advice.
Past performance is not a reliable indicator of future performance.
 Please wait processing your request...