
Company Overview: Cleanaway Waste Management Limited (ASX: CWY) is a waste management company which operates a national network of a unique collection, processing, treatment and landfill assets. The Group comprises three operating segments - Solid Waste Services, Industrial & Waste Services and Liquid Waste & Health Services. The Solid Waste Services segment comprises the collection, recovery and disposal of solid waste. On the other hand, Liquid Waste & Health Services segment comprises the collection treatment, processing, refining and recycling and destruction of hazardous and non-hazardous liquids. In addition, the company provides its services to the health sector. The Industrial & Waste Services segment provides a wide variety of services to the Infrastructure, Industrial and Resources markets..png)
CWY Details
(39).png)
Improvement in Financial Results and Disciplined Capex Approach: Cleanaway Waste Management Limited (ASX: CWY) is a waste management company which operates as a national network of a unique collection, processing, treatment and landfill assets. As on 06 April 2020, the market capitalization of the company stood at ~$3.46 billion. During FY19, the company made positive progress and reported significant improvement in financial results. During the year, the company reported growth in revenue and earnings in each of its three operating segments with a growth of 34.8% in its group net revenue to $2.1 billion. In the same time span, underlying earnings before interest and tax (EBIT) witnessed an increase of 44.7% to $240.8 million and net profit after tax (NPAT) increased by 43.1% to $140 million. This resulted in an increase of 7.1% in earnings per share to 6.0 cents. These results were mainly due to the organic growth in addition to the synergies from the acquisition of Toxfree. Growth was further enhanced by the full ramp-up of significant contracts. The company’s disciplined approach towards cash and capital expenditure resulted in an increase in free cash flow by 76.4% to $206.4 million. Over the span of 4 years from FY15 to FY19, the company saw a CAGR of 13.31% in revenue and a CAGR of 13.57% in gross profit, representing the progressive implementation of its strategy for strong growth across its business segments. The decent financial performance of the company enabled the Board to increase the total fully franked dividend by 42% to 3.55 cents per share as compared to 2.5 cents per share in FY18. This brought the full-year dividend payout ratio to 51%, in line with the Board’s target range of 50% to 75% of underlying earnings per share. The company also reported a robust balance sheet with net debt of $658.5 million, representing a net debt to EBITDA ratio of 1.4x.
The company has also released its interim results for the period ended 31 December 2019 wherein the decent financial performance of the company reflects the resilience of the business. The revenue base of the company is underpinned by long term contracts with a diverse customer base including municipal councils, hospitals, resources, commercial and industrial customers which is likely to provide steady volumes, recurring revenues and include appropriate price adjustment mechanisms.
The company has a strong financial position and is focused on operational and situational performances. It has strengthened its network of prized infrastructure assets and is focused on optimizing the waste value chain from collection to disposal, with a focus on resource recovery. CWY has planned additional developments for FY20, especially around downstream resource recovery, the Health sector and Energy from Waste..png)
FY19 Financial Performance (Source: Company Reports)
Details of Top 10 Shareholders: The following table provides an overview of the top 10 shareholders of Cleanaway Waste Management Limited. Marathon Asset Management LLP is the largest shareholder in the company, with a percentage holding of 5.97%..png)
Top 10 Shareholders (Source: Thomson Reuters)
Management of Costs on Track with a Stable Balance Sheet: During 1H20, gross margin of the company stood at 71%, higher than the industry median of 38.3%. In the same time span, EBITDA margin of the company witnessed an increase over the previous half and stood at 21.6%, up from 20.2% in 2H19. Higher gross margin with an increase in EBITDA margin indicates that the company is managing its costs well and is capable of converting its top line into the bottom line. During 1H20, net margin of the company was 3.8%, and return on equity stood at 1.8%. In the same time span, Assets/Equity ratio of the company was 1.78x, lower than the industry median of 2.06x and Debt/Equity Ratio of the company was 0.43x. This indicates that the business is financed with a larger proportion of investor funding and a small amount of debt, resulting in a financially stable balance sheet..png)
Key Margins (Source: Thomson Reuters)
Diverse Customer Base and Decent Increase in Revenue: The company has recently released its interim results for the period ended 31 December 2019 wherein it reported an increase of 4.1% in gross revenue to $1,197.2 million and a growth of 6.8% in EBIT to $125.2 million. The revenue base of the company largely comprises of the long-term contracts with the diverse customer base and hence provides steady volumes, recurring revenues and include appropriate price adjustment mechanisms. The growth in revenue and EBIT resulted in an increase of 13.7% in NPAT to $76.2 million. The strong financial and operational performance along with confidence in the future growth of the company has allowed the Board to increase interim dividends paid to shareholders by 21% to 2.0 cents.
Relative to 1H19, operating cash flow of the company witnessed a decline of 20.2% to $140.1 million, primarily due to higher FY20 remediation costs, Toxfree integration costs and tax benefit in 1H19. During the half, the company has completed the integration of SKM assets and continued to progress towards its Footprint 2025 strategy. .png)
1H20 Financial Highlights (Source: Company Reports)
Completion of Acquisition of SKM Recycling Assets: The company has recently announced that it completed the acquisition of the assets of the SKM Recycling Group for approximately $66 million, pursuant to the sale process conducted by KordaMentha, Receiver and Managers of SKM appointed by Cleanaway Waste Management. The sale proceeds will be utilized to repay the company’s senior secured debt, accrued interest and costs associated with the receivership. This acquisition will provide CWY with a network of five recycling sites, which includes three material recovery facilities, a transfer station in Victoria and a substantial recovery facility in Tasmania.
Growth Opportunities and Future Expectations: The company will continue to pursue its strategy to improve its profitability, ROCE (Return on Capital Employed), and market position in the upcoming years. It remains confident with respect to the performance of all the three segments- Solid Waste Services, Industrial Waste Services and Liquid Waste & Health Services. CWY is likely to witness price volatility but expects a smaller impact at a group level. It is focusing on aligning pricing mechanisms and expects increased local volumes.
The company has withdrawn the guidance provided for FY20 due to the increasing uncertainty in the market around the impact of COVID-19. However, the management stated that the financial performance for FY20 has been in line with expectations so far. The company has a strong balance sheet with significant liquidity. However, CWY expects the demand for healthservices, municipal collections and related post-collections services to remain strong. The company is working on its Footprint 2025 strategy and expects decent performance despite the outlook for general economic activity in Australia..png)
Key Valuation Metrics (Source: Thomson Reuters)
Valuation Methodology: EV/EBITDA Multiple Based Relative Valuation Approach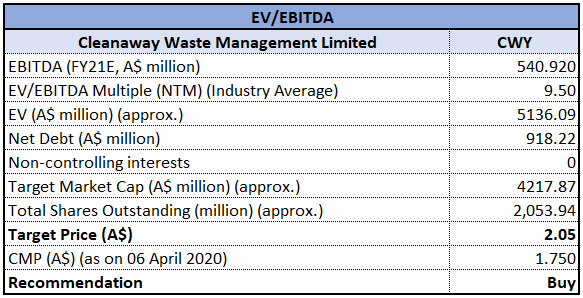
EV/EBITDA Multiple Based Relative Valuation Approach (Source: Thomson Reuters)
Note: All the forecasted figures are taken from Thomson Reuters, NTM: Next Twelve Months
Stock Recommendation: As per ASX, the stock of CWY is inclined towards its 52-weeks’ low level of $1.395, proffering a decent opportunity for accumulation. The company is maintaining its momentum of growth and improvement in all its businesses and has not observed any decline in overall trading despite the uncertainty in the economy. It has a strong balance sheet and has issued long-term notes in the US Private Placement market. Net Debt/EBITDA and interest cover ratios are well within its debt covenants and the company remains confident in the resilience of the business. Considering the trading levels, improvement in margins, the strength of the business and decent financial performance, we have valued the stock using EV/EBITDA multiple based relative valuation approach and have arrived at an indicative target price with an upside of lower double-digit (in percentage terms). Hence, we recommend a ‘Buy’ rating on the stock at the current market price of $1.750, up by 3.858% on 6 April 2020.
.png)
CWY Daily Technical Chart (Source: Thomson Reuters)
Disclaimer
The advice given by Kalkine Pty Ltd and provided on this website is general information only and it does not take into account your investment objectives, financial situation or needs. You should therefore consider whether the advice is appropriate to your investment objectives, financial situation and needs before acting upon it. You should seek advice from a financial adviser, stockbroker or other professional (including taxation and legal advice) as necessary before acting on any advice. Not all investments are appropriate for all people. Kalkine.com.au and associated pages are published by Kalkine Pty Ltd ABN 34 154 808 312 (Australian Financial Services License Number 425376). The information on this website has been prepared from a wide variety of sources, which Kalkine Pty Ltd, to the best of its knowledge and belief, considers accurate. You should make your own enquiries about any investments and we strongly suggest you seek advice before acting upon any recommendation. Kalkine Pty Ltd has made every effort to ensure the reliability of information contained in its newsletters and websites. All information represents our views at the date of publication and may change without notice. To the extent permitted by law, Kalkine Pty Ltd excludes all liability for any loss or damage arising from the use of this website and any information published (including any indirect or consequential loss, any data loss or data corruption). If the law prohibits this exclusion, Kalkine Pty Ltd hereby limits its liability, to the extent permitted by law to the resupply of services. There may be a product disclosure statement or other offer document for the securities and financial products we write about in Kalkine Reports. You should obtain a copy of the product disclosure statement or offer document before making any decision about whether to acquire the security or product. The link to our Terms & Conditions has been provided please go through them and also have a read of the Financial Services Guide. On the date of publishing this report (mentioned on the website), employees and/or associates of Kalkine Pty Ltd do not hold positions in any of the stocks covered on the website. These stocks can change any time and readers of the reports should not consider these stocks as personalised advice.
Past performance is not a reliable indicator of future performance.
 Please wait processing your request...