Kalkine has a fully transformed New Avatar.

Company Overview: Cisco Systems, Inc. (NASDAQ: CSCO) is engaged in developing, manufacturing and selling networking hardware, software, and other IP-based technology services and products. The company focuses on specific technology markets, such as Internet of Things, domain security and power supervision. The company mainly competes in the networking and communications equipment markets with peers like Dell, Amazon Web Services, F5 Networks, Check Point Software Technologies, to name a few. The company conducts its business worldwide, primarily into the following three geographic segments: Americas; Europe, Middle East, and Africa (EMEA); and Asia Pacific, Japan, and China (APJC).
.png)
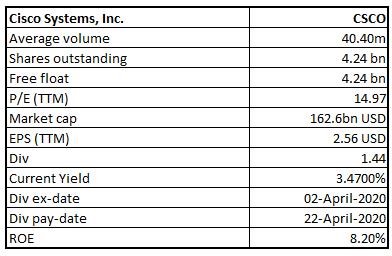
Stocks’ Details
Cisco Rides on Robust Adoption of its Security & Enterprise Solutions: Headquartered in San Jose, California, Cisco Systems, Inc. (NASDAQ: CSCO) was founded in December 1984. Cisco is an Internet Protocol-based networking company, which is engaged in offering a broad range of technologies’ products and services. The company’s products & services help customers to manage more users, devices and things connecting to their networks. The business has three reporting segments: (1) Americas; (2) Europe, Middle East, and Africa (EMEA); and (3) Asia Pacific, Japan, and China (APJC). Group’s products and technologies are categorized into- Infrastructure Platform; Applications; Security, and Other Products.
Robust demand observed by web security, unified threat, network security, and advanced threat solutions, etc., are key growth catalysts for the company, primarily driven by increasing security headwinds encountered by enterprises on a global basis. In FY19, the company had unveiled Catalyst and Meraki WiFi6-based access points, primarily intended for high-density public or private ecosystems to enhance speed, performance, and capacity for wireless networking in both homes and enterprises. The company’s large group of cloud security solutions aids in securing identity, endpoints and the network, which is likely to help the company expand its customer bases, going forward.
Strong Webex portfolio earns a unique recognition. The company’s Applications segment is touted to benefit from a high demand for enterprise co-operation offerings, which includes Webex Meetings, Webex Devices and Webex Teams, among others. Cisco is combining machine learning and artificial intelligence capabilities into enterprise collaboration solutions, with a view to enhance the productivity of users, and improve engagement. The company’s focus to bolster the adoption of Webex services will give it’s a competitive advantage over its peers in the enterprise communication market from Microsoft’s Teams and Slack.
The company witnessed a CAGR of 1.4% and 6.7% in revenue and net profit, respectively, over the period of FY15-FY19. Cisco has been investing in new technology and service enhancement, with enhanced focus on its software, automation and network security system. Operating cash flow increased from 13.9 billion in FY17 to $15.8 million in FY19 and FY19 total revenue was reported at $51.9 billion.
Additionally, strength in Cisco’s Meraki solutions and accelerated deployment of 5G and growing adoption of Wi-Fi 6 compliant devices are likely to strengthen demand for Meraki solutions, going forward. Rapid spread of IoT, increasing popularity of smart connected devices and growing adoption of cloud computing are also increasing demand for an efficient network support infrastructure. The company’s evolutions in areas like AI, ML and increasing adoption of cloud applications hold immense potential in the long-term.
.png)
Historical Financial Performance (Source: Company Reports).png)
.png)
Margins and Operating Cash Flow Trends (Source: Company Reports)
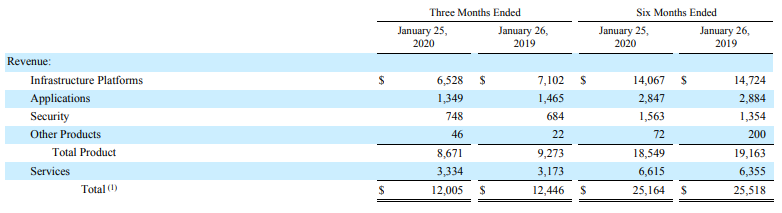
Earnings in 2QFY20 up Year over Year: The company reported 2QFY20 non-GAAP earnings of 77 cents per share, which increased ~5% year over year. However, revenues for the quarter came in at ~12 billion, down ~4% year over year. During the quarter, product revenues declined ~6% on a year-over-year basis and came in at $8.67 billion, this more than offset the 5% increase in service revenues which came in at $3.33 billion. Growth in service revenue was driven by higher sales in software and solution services. During the quarter, revenues from software subscriptions accounted for 72% of total software revenues. On a geographic basis, revenues from Americas, the EMEA and the APJC revenues fell 5%, 3% and 1% on pcp, respectively. Commercial, revenue for the quarter was down 4% year over year, whereas service provider and enterprise revenues declined ~7% and ~11%, respectively.
.png)
Top-line Highlights (Source: Company Reports)
Segment-wise Highlights: Infrastructure Platforms include Switching, NGN routing, Wireless and Data Center solutions. Revenues for the quarter came in at $6.53 billion, down 8% year over year. However, it is worth noting that the company saw strong demand for Catalyst 9K family of switches and Nexus 9K solutions, in the second quarter. Further, the company also saw growth in HyperFlex. Revenues from the applications segment came in at $1.35 billion, down 8% pcp. Security revenues, on the other hand, came in at $748 million, up 9% year over year. The increase was on the back of better-than-expected demand from advanced threat protection solutions, identity and access, along with unified threat management solutions.
During the period, the company’s cloud-based solutions, including Duo and Umbrella, witnessed robust demand. The company’s end-to-end methodology throughout the network, cloud and endpoints were key growth catalysts. The company also stated that 100% of the Fortune 100 are now utilizing its security solutions, which adds to the positives. Other Products segment revenues rose 110% to $46 million in 2QFY20.
Segment Details (Source: Company Reports)
Operating Highlights: During the quarter, non-GAAP gross margin stood at 66.4% and expanded 230 bps on a year over year basis. Non-GAAP product gross margin grew 310 bps on pcp, whereas service gross margin remained flat year over year at 66.6%. In 2QFY20, the company reported non-GAAP operating expenses were $3.93 billion, a decline of 1.1% on pcp. Non-GAAP operating margin stood at 33.7%, which increased 150 bps on pcp.
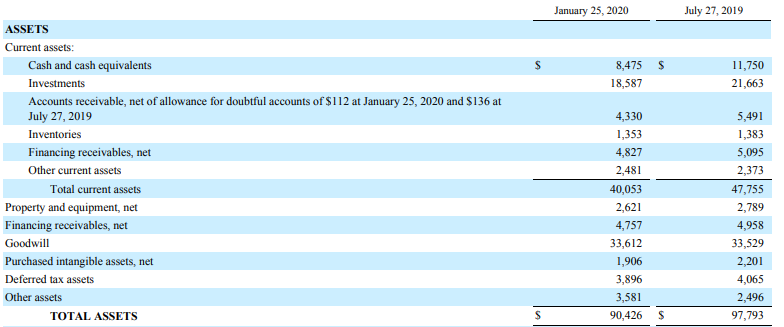
Balance Sheet & Cash Flow Details: The company exited the period with cash & cash equivalents and investments balance of ~$27.16 billion. Total debt at the end of the period stood at $15.99 billion. Operating cash flow for the second quarter remained unchanged from the year-ago quarter and came in at $3.8 billion. During the quarter, the company remained on track to return $2.4 billion to its shareholders in the form of share buybacks and dividends. Additionally, the company declared a quarterly dividend of 36 cents per share, an increase of 3% year over year.
Cash Balance Highlights (Source: Company Reports)
Key Developments: The company had recently stated that it has integrated with Microsoft’s Azure Virtual WAN and Office 365, along with an innate strategic alliance with Amazon cloud arm Amazon Web Services. The move has enabled the company to present highly secure end-to-end connectivity and better application performance to its users. Additionally, in the second quarter, the company unveiled Cisco Silicon One and the Cisco 8000 carrier-class router family powered on Silicon One. The company’s integrated IoT architecture helps to provide enhanced visibility, insights and threat detection across customers’ complete ecosystem.
Top 10 Shareholders: The top 10 shareholders have been highlighted in the table, which together forms around 26.32% of the total shareholding. The Vanguard Group, Inc. and BlackRock Institutional Trust Company, N.A. hold the maximum interests in the company at 8.32% and 4.93%, respectively.
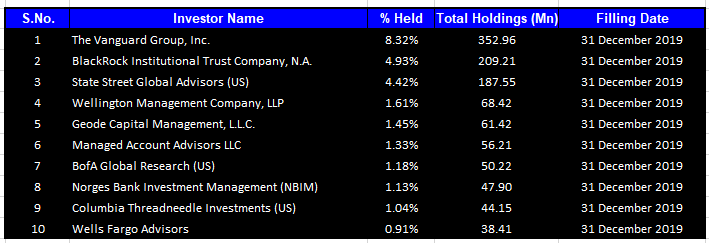
Top 10 Shareholders (Source: Thomson Reuters)
Key Metrics: The Company reported Jan’ FY20 gross margin at 64.7%, higher than the industry median of 50%. The EBITDA margin, during Jan’ FY20, stood in at 32.3%, higher than the industry median of 14.4%. Operating margin during Jan’ FY20 came in at 28.2%, higher than the industry median of 8.9%. Net margin, in the same time span, stood at 24%, higher than the industry median of 4.6%. Jan’ FY20 Return on equity stood at 8.2%, higher than the industry median of 0.6%.
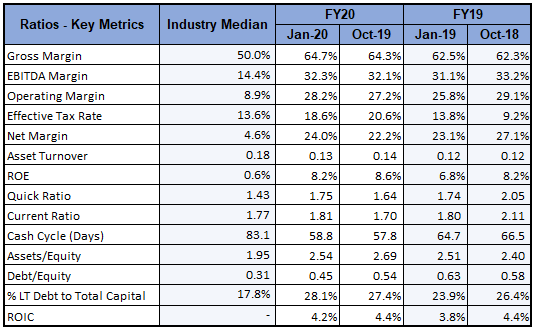
Key Metrics (Source: Thomson Reuters)
Outlook: Enhanced implementation of 5G and strong adoption of cloud computing applications hold promise contemplating the rapid growth in demand for video and other bandwidth-severe applications. A leading industry player, Cisco Systems, Inc, is well-positioned to gain from this demand. In fact, the company remains on track to invests in broadband, LTE, and fiber in order to improve Internet and wireless networks. These investments hold potential, going forward. The imminent 5G boom is also likely to boost the industry to newer peaks. This bodes well for Cisco. Furthermore, increased demand for Internet based services amid coronavirus crisis, has caused house arrest, which is likely to favor near-term prospects of the company.
For 3QFY20, the company expects revenues to decline 1.5-3.5% on a year-over-year basis. Further, the company expects non-GAAP gross margin to be in the ambit of 64.5-65.5% in the coming quarter, while operating margin is expected to be in the range of 32.5% and 33.5%. The company expects earnings on a non-GAAP basis to be in the range of 79 cents and 81 cents per share for 3QFY20.

Guidance for Q3 FY20 (Source: Company Reports)
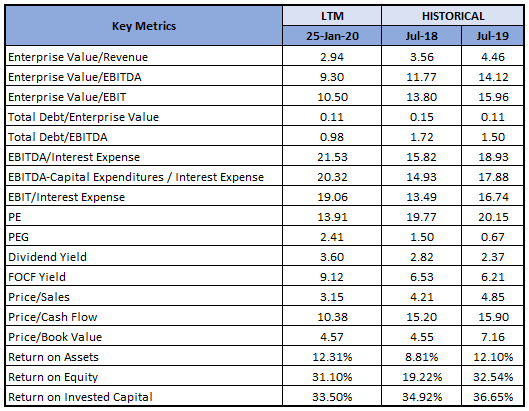
Key Valuation Metrics (Source: Thomson Reuters)
Valuation Methodology- P/CF Multiple Based Relative Valuation 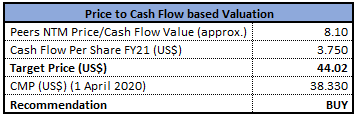
P/CF Based Valuation (Source: Thomson Reuters)
Note: All forecasted figures and peers have been taken from Thomson Reuters, NTM-Next Twelve Months
Stock Recommendation: The stock of CSCO closed at $38.33 with a market capitalization of ~$162.55 billion. The stock made a 52-week low and high of $32.4 and $58.26 and is currently trading below the average of its 52-week trading range. The stock has corrected by ~18% and ~27.2% in the last three months and one year, respectively. The business witnessed decent second-quarter results with bottom-line increasing on a year over year basis. CSCO remains on track to benefit from robust demand for its endpoints and the network. Considering the above factors and the potential despite the prevailing crisis scenario, we have valued the stock using P/CF multiple based relative valuation and arrived at a target price with an upside of lower double-digit (in % terms). For the purpose, we have taken peers like Arista Networks Inc (NYSE: ANET), Juniper Networks Inc (NYSE: JNPR), F5 Networks Inc (NASDAQ: FFIV), to name few. Hence, we recommend a “Buy” rating on the stock at the current market price of $38.33, down 2.49% on 01 April 2020.
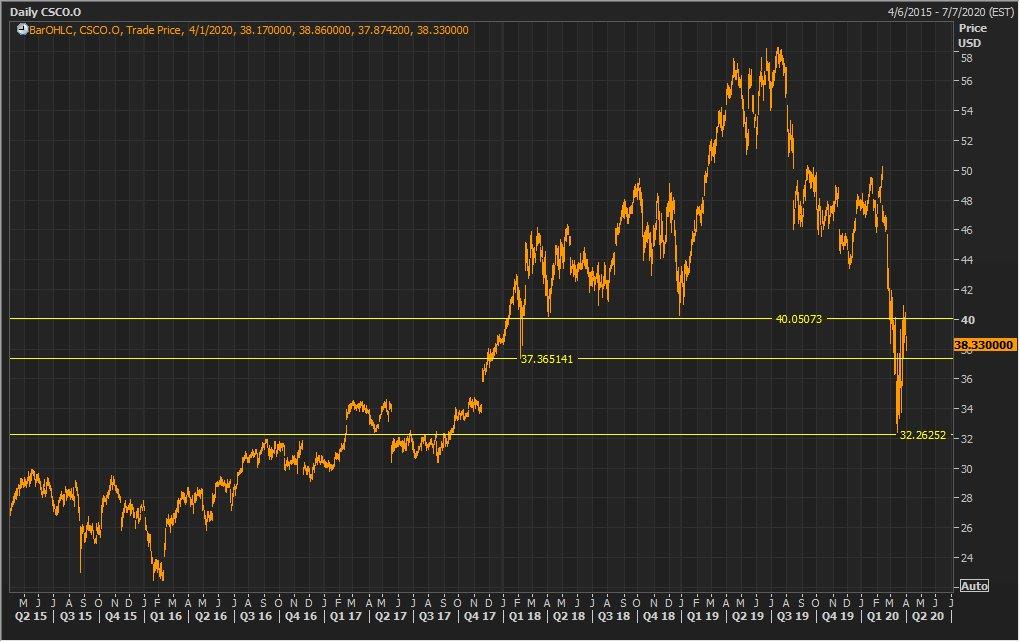
CSCO Daily Technical Chart (Source: Thomson Reuters)
Disclaimer
The advice given by Kalkine Pty Ltd and provided on this website is general information only and it does not take into account your investment objectives, financial situation or needs. You should therefore consider whether the advice is appropriate to your investment objectives, financial situation and needs before acting upon it. You should seek advice from a financial adviser, stockbroker or other professional (including taxation and legal advice) as necessary before acting on any advice. Not all investments are appropriate for all people. Kalkine.com.au and associated pages are published by Kalkine Pty Ltd ABN 34 154 808 312 (Australian Financial Services License Number 425376). The information on this website has been prepared from a wide variety of sources, which Kalkine Pty Ltd, to the best of its knowledge and belief, considers accurate. You should make your own enquiries about any investments and we strongly suggest you seek advice before acting upon any recommendation. Kalkine Pty Ltd has made every effort to ensure the reliability of information contained in its newsletters and websites. All information represents our views at the date of publication and may change without notice. To the extent permitted by law, Kalkine Pty Ltd excludes all liability for any loss or damage arising from the use of this website and any information published (including any indirect or consequential loss, any data loss or data corruption). If the law prohibits this exclusion, Kalkine Pty Ltd hereby limits its liability, to the extent permitted by law to the resupply of services. There may be a product disclosure statement or other offer document for the securities and financial products we write about in Kalkine Reports. You should obtain a copy of the product disclosure statement or offer document before making any decision about whether to acquire the security or product. The link to our Terms & Conditions has been provided please go through them and also have a read of the Financial Services Guide. On the date of publishing this report (mentioned on the website), employees and/or associates of Kalkine Pty Ltd do not hold positions in any of the stocks covered on the website. These stocks can change any time and readers of the reports should not consider these stocks as personalised advice.
Past performance is not a reliable indicator of future performance.
 Please wait processing your request...