This report is an updated version of the report published on 8 August 2025 at 11:14 AM AEST
Section 1: Company Overview, Low Carbon Emission Initiatives and Fundamentals
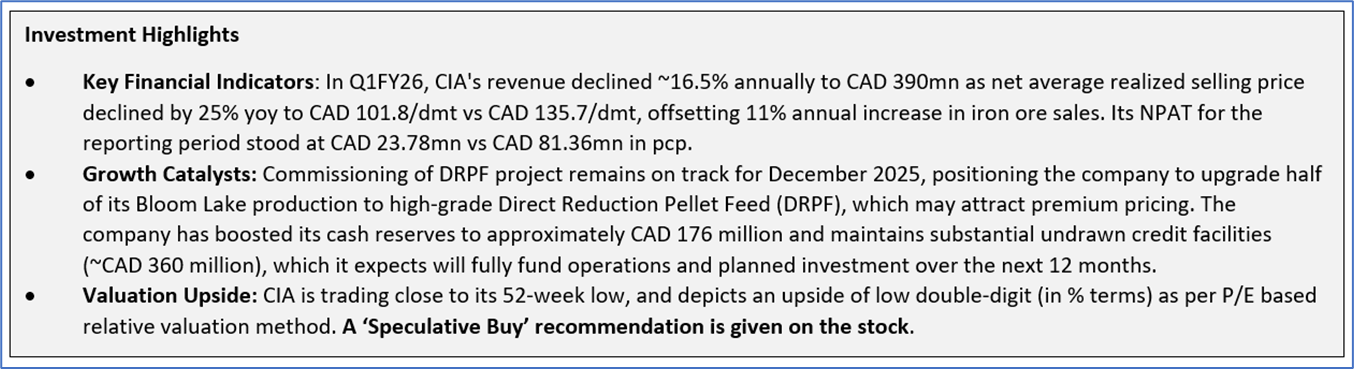
Section 1.1: Champion Iron Limited (ASX: CIA) is an iron ore exploration and mining company focused on the production of high-grade iron ore concentrate. Through its wholly owned subsidiary, Quebec Iron Ore Inc., CIA operates the Bloom Lake Mining Complex located in Québec's Labrador Trough. The company is advancing the DRPF Project and the Kami Project. Kalkine’s Low Carbon Research Report covers the Investment Highlights, Low Carbon Emission Initiatives, Key Financial Metrics, Risks, and Technical Analysis along with the Valuation, Target Price, and Recommendation on the stock.
Section 1.2: Why Low Carbon Emission Matters?
The shift toward a low-carbon economy is one of the most significant challenges of current time, spurred by the urgent need to combat climate change and reduce the environmental impact of corporate activities. This report covers the ASX-listed low-carbon emission company, Champion Iron Ltd (ASX: CIA), that is committed to sustainability and responsible environmental practices.
Carbon and Waste Management - Key Metrics
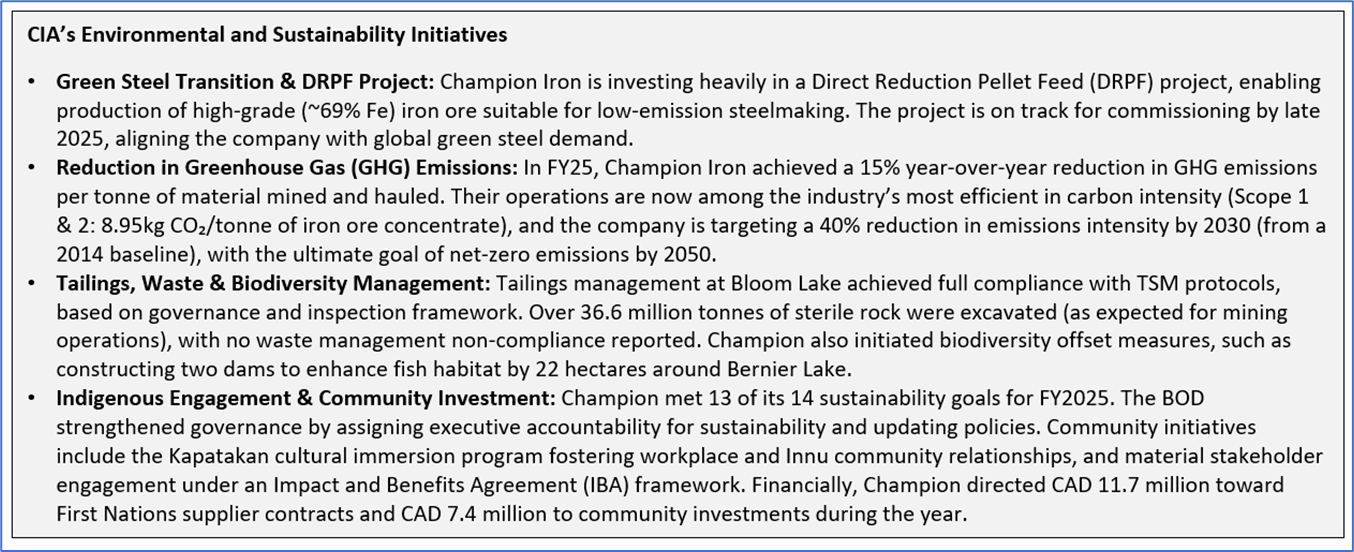
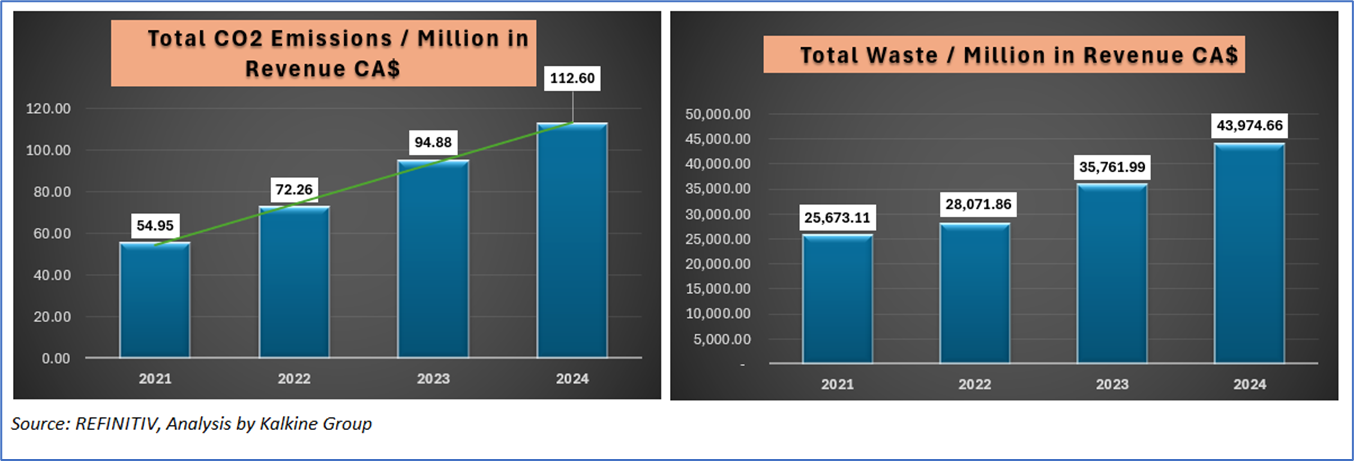
The image below highlights that the total CO₂ emissions per million revenues have grown more than double in four years, as production volumes at Bloom Lake led to increased total energy use, despite efficiency gains in some areas. However, the company is investing in long-term sustainability, like the DRPF project supporting lower-emission steelmaking, electrification of processes, and increased renewable (hydro) power. However, many of these are large capital projects with impacts that will materialize post-2025 (e.g., DRPF commissioning in December 2025). Thus, the benefits haven’t yet reflected in metrics. Adjacently, the rise in Champion Iron’s total waste per million revenues is largely driven by operational and market dynamics rather than poor waste management. Expansion activities at Bloom Lake, including pre-stripping to access new ore zones, temporarily increased waste rock removal, while variations in ore grade required moving more material to meet production targets. Despite this trend, Champion Iron maintained strong environmental controls, achieving 99% process water recycling, 100% compliance in tailings monitoring, and progressive land rehabilitation.
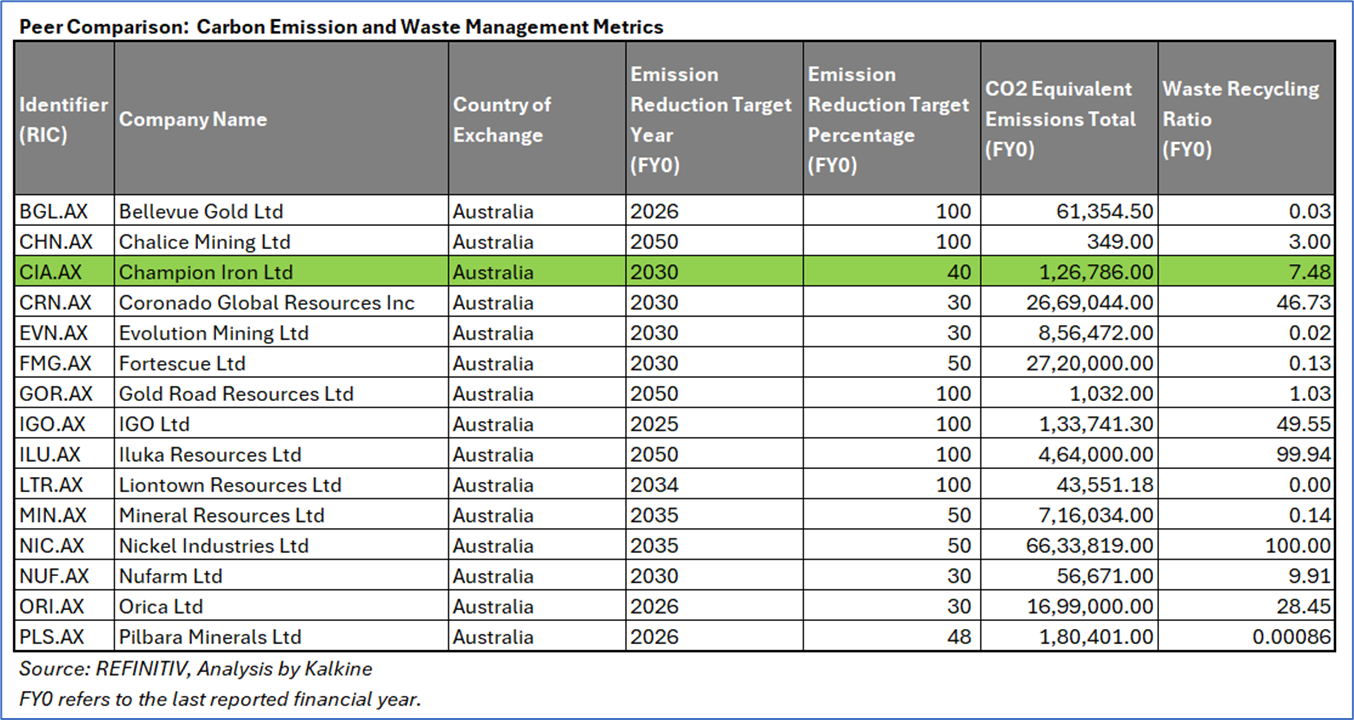
Peer Comparison: Carbon Emission and Waste Management Metrics
The peer comparison chart below highlighted that CIA has set a 2030 target year for achieving a 40% reduction in Scope 1 and 2 greenhouse gas emissions, aligning with its published decarbonisation roadmap. In FY24, Champion Iron reported 126,786 tonnes of CO₂ equivalent emissions, which is moderate compared to bulk mining peers, reflecting both its operational scale and energy use profile. The waste recycling ratio of 7.48% is below industry leaders, largely due to the nature of iron ore mining, where waste rock and tailings dominate waste streams and have limited recycling potential. Nonetheless, the company has achieved a 15% year-on-year reduction for FY25 in GHG emissions per tonne mined and has implemented progressive waste and tailings management, including 99% process water recycling and land rehabilitation programs. This positions CIA as actively improving efficiency while still facing the sector-wide challenge of large absolute waste volumes inherent in bulk commodities.
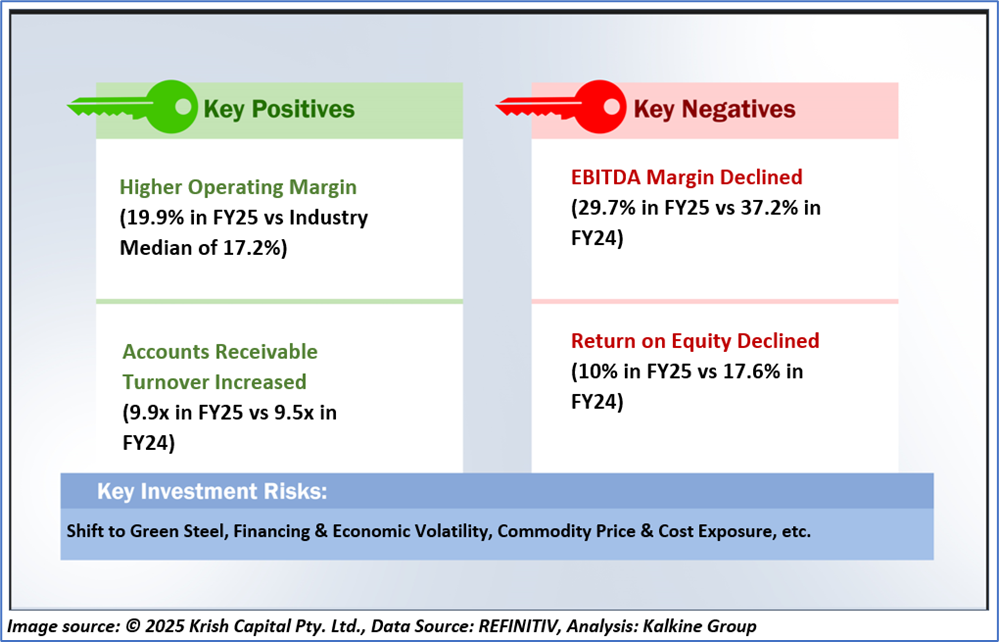
1.3 The Key Positives, Negatives, Investment Highlights, and Risks
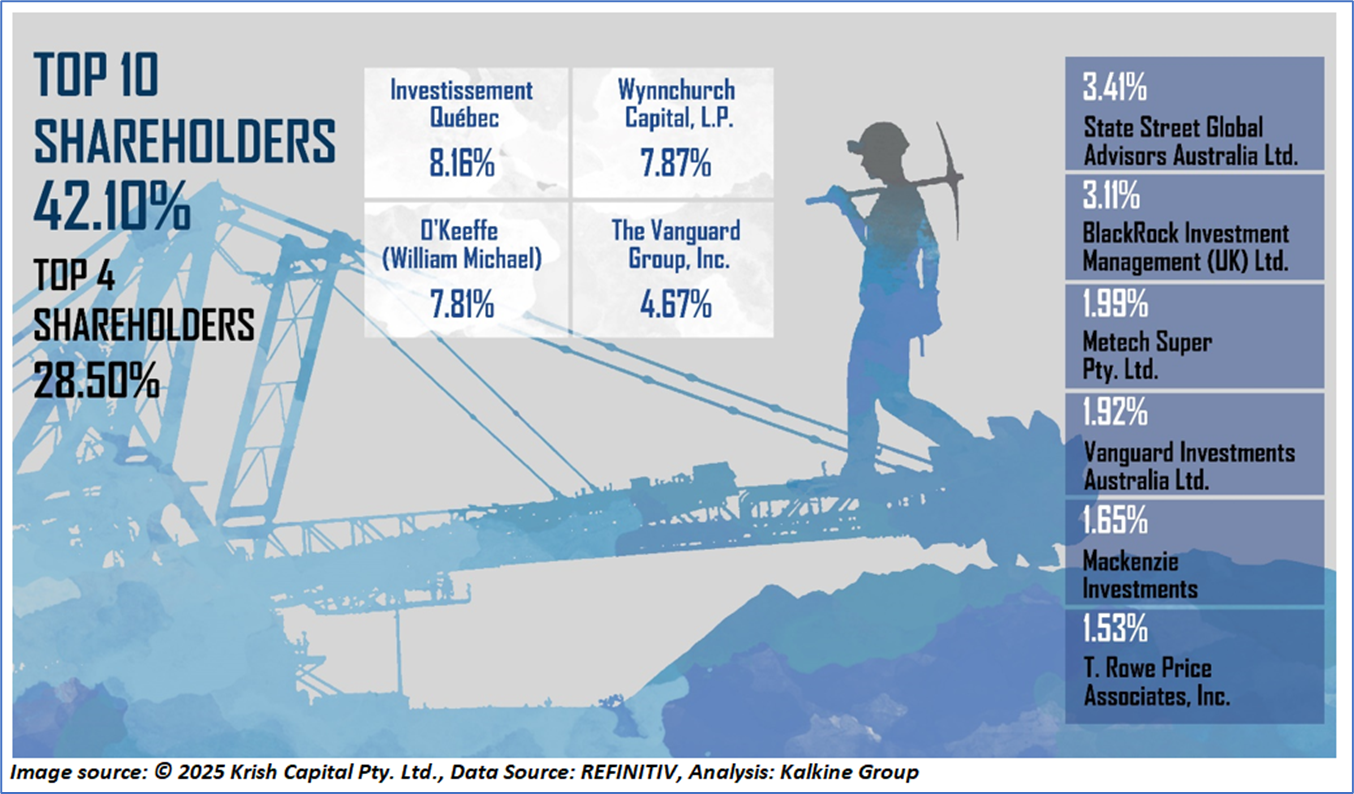
1.4 Top 10 Shareholders:
The top 10 shareholders together form ~42.10% of the total shareholding. Investissement Québec and Wynnchurch Capital, L.P., hold maximum stakes in the company at ~8.16% and ~7.87%, respectively.
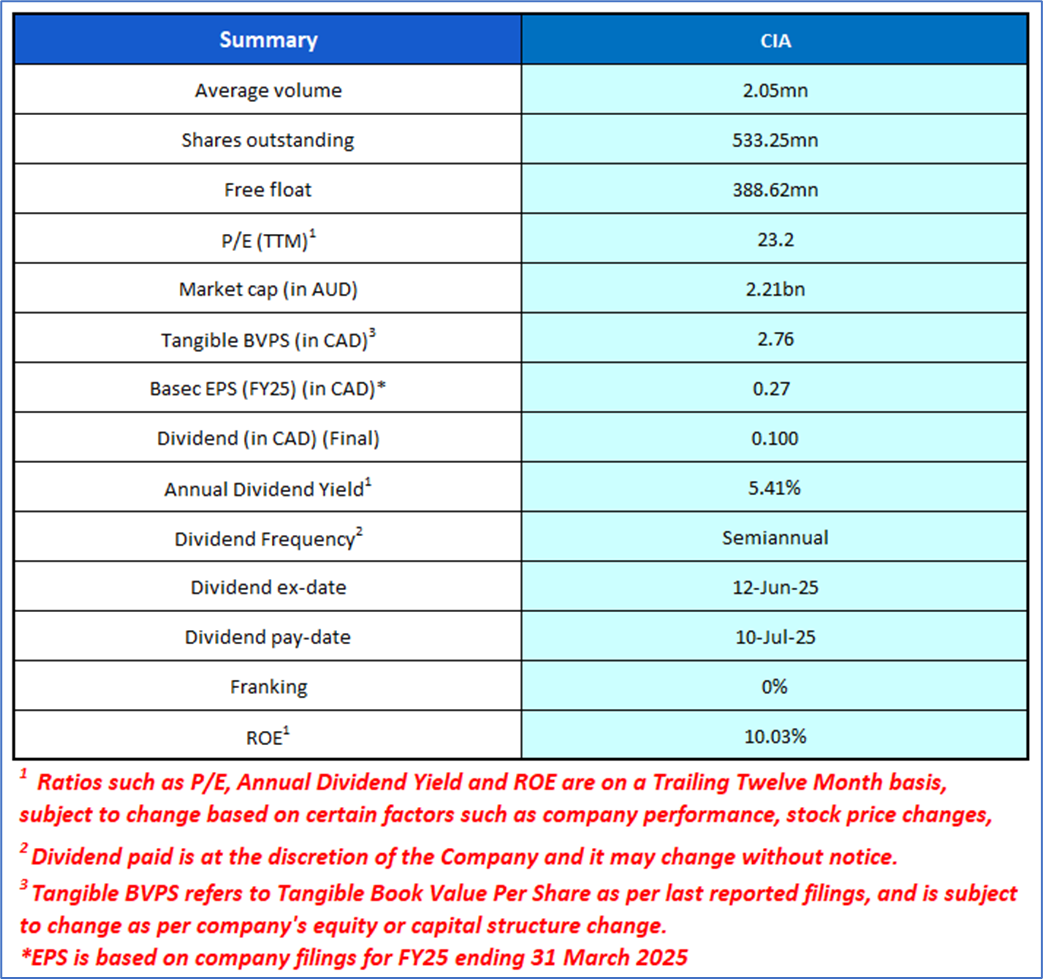
1.5 Key Metrics: In FY25, CIA's operating margin stood at 19.9% vs industry median of 17.2%. Below are captured other metrics:

Section 2: Business Updates, Financial and Operational Highlights
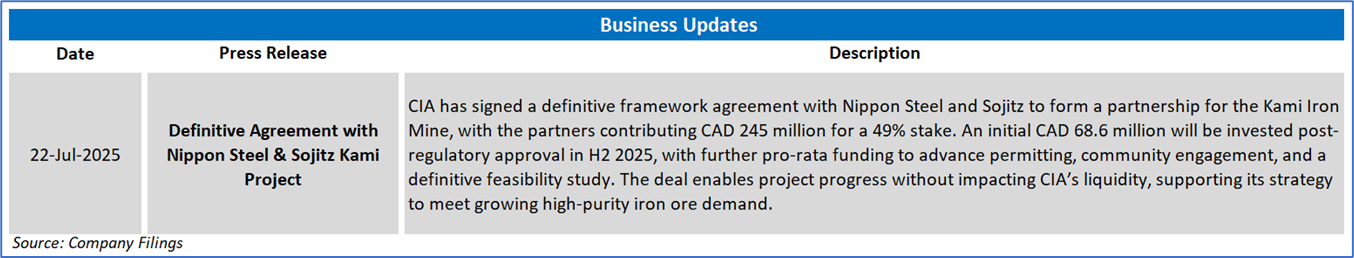
2.1 Recent Business Updates:
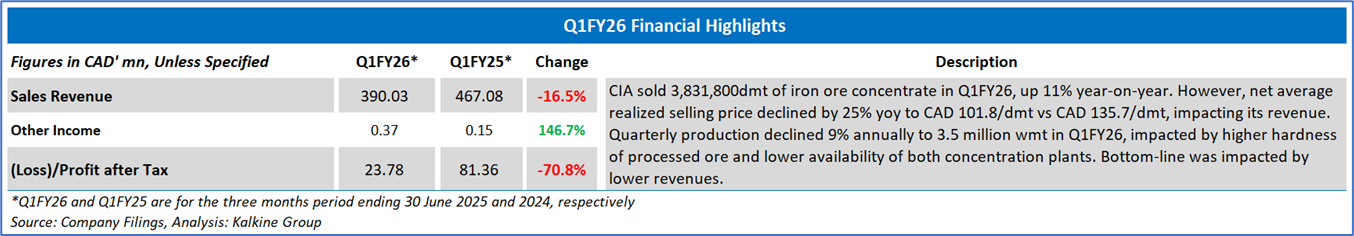
2.2 Results Highlights
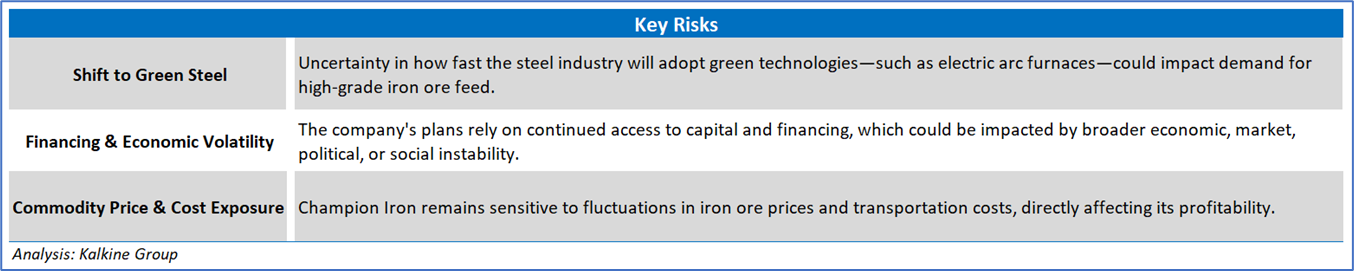
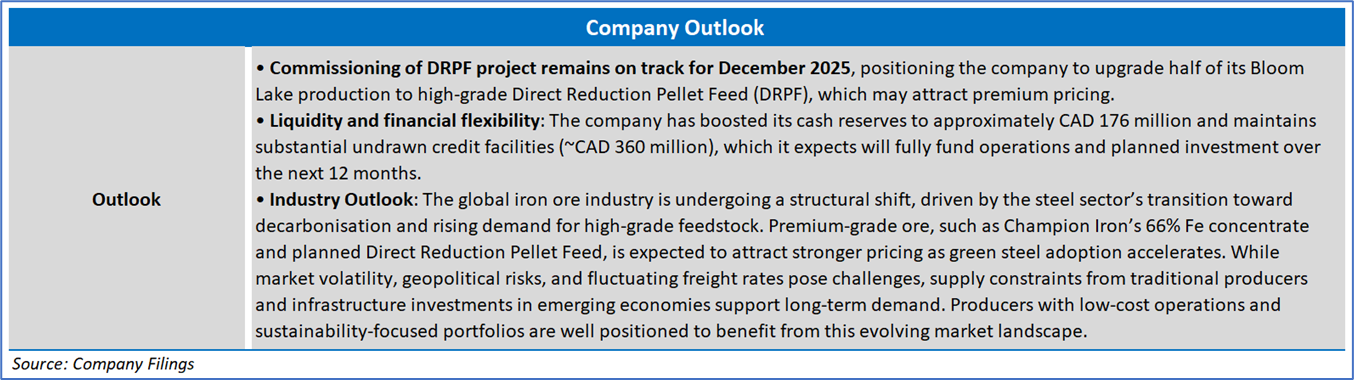
Section 3: Key Risks and Outlook:
Section 4: Stock Recommendation Summary
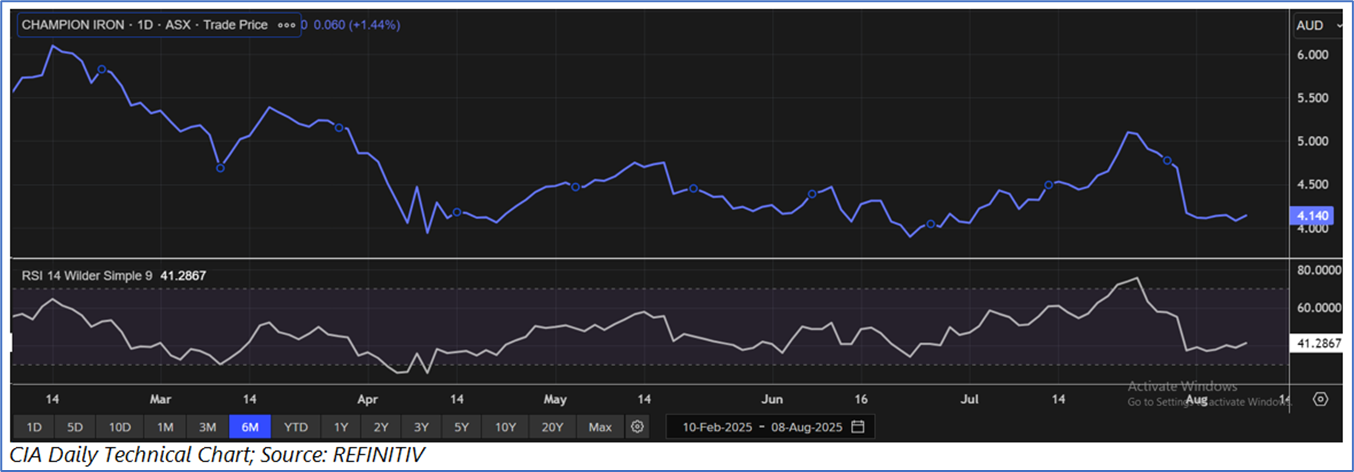
4.1 Price Performance and Technical Summary
The stock price has declined by ~4.55% in the last one month, whereas over the last six months, it has declined by ~29.47%. The stock has a 52-week low and 52-week high of AUD 3.895 and AUD 7.570, respectively, and is currently trading close to its 52-week low. CIA was last covered in a report dated ‘23 July 2025’.
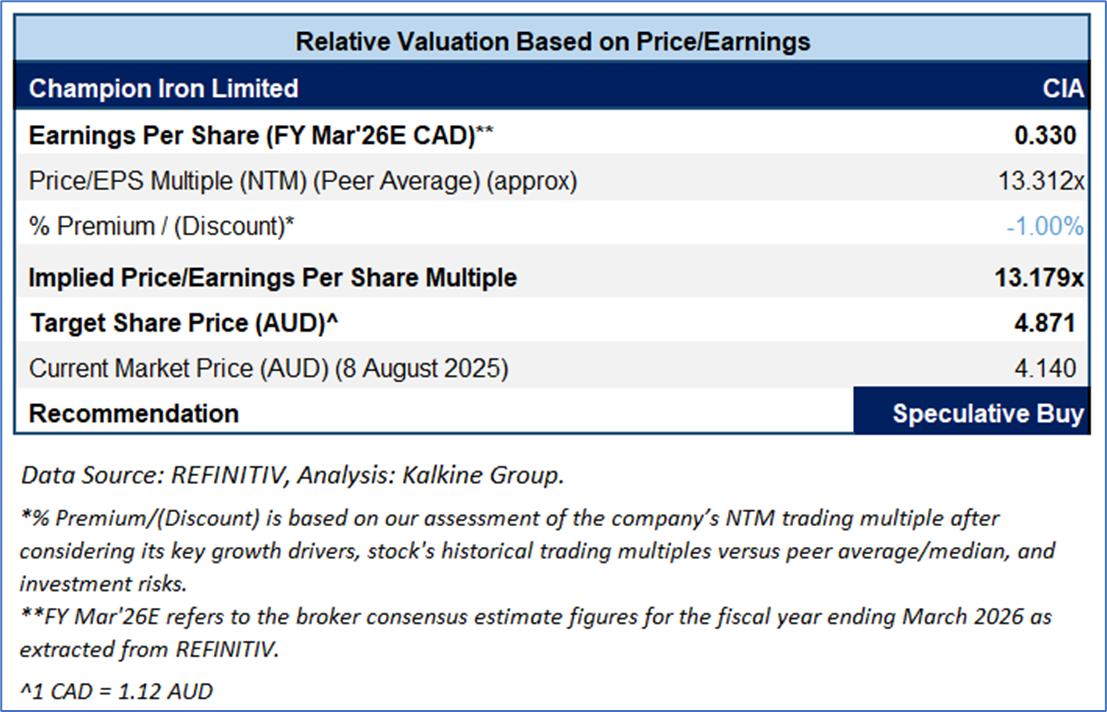
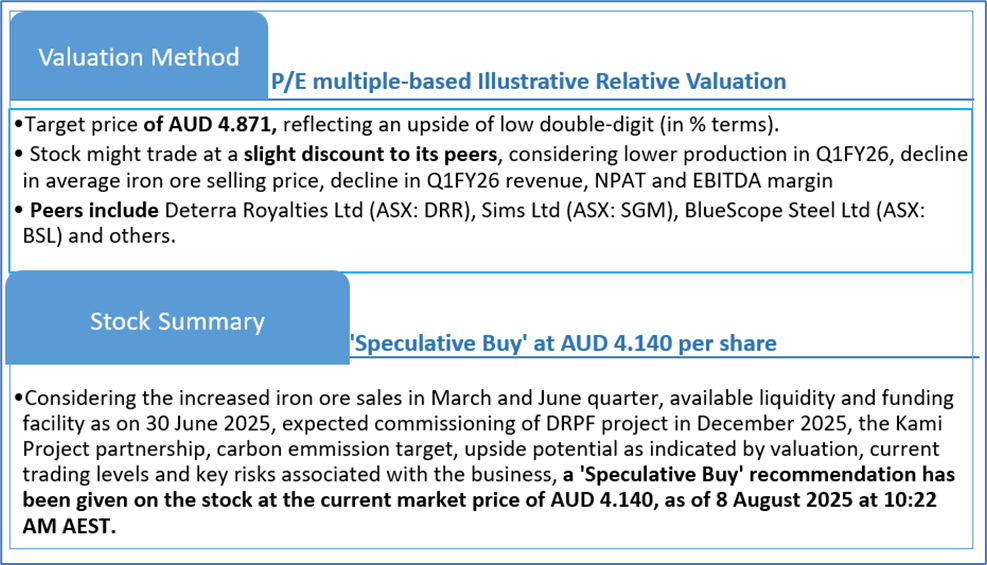
4.2 Fundamental Valuation
Valuation Methodology: P/E Multiple Based Relative Valuation (Illustrative)
Markets are trading in a highly volatile zone currently due to certain macro-economic issues and geopolitical tensions prevailing. Therefore, it is prudent to follow a cautious approach while investing.
Note 1: Past performance is neither an indicator nor a guarantee of future performance.
Note 2: The reference date for all price data, currency, technical indicators, support, and resistance levels is 8 August 2025. The reference data in this report has been partly sourced from REFINITIV.
Note 3: Investment decisions should be made depending on an individual's appetite for upside potential, risks, holding duration, and any previous holdings. An 'Exit' from the stock can be considered if the Target Price mentioned as per the Valuation and or the technical levels provided has been achieved and is subject to the factors discussed above.
Note 4: Dividend Yield may vary as per the stock price movement.
Note 5: Kalkine reports are prepared based on the stock prices captured either from REFINITIV or Trading View. Typically, REFINITIV or Trading View may reflect stock prices with a delay which could be a lag of 25-30 minutes. There can be no assurance that future results or events will be consistent with the information provided in the report. The information is subject to change without any prior notice.
Technical Indicators Defined: -
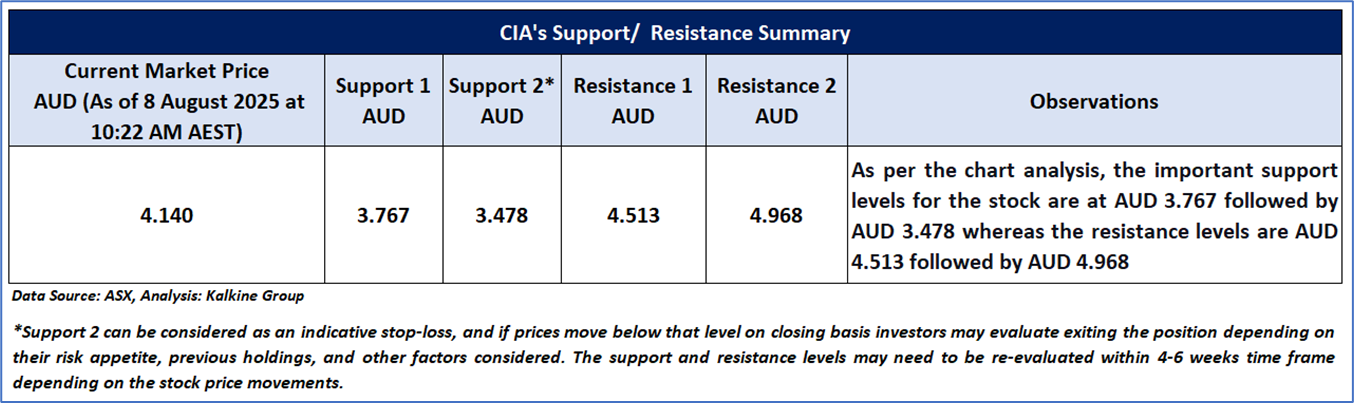
Support: A level at which the stock prices tend to find support if they are falling, and a downtrend may take a pause backed by demand or buying interest. Support 1 refers to the nearby support level for the stock and if the price breaches the level, then Support 2 may act as the crucial support level for the stock.
Resistance: A level at which the stock prices tend to find resistance when they are rising, and an uptrend may take a pause due to profit booking or selling interest. Resistance 1 refers to the nearby resistance level for the stock and if the price surpasses the level, then Resistance 2 may act as the crucial resistance level for the stock.
Stop-loss: It is a level to protect further losses in case of unfavourable movement in the stock prices.
This report (“Report”) has been issued by Kalkine Pty Limited (ABN 34 154 808 312) (Australian financial services licence number 425376) (“Kalkine”) and prepared by Kalkine and its related bodies corporate who are authorised to provide general financial product advice. Kalkine.com.au and its associated pages are published by Kalkine.
Any advice provided in this Report is general advice only and does not take into account your objectives, financial situation or needs. You should therefore consider whether the advice is appropriate for your objectives, financial situation and needs before acting upon it.
There may be a Product Disclosure Statement, Information Memorandum or other offer document (“Offer Document”) for the securities or other financial products referred in this Report. You should obtain a copy of the relevant Offer Document and consider it before making any decision about whether to acquire the security or financial product.
Kalkine strongly recommends that you seek advice from a financial adviser, stockbroker or other professional (including taxation and legal advice) before acting on any of the general advice in this Report or on the Kalkine website. Not all investments are appropriate for all people.
The information in this Report and on the Kalkine website has been prepared from a wide variety of sources, which Kalkine, to the best of its knowledge and belief, considers accurate. Kalkine has made every effort to ensure the reliability of the information contained in its reports (including this Report), newsletters and websites. All information represents our views at the date of publication and may change without notice.
The information in this Report does not constitute an offer to sell securities or other financial products or a solicitation of an offer to buy securities or other financial products. Our reports contain general recommendations to invest in securities and other financial products. Kalkine is not responsible for, and does not guarantee, the performance of, or returns on, any investments mentioned in this Report.
Kalkine does not issue, sell or deal in any financial products.
This Report may contain information on past performance of particular investments. Past performance is not a reliable indicator of future performance. Returns stated do not take into account transaction costs and taxes. To the extent permitted by law, and excluding any dishonesty or gross negligence by Kalkine, Kalkine disclaims and excludes all liability for any direct, indirect, implied, punitive, special, incidental or other consequential loss or damage arising from the use of or reliance on this Report, the Kalkine website and any information published on the Kalkine website without any warranties or representations by Kalkine to you. To the extent the law prohibits or limits this exclusion, Kalkine limits its liability to the resupply of services.
Please also read our Terms & Conditions and Financial Services Guide for further information. Employees and/or associates of Kalkine and its related entities may hold interests in the securities or other financial products covered in this Report or on the Kalkine website. Any such employees and associates are required to comply with certain, procedures and disclosures as required by law.
Kalkine Media Pty Ltd, an affiliate of Kalkine Pty Ltd, may have received, or be entitled to receive, financial consideration in connection with providing information about certain entity(s) covered on its website including entities covered in this Report.
Copyright 2025 Krish Capital Pty. Ltd. (ABN 61629651510). All Rights Reserved. No part of this report, or its content, may be reproduced in any form without our prior consent.
Past performance is not a reliable indicator of future performance.
 Please wait processing your request...