Kalkine has a fully transformed New Avatar.

Company Overview: carsales.com Limited is an online automotive, motorcycle and marine classifieds business. The Company's carsales network is an online destination for buying and selling cars, motorbikes, trucks, boats, caravans and machinery equipment. Its segments include Online Advertising Services, Data and Research Services, International, and Finance and Related Services. The Online Advertising Services segment includes online advertising offerings, such as classified advertising and display advertising services. The Data and Research Services segment offers products, including software, analysis, research and reporting, valuation services, and Website development and hosting, as well as photography services. The International segment includes its operations in overseas countries. The Finance and Related Services segment includes the operations of its subsidiary, Stratton Finance Pty Ltd, which provides vehicle finance arrangements, vehicle procurement and other related services to customers.
.png)
CAR Details
Strategic Investment Support Growth Momentum: carsales.com Limited (ASX: CAR) ended FY 2018 on the strong note and the company generated total revenues amounting to A$444.0 million which implies the YoY growth of 19%. The company’s Online Advertising and Data, Research, and Services segments witnessed the YoY growth in the revenues of 10% and 7%, respectively on the back of deployments which have been made towards enhanced as well as new product initiatives. Talking about the international business, the company’s Asia segment was supported by SK Encar consolidation and the company’s Latin America business also witnessed robust momentum because of the deployment made. The company’s total EBITDA amounted to $204.6 million which reflects the growth of 16% on the YoY basis. Further, the company’s EBITDA has witnessed the CAGR growth of 10.3% in the span of previous five years to FY 2018. The underlying EBITDA growth with regards to Online Advertising as well as Data, Research and Services business was witnessed because of the expansion of the core business margins. The Finance segment’s EBITDA margin performance got a hit in FY18 because of higher sales of lower margin products, soften average volume bonuses, and additional sales commissions on higher volumes and investment in people and technology incurred during the period. CAR has a strong return ratio with improved earnings retention multiple of 0.42x as at June 30, 2018 from the previous year where it was at 0.11x. Moreover, the company is paying a decent dividend regularly to its shareholders and maintains strong net margin as compared to the Industry average. Given the backdrop of aforesaid facts, we expect these metrics will steadily improve over the coming years. At CMP of $11.330, the stock of the company is trading at P/E 17.96x of FY20E EPS. Keeping the view of a positive outlook in the business along with tight legislations and credit markets, we have valued the stock using the Relative valuation method and five-year average P/E of 21.4x for FY20E with EPS of $0.76 and have arrived at target price upside of about single high digit to low double-digit. Key risks are regulatory risk, low entry barrier business model, intense competition, and shifts in consumer preferences, etc.
Key Financial Metrics:
.png)
Source: Company Report, Thomson Reuters, *- Reported
Needle on Key Indicators:
1. Healthy Pay-out ratio: Over the last five years, the company has consistently distributed stable dividends with healthy payout ratios in the range of 75% to 82%. The annual dividend yield of the company is about 3.5% on a five-year average basis (FY14-18). Currently, the annual dividend yield of carsales.com happens to be at 3.85% which is higher as compared to the industry average of 3.0%. Based on strong performance in FY18, the company had declared the final dividend of 23.7 cents per share which implies the rise of 10% on the prior corresponding period. This summarized a total dividend payment of 44.2 cents per share for the full year, representing a dividend payout ratio of 82.0%. In FY 2017, the company declared the total dividend amounting to 40.2 cents per share. The YoY growth in the total dividend might support the company garnering the focus of the market participants moving forward.
.png)
2. Strong Return Ratios: During the one-year span of time, the RoE and RoCE substantially increased from 41.5% and 23.8% to 61.5% and 35.9%, respectively which is above the industry average of 33.2% (RoE). This was mainly supported by strong growth in all front across the overall market in FY18. By looking at tight credit market and ASIC legislation, we presume that the return ratios will be largely stable in FY19E in view of maintaining trend in sales supported by its business strategy towards its core business in domestic and international market.
.png)
3. Healthy Operating and Free Cash Flow: The company is into the asset-light business model which generates good cash flows and enables relatively low financial leverage and sustainable dividends to its shareholders. Over the five years, operating cash flow and free cash flow have grown at CAGR of 4.2% and 2.7%, respectively on the back of product mix growth in the domestic and overseas market. Further, we believe that the company is likely to maintain its sales growth, expansion in margins and expecting to generate decent cash flows in the upcoming years. In the long run, Cash flows will rise on the back of operational efficiencies and strong marketing strategy across its product mix.
.png)
Healthy Operating and Free Cash Flow (Source: Company Reports)
4. Marginal Fall in EBITDA Margin: Over the past five-year, EBITDA margin came in at 50.3% on an average basis which is higher than the industry average of 39.2%. However, in FY18, EBITDA margin decreased to 46.1% over the prior year. This was mainly impacted by the higher contribution of lesser margin product mix and fall in the margins of its subsidiary Stratton Finance Pty Ltd. (although, the achievement of the operating leverage has supported the domestic core business margins). Carsales Asia had supported the margins on the back of SK Encar consolidation.
.png)
EBITDA Margin (Source: Company Reports)
Carsales Possessing Strong Balance Sheet Metrics, Decent Leverage Ratio: The cash capital expenditure of carsales.com has witnessed a significant rise in FY 2018 on the YoY basis largely because of the higher expenses related to ERP & CRM systems’ implementation. The company’s cash capital expenditure amounted to $8.6 million in FY 2018 while in FY 2017 it was $2.9 million. Its capitalized labour costs witnessed a YoY increase of 27% to $11.7 million because of the deployments towards technology platforms which help in terms of international as well as adjacent market expansion. The company’s net debt amounted to around $390 million at the end of June 2018 while at the end of June 2017 it was around $153 million largely indicating increased debt required for the financing related to acquisition of SK Encar. The company happens to maintain its leverage ratio at the decent levels as it was 1.9x. There has been a fall with regards to the net interest coverage ratio because of the financing related to the acquisition of SK Encar with the help the debt. However, still, the company is possessing robust position when it comes to overall interest cover.
.PNG)
CAR’s Total CAPEX, reported leverage ratio and reported net interest cover (Source: Company Reports)
CAR’s Total Domestic Revenue Rose 12% YoY: carsales.com generated total domestic revenues amounting to $405.9 million in FY 2018 which implies the growth of 12% on the YoY basis. The company encountered robust growth with respect to the core dealer advertising products on the back of improvements in the yields and volume growth. Further, the company has managed to maintain the decent growth in the revenues related to core private listing products in the second half which was witnessed in the first half primarily because of higher adoption with regards to private premium listing products and positive yield in relation to tiered pricing.
.png)
Dealer and Private Performance (Source: Company Reports)
Favorable Momentum in International Expansion Strategy: The international expansion strategy of the carsales.com has been ramping up at the decent pace, and the favorable momentum was also witnessed in the EBITDA as well as revenue contribution. CAR is also very optimistic about the global technology platform development and the company believes that moving forward, the revenues would be witnessing positive momentum. The EBITDA contributions with respect to the Webmotors, Chile as well as SK Encar has been positive.
CAR Expecting Non-Cash Impairment Charge: carsales.com had recently made an announcement related to the non-cash impairment charge. As per the press release dated December 18, 2018, the company is expecting the recognition of the non-cash impairment charge with regards to carrying value. This carrying value would be of its stake in Stratton which is of 50.1%. The non-cash impairment charge would be around A$48 million.
The company had stated that its financial report also throws light on the external factors which could have a significant impact on Stratton Finance CGU’s valuation. The external factors also consist of the market conditions related to the credit which were tighter as well as ASIC legislative changes with regards to the car financing. The issued release also stated that the company would be reporting this anticipated non-cash impairment charge as the “adjusting item” to the net profit. Also, the company’s FY 2019 final or interim dividend’s evaluation or the company’s funding covenants would not be impacted. In FY 2019, the company believes that it would witness net profit share from the Stratton of approximately $1.0 million.
Drivers for Future: As depicted by the carsales.com annual general meeting or AGM presentation, the company had stated that, in 1Q FY 2019, the domestic core business performance was robust. The company had also stated that if the market conditions remain stable, there are expectations that the growth in the NPAT, revenues as well as EBITDA would be largely stable. However, the growth in the earnings would be inclined towards H2 because of the expectations about the improvement in the display advertising performance.
With respect to the carsales.com international portfolio, the company had stated that the good performance was witnessed in Q1. On the assumption of the stability in the market conditions of Brazil, there are expectations for the robust momentum in the earnings as well as revenues in terms of the local currency with respect to the Webmotors in FY 2019. However, in FY 2019, with respect to South Korea, the company expects solid local currency revenue and earnings growth for SK Encar.
.png)
Historical PE Band (Source: Company Reports)
Stock Analysis & Recommendation: In the last three months, the stock has been down by around 18.71% and is trading close to its low levels. The technical indicators, Moving Average Convergence Divergence or MACD and Exponential Moving Average or EMA have been applied on the daily chart of carsales.com Limited, and default values have been plugged in. As per the observation, the MACD line has crossed the signal line and is moving upwards. This signifies the possibility for the bullish momentum. Therefore, the stock might witness uptrend moving forward. Also, Exponential Moving Average or EMA was applied using the default values on the company’s daily chart. As per the observation, the stock price had crossed the EMA and had moved upwards after the crossover. This also represents the bullish momentum. On the other hand, based on the healthy performance of the company from the previous five years in terms of revenues as well as EBITDA, decent leverage ratio, robust overall interest cover and healthy payout ratio we expect that the company has potential to grow moving forward. Keeping the view of a positive outlook in the business along with tight legislations and credit markets, we have valued the stock using the Relative valuation method and five-year average P/E of 21.4x for FY20E with EPS of $0.76 and have arrived at target price upside of about single high digit to low double-digit. Factoring in all the above-mentioned parameters, we give a “Buy” recommendation on the stock at the current market price of $11.330.
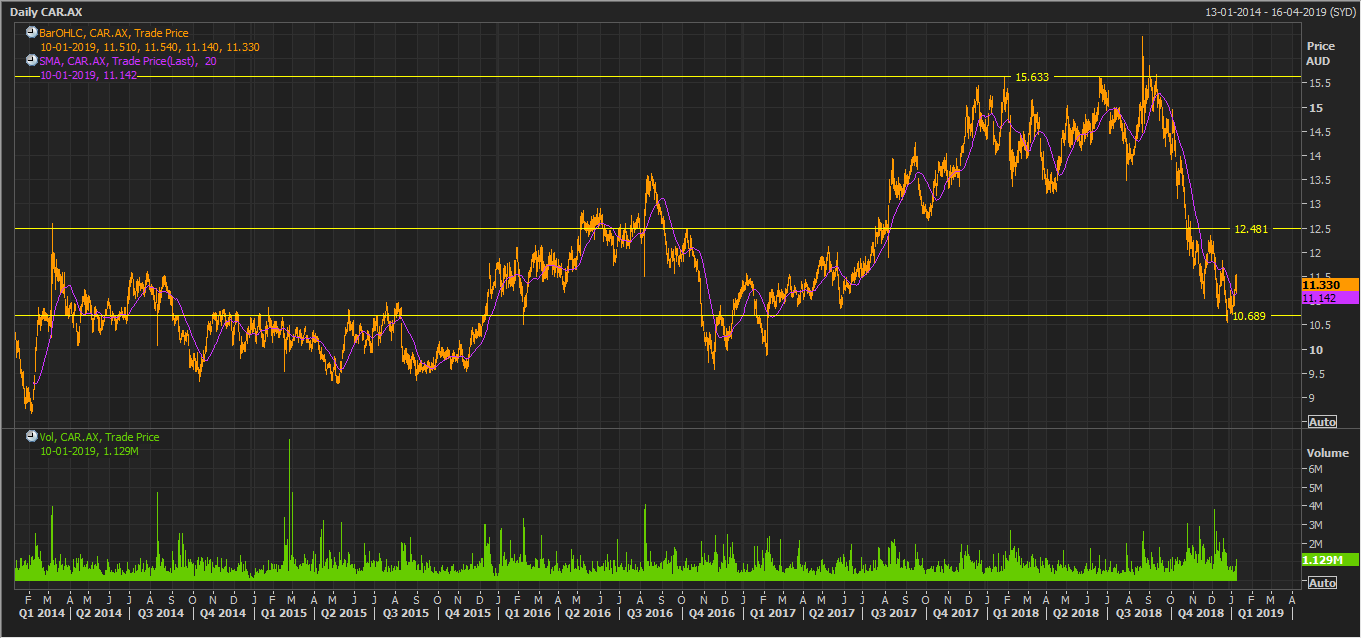
CAR Daily Chart (Source: Thomson Reuters)
Disclaimer
The advice given by Kalkine Pty Ltd and provided on this website is general information only and it does not take into account your investment objectives, financial situation or needs. You should therefore consider whether the advice is appropriate to your investment objectives, financial situation and needs before acting upon it. You should seek advice from a financial adviser, stockbroker or other professional (including taxation and legal advice) as necessary before acting on any advice. Not all investments are appropriate for all people. Kalkine.com.au and associated pages are published by Kalkine Pty Ltd ABN 34 154 808 312 (Australian Financial Services License Number 425376). The information on this website has been prepared from a wide variety of sources, which Kalkine Pty Ltd, to the best of its knowledge and belief, considers accurate. You should make your own enquiries about any investments and we strongly suggest you seek advice before acting upon any recommendation. Kalkine Pty Ltd has made every effort to ensure the reliability of information contained in its newsletters and websites. All information represents our views at the date of publication and may change without notice. To the extent permitted by law, Kalkine Pty Ltd excludes all liability for any loss or damage arising from the use of this website and any information published (including any indirect or consequential loss, any data loss or data corruption). If the law prohibits this exclusion, Kalkine Pty Ltd hereby limits its liability, to the extent permitted by law to the resupply of services. There may be a product disclosure statement or other offer document for the securities and financial products we write about in Kalkine Reports. You should obtain a copy of the product disclosure statement or offer document before making any decision about whether to acquire the security or product. The link to our Terms & Conditions has been provided please go through them and also have a read of the Financial Services Guide. On the date of publishing this report (mentioned on the website), employees and/or associates of Kalkine Pty Ltd do not hold positions in any of the stocks covered on the website. These stocks can change any time and readers of the reports should not consider these stocks as advice or recommendations.
 Please wait processing your request...