Kalkine has a fully transformed New Avatar.

I. Sector Landscape and Outlook
Capital goods sector comprises of companies that are into manufacturing and distribution of goods including industrial machinery, electrical equipment, aerospace and defense machinery, and machineries related to engineering, and construction projects. These companies assist in producing the final goods whose value echoes the GDP of a country.
As the sector serves the manufacturing companies primarily, its performance is directly linked with the performance of the manufacturing sector. The manufacturing sector is dependent on how the economy is faring. The stronger the economy, the better is the performance of the manufacturing sector and the capital goods industry.
According to the Reserve Bank of Australia, the Australian economy is expected to record a ~10% contraction in GDP over the first half of 2020 because of the COVID-19 pandemic and the containment measures. According to an IMF report, Australia's economy is set to decline by 6.7% in 2020 and is expected to regain traction in 2021 with a growth rate of 6.1%. To boost the GDP, Australia must invest in capital goods and strengthen sectors which drive the demand for capital goods, including construction, mining, electrical, textile and other industries.
In light of that, in this sector report, we have exhaustively examined the supply and demand within the industry to uncover the industry dynamics and demystify the performance of the companies operating within the industry.
Understanding demand and supply Dynamics
Capital goods industry demand in Australia stems from both national and international level. Hence the World economy has a major bearing on the Australian capital goods industry performance. The world economy is currently going through turmoil due to the COVID-19 pandemic. With social distancing at place and lockdown imposed at many industrial zones, the manufacturing sector across the world has come to a halt. Many industries deemed as essential businesses are experiencing labour shortage affecting sector performance and economy consequently. With industry experts anticipating a recession, and the governments across the world taking proactive steps to avoid the same, the world economy is yet to pick up pace in its way to recovery. Let’s see how the world economy and the Australian economy are set to perform in the near future and long-term.
The World Economy
According to the IMF, the global economy is set to contract by 3% in 2020 because of the pandemic. Given, the pandemic subsides in the second half of 2020 and containment efforts are lifted gradually, the global economy is estimated to grow by 5.8% in 2021. Effective policies, contagion reduction measures, fiscal, monetary, and financial market measures, and strong multilateral cooperation are required to overcome the effects of the pandemic.
Figure 1: Economic outlook projection in percentage change.png)
Source: IMF
A 5.8% growth in 2021 spells positivity in the world economy with many sectors, including the manufacturing sector, stand to gain from the positive outlook. Many countries are expected to implement fiscal policies and commence infrastructure-related projects that should boost the demand for Capital goods worldwide.
IMF further revealed that advanced economies are the worst struck economies with a -6.1% contraction in the economy in 2020 and to grow at 4.5% whereas emerging market economies are expected to rise exponentially with 6.6% recovery growth. Much of the action is anticipated in the emerging countries in 2021 with the demand for capital goods expected to stem from their economy boost.
Australia’s biggest trading partner is China, followed by the United States and Japan. In figure 2, we can see that China’s economy is expected to grow by 9.2%, indicating strong demand for exports and imports for goods and services between the two nations.
Figure 2: Economic outlook projection in percentage change.png)
Source: IMF
Australian Economy
The Australian economy is expected to record a contraction in GDP of around 10% over the first half of 2020. Beyond the first half of 2020, the outlook for the domestic economy depends on how effectively the Government and its citizens are jointly able to conquer the COVID-19 pandemic. On the brighter side, all the current indication points towards Australia being able to positively fight the pandemic, in fact, Australia has turned out to be a role model for the other world economies to copy.
Fig 3: Australian GDP Growth in percentage change.png)
Source:RBA
Measures to reduce unemployment should spike economy
The COVID containment measures have led to business closures resulting in increasing unemployment across the economy. According to Australian Bureau of Statistics (ABS), unemployment rate increased by 6.2% with monthly hours across jobs decreased by 163.9 million hours to 1,625.8 million hours for the Month of April 2020. Australian Treasury expects the unemployment rate to be around 10% or 1.4 million unemployed, in the June quarter.
Figure 4: Australia's unemployment rate by territory for April 2020 in percentage change.png)
Source: Labour Market Information Portal
Given that most of the restrictions are likely to be lifted by the end of the September quarter, the unemployment rate should reduce creating purchasing power leading to more consumption in the economy. Australian Prime minister pledged to open up the economy to provide 1 million jobs lost since mid-March. A three-step framework will be applied to open up restrictions. With restrictions opening, GDP growth is expected to start recovering in the second half of 2020, indicating a positive business outlook and creating opportunities for manufacturing or industrials sectors as well.
Now that we know about the World Economy and the Australian Economy, let us ponder on the demand dynamics in the Capital Goods market.
What Drives the Demand for Capital Goods?
Capital goods are heavily required in industries such as Manufacturing, Construction, Engineering or utilities, aerospace and defense, and mining. An uptick in the business of these industries will result in demand for capital goods in the economy.
The manufacturing Industry
The manufacturing sector of an economy is the primary driver for the demand for capital goods. According to Department of industry, the Australian manufacturing industry includes businesses engaged in the physical or chemical transformation of materials into new products and have contributed around $100 billion to Australian GDP annually as per 2018 Data. The pandemic has disrupted the manufacturing sector performance because of plant closures, reduction in the order book, and disturbed operations because of disrupted supply chain. The companies are operating in tough margins due to increased raw material prices and less sales.
- As per ABS, manufacturing industry income increased by 2% Q-o-Q with increased food product manufacturing in December quarter 2019.
- The increased production was driven by a 6.2% rise in Food, Beverage and Tobacco Product Manufacturing as manufacturers experienced ongoing international demand for Australian meat products and 4.0% rise in Machinery and Equipment Manufacturing.
- The Commonwealth Bank Flash Manufacturing PMI hit 45.6 in April 2020, down from 49.7 from March 2020, indicating contraction in the Australian manufacturing industry. The PMI is based on five indices for output, new orders, employment, suppliers’ delivery times and stocks of purchases.
The Construction Industry
The Construction industry is also experiencing shrinkage in work with total construction at $49,546.7 million, a decrease of 1.4% Q-o-Q and a decrease of 5.7% Y-o-Y. The decrease was because of lessened residential construction. Building approvals have increased by ~1% YOY in March 2020 with 15,234 dwelling units approved. However, the commencement of construction depends upon the duration of the containment measures imposed, stalling activities across the economy.
The Mining Industry
Australia’s resources and energy sector contributes heavily to Australia’s GDP with the mining sector accounting for 28% of Australia’s GDP growth in 2019. Mining projects comprise a number of different investment activities including exploration, engineering construction, plant and equipment and buildings.
The pandemic has created a labor shortage affecting the mining industry significantly. Various companies are experiencing decreased production, citing COVID-19 restrictions as a major disrupter. Low commodity pricing is also affecting their profit margins.
- In the first quarter of 2020, the pandemic has led to a decline in commodity prices of oil and base metals except gold which is set to make Australia a leading gold producer in 2021. A lot depends on China as it is the biggest exporter for Australia’s energy and resources sector. If China’s economy regains pace towards recovery in the second half of 2020, the price decrease may take a positive turn.
- Earnings of Australia’s iron ore export should exceed $100 billion in 2019-2020 because of higher prices and new production commencing at new mines in Western Australia.
According to Department of Industry, volume and price of Australia’s major resources or commodities are expected to go up post COVID-19 starts sliding.
Figure 5: Australia's Resources and energy exports in $ billion .png)
Source: Department of Industry
The Commercial and Defense industry
The commercial and defence industry was experiencing steady growth with many international contracts related to submarine and aircrafts falling under the Australian companies. In 2018-2019, the Department of Defense procurement contracts was $43,177.6 million, accounting for 67% of the total value of 2018-19 Procurement Contracts.
However, it also experienced the negative impacts of the Covid-19 Pandemic with many projects facing delays. Business operations are heavily interrupted due to shortage of raw materials, equipment and labour along with termination of contracts and changes in various joint venture or commercial contracts. The businesses are also forced to close their facilities with workers falling sick due to COVID-19.
Now, that we understand how the demand dynamics in the industry is anticipated, let’s look at the supply side scenario.
Current export-import situation
Despite the COVID-19 outbreak, exports of machinery, Transport Equipment, and other manufacturing goods remain relatively consistent.
.png)
Capital goods imports were down by 7% M-o-M in April 2020 to reach $ 5,781 million. According to ABS, within Capital Goods, Other transport equipment (including aircraft) and Telecommunications and sound equipment experienced a considerable decrease in import values offset by an increase of more than 40% in imports of Office and ADP machinery.
With economy anticipated to rise in 2021 and COVID-19 restrictions to gradually subside by the second half of 2020, the business outlook looks bullish for the year 2021
.
Sector Risks
Despite an expected recovery from first half of 2021 due to opening of the economy, the sector is not devoid of risks.
(a) A second wave of coronavirus attack may create an economic downhill all over again for economies at a point of recovering. Though Australia has flattened the COVID-19 growth curve, the nation may suffer a second wave of Coronavirus attack making Australia economically weaker and affecting businesses across all sectors. The nation’s major trading partners such as China and Japan may again fall prey to the virus, stalling economic activities and dampening export-import volumes of Australia.
(b) Prolonged Lockdowns may cause delay for businesses to open up their plants and facilities, leading to losses for businesses, persistent unemployment and economic despondency
(c) The US-china trade war puts Australia in a susceptible position as it is dependent on China for its economic stability and growth and yet maintains strategic relations with the US. With the pandemic ‘s origin being China and US suffering heavily because of the pandemic, the trade-war tension between the countries may escalate leading to a situation where Australia may need to compromise with its economic growth or strain its relations with its allies
(d) If relations with China turn sour, it may create a negative ripple effect on the economy already plagued with the negative impacts from pandemic. With China being the primary trade partner of Australia with strong bilateral export-import requirements, Australia stands to lose heavily with respect to its economic growth if relations go south.
Having understood the demand and supply conditions, let’s have a look at how the equity market participants are gauging the capital goods industrials.
Capital goods industry is a sub-segment of industrial sector and the performance of S&P/ASX 200 Industrials index* to an extent reflects the performance of the capital goods industry. As per ASX, S&P/ASX 200 Industrials index, when compared from Base 100, shows similar performance trend with the industrial indices faring slightly better. While the S&P/ASX 200 Industrials have given a negative 10.86% Net Total Return Index annual return as on May 26th, 2020, the S&P ASX 200 has given a negative 7.37 Net Total Return Index annual return as on May 26th, 2020.
Figure 8: One Year performance comparison chart(26).png)
The bushfires and COVID pandemic during the month of March had a deep impact on the performance of the capital goods stocks with prices plummeting record level on March 23rd. Since then, the stocks have shown resilience but are yet to catch up to reach the February 2020 levels.
With Pandemic restrictions gradually easing, a bounce in the industrial and capital goods market is anticipated, a contrarian approach to investing.
The S&P/ASX 200 Industrials Index (XNJ) includes companies whose businesses are dominated by one of the following activities: the manufacture and distribution of capital goods, including aerospace & defense, construction, engineering & building products, electrical equipment and industrial machinery; or, the provision of commercial services and supplies, including printing, employment, environmental and office services; or, the provision of transportation services, including airlines, couriers, marine, road & rail and transportation infrastructure.
II. Investment Theme and Stocks under Discussion (ASB, GWA, EHL and MND)
After gauging through the capital goods industry market dynamics, let’s take a detailed look at the companies operating in this sector, in terms of their performance and outlook. We have assessed the companies’ stocks based on Discounted Cash Flow (DCF) method.
1. ASX: GWA (GWA GROUP LIMITED)
(Recommendation: Buy, Potential Upside: Low Double Digit, Mcap: AUD 725.8 Million)
GWA Group Limited is engaged in supplying building fixtures and fittings to commercial & residential properties..png)
.png)
Valuation
Our illustrative valuation model suggests that stock has a potential upside of ~18% on 27 May 2020 closing price..png)
2. ASX: EHL (EMECO HOLDINGS LIMITED)
(Recommendation: Buy, Potential Upside: Low Double Digit, Mcap: AUD 349.4 Million)
Emeco Holdings Limited is engaged in the selling, leasing, and sustaining heavy earthmoving equipment for customers in the mining industry in Australia and overseas..png)
.png)
Valuation
Our illustrative valuation model suggests that stock has a potential upside of ~13% on 27 May 2020 closing price..png)
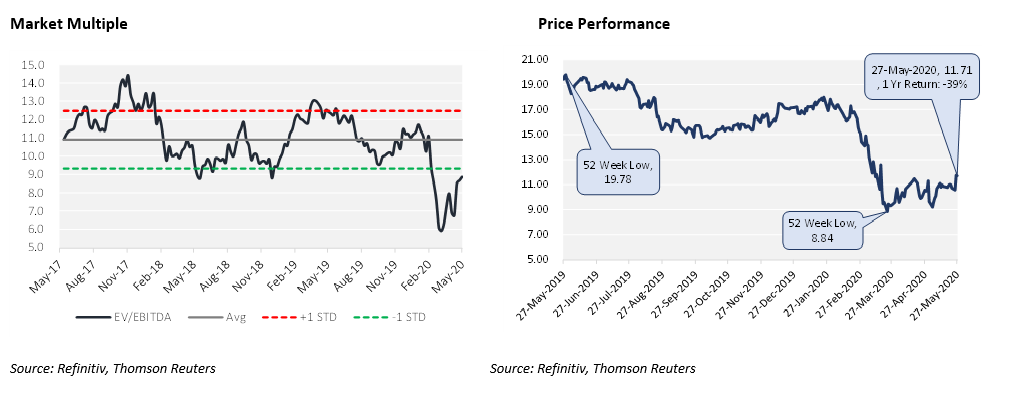
3. ASX: MND (MONADELPHOUS GROUP LIMITED)
(Recommendation: Buy, Potential Upside: Low Double Digit, Mcap: AUD 1.11 Billion)
Monadelphous Group Limited is involved in providing engineering services within Australia region.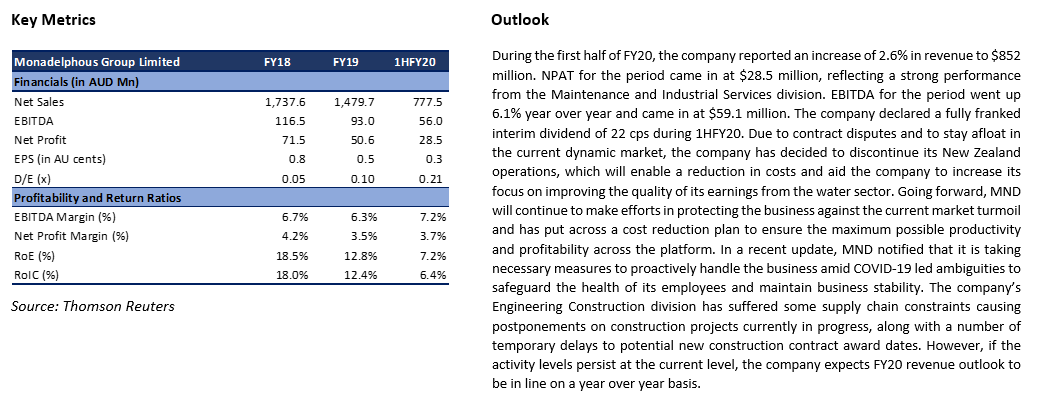
Valuation
Our illustrative valuation model suggests that stock has a potential upside of ~12% on 27 May 2020 closing price..png)
4. ASX: ASB (AUSTAL LIMITED)
(Trading Halt, Potential Upside: Low Double Digit, Mcap: AUD 1.06 Billion)
Austal Limited is engaged in the business of designing, manufacturing, and supporting high-performance vessels for commercial and defence customers. On 28 May 2020, the group has requested a trading halt in its shares. The group is making an announcement in relation to improved FY20 earnings guidance. The trading is expected to resume as normal on 29 May 2020..png)
.png)
Valuation
Our illustrative valuation model suggests that stock has a potential upside of ~19% on 27 May 2020 closing price..png)
Note: All the recommendations and the calculations are based on the closing price of 27 May 2020. The financial information has been retrieved from the respective company’s website and Thomson Reuters. All the recommendations are valid on 28 May 2020 price as well.
Disclaimer
The advice given by Kalkine Pty Ltd and provided on this website is general information only and it does not take into account your investment objectives, financial situation or needs. You should therefore consider whether the advice is appropriate to your investment objectives, financial situation and needs before acting upon it. You should seek advice from a financial adviser, stockbroker or other professional (including taxation and legal advice) as necessary before acting on any advice. Not all investments are appropriate for all people. Kalkine.com.au and associated pages are published by Kalkine Pty Ltd ABN 34 154 808 312 (Australian Financial Services License Number 425376). The information on this website has been prepared from a wide variety of sources, which Kalkine Pty Ltd, to the best of its knowledge and belief, considers accurate. You should make your own enquiries about any investments and we strongly suggest you seek advice before acting upon any recommendation. Kalkine Pty Ltd has made every effort to ensure the reliability of information contained in its newsletters and websites. All information represents our views at the date of publication and may change without notice. To the extent permitted by law, Kalkine Pty Ltd excludes all liability for any loss or damage arising from the use of this website and any information published (including any indirect or consequential loss, any data loss or data corruption). If the law prohibits this exclusion, Kalkine Pty Ltd hereby limits its liability, to the extent permitted by law to the resupply of services. There may be a product disclosure statement or other offer document for the securities and financial products we write about in Kalkine Reports. You should obtain a copy of the product disclosure statement or offer document before making any decision about whether to acquire the security or product. The link to our Terms & Conditions has been provided please go through them and also have a read of the Financial Services Guide. On the date of publishing this report (mentioned on the website), employees and/or associates of Kalkine Pty Ltd do not hold positions in any of the stocks covered on the website. These stocks can change any time and readers of the reports should not consider these stocks as personalised advice.
 Please wait processing your request...