Kalkine has a fully transformed New Avatar.
Section 1: Company Overview and Fundamentals
1.1 Company Overview:
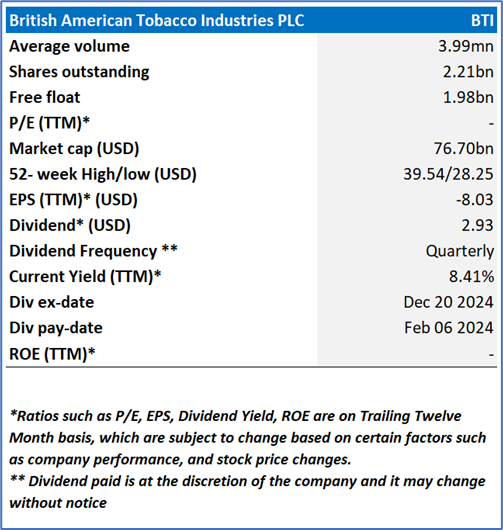
British American Tobacco p.l.c. (NYSE: BTI) is a consumer-centric, multi-category consumer goods company. The Company provides tobacco and nicotine products. Its segments include the United States, Asia Pacific Middle East and Africa, Americas and Europe. The Company’s product categories include Vapor, Tobacco Heating Products (THPs), Modern Oral, Traditional Oral and Combustible cigarettes.
Kalkine’s Dividend Income Report covers the Company Overview, Key positives & negatives, Investment summary, Key investment metrics, Top 10 shareholding, Business updates and insights into company recent financial results, Key Risks & Outlook, Price performance and technical summary, Target Price, and Recommendation on the stock.
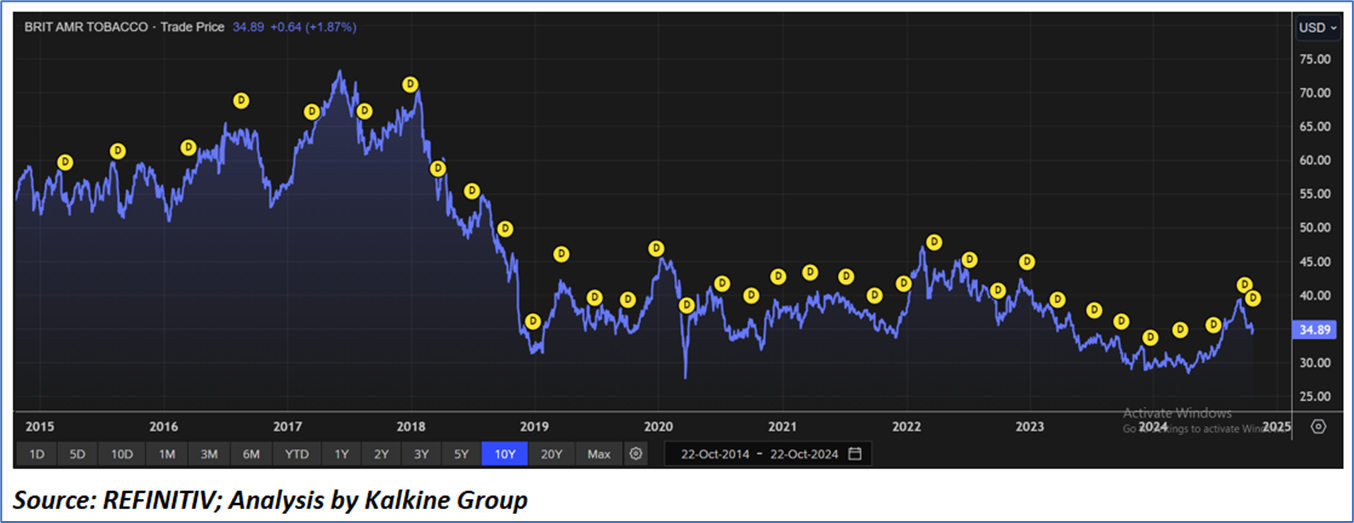
Price Performance:
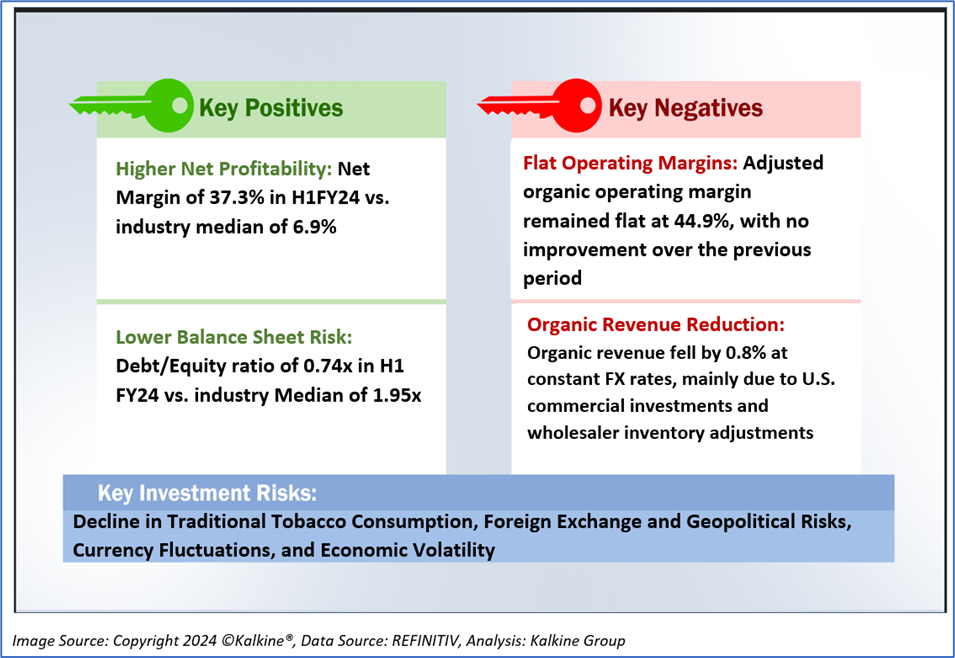
1.2 The Key Positives, Negatives, and Investment summary
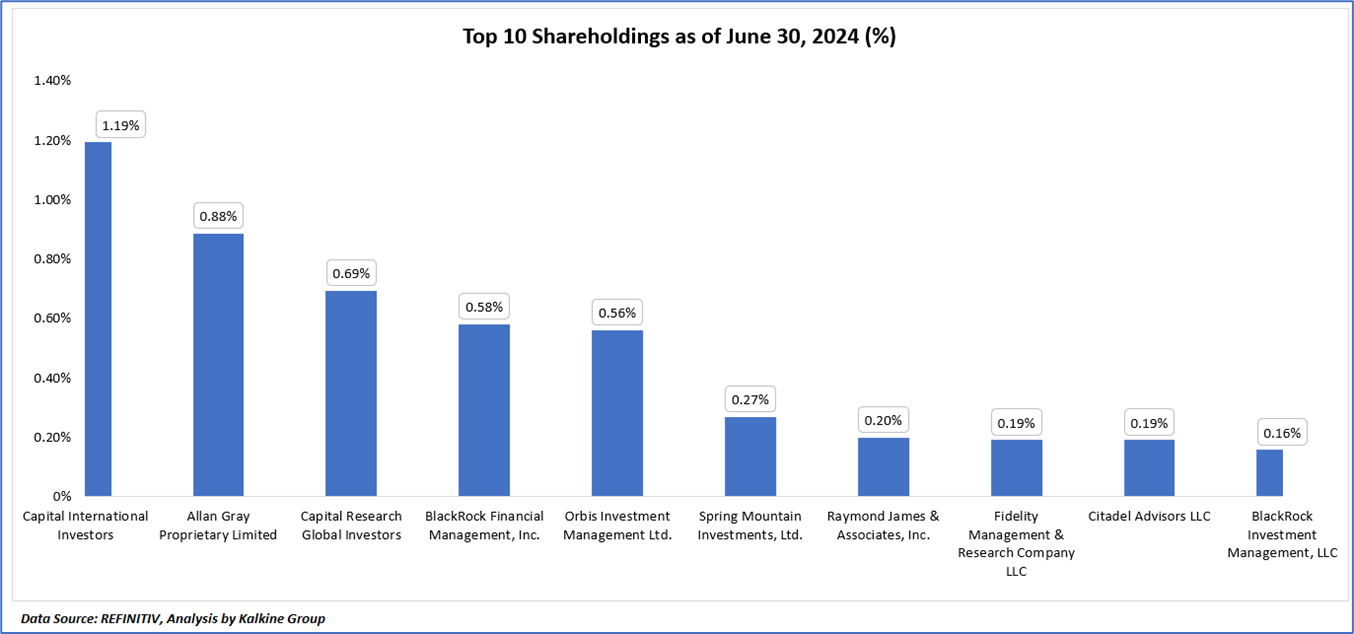
1.3 Top 10 shareholders:
The top 10 shareholders together form ~4.91% of the total shareholding, signifying diverse shareholding. Capital International Investors and Allan Gray Proprietary Limited are the biggest shareholders, holding the maximum stake in the company at ~1.19% and ~0.88%, respectively.
1.4 Dividend payments with impressive dividend yield:
British American Tobacco p.l.c. has announced its quarterly dividends for the fiscal year ending 31 December 2023, declaring an interim dividend of 235.52p per ordinary share, payable in four equal instalments of 58.88p each in May 2024, August 2024, November 2024, and February 2025. The third payment, known as the "November 2024 Dividend," will be issued on 1 November 2024, with shareholders required to be registered on the UK main register or the South Africa branch register by the record date of 27 September 2024. This announcement underscores the Company's commitment to delivering shareholder value through a consistent dividend policy, reflecting its strong financial performance and focus on sustainable growth.
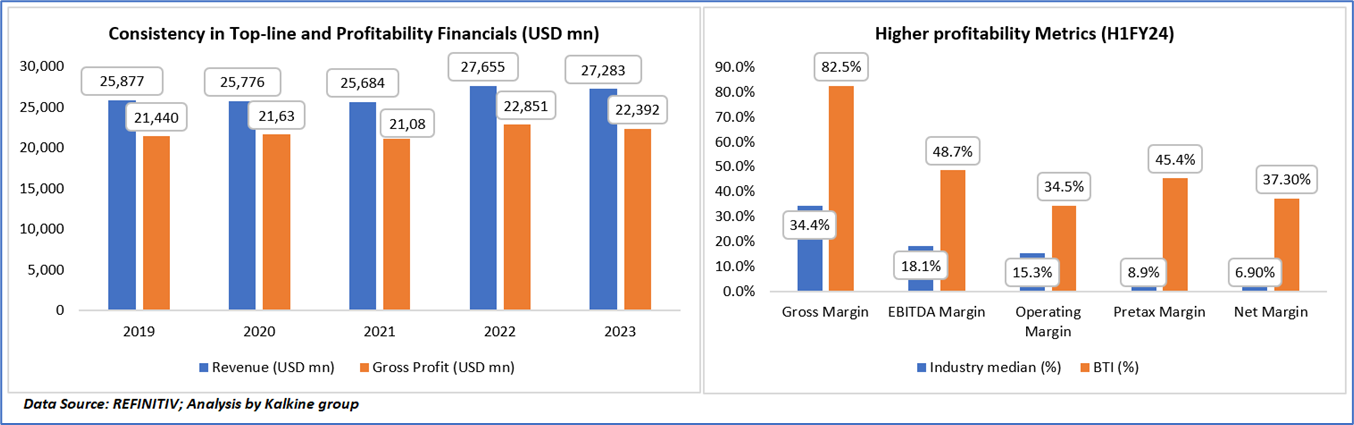
1.5 Key Metrics:
Between 2019 and 2023, BTI's revenue exhibited slight fluctuations, starting at USD 25,877 million in 2019, decreasing to USD 25,684 million in 2021, and then rising to USD 27,655 million in 2022 before settling at USD 27,283 million in 2023. Gross profit followed a similar trend, initially at USD 21,440 million in 2019, peaking at USD 22,851 million in 2022, and ultimately reaching USD 22,392 million in 2023. In terms of profitability margins, BTI's gross margin was significantly higher at 82.5% in H1 FY24 compared to the industry median of 34.4%. Furthermore, BTI demonstrated superior performance across other profitability metrics, with an EBITDA margin of 48.7% compared to the industry median of 18.1%, an operating margin of 34.5% versus 15.3%, a pretax margin of 45.4% in contrast to 8.9%, and a net margin of 37.3% as opposed to the industry median of 6.9%.
Section 2: Business Updates and Financial Highlights
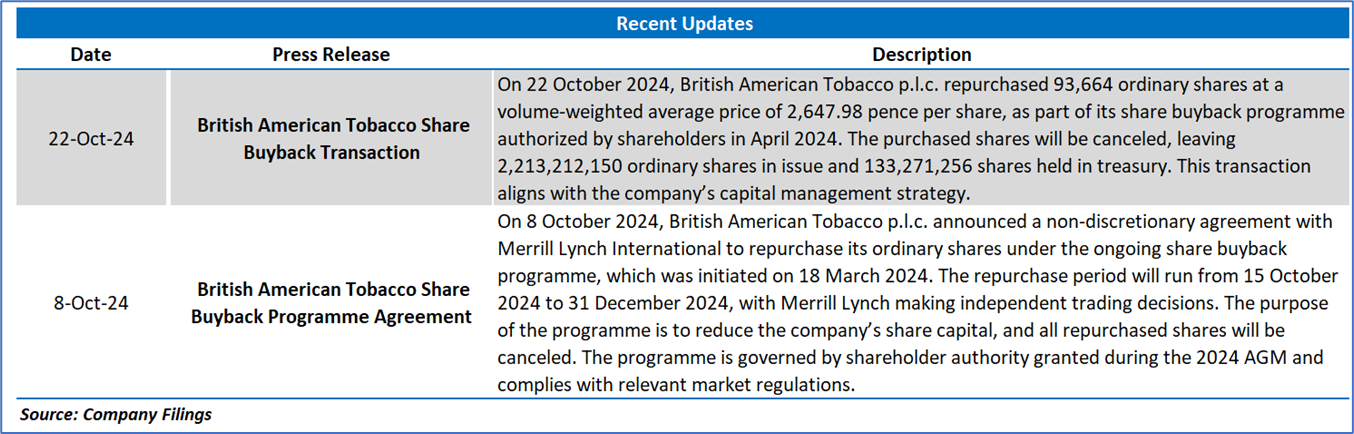
2.1 Recent Updates:
The below picture gives an overview of the recent updates:
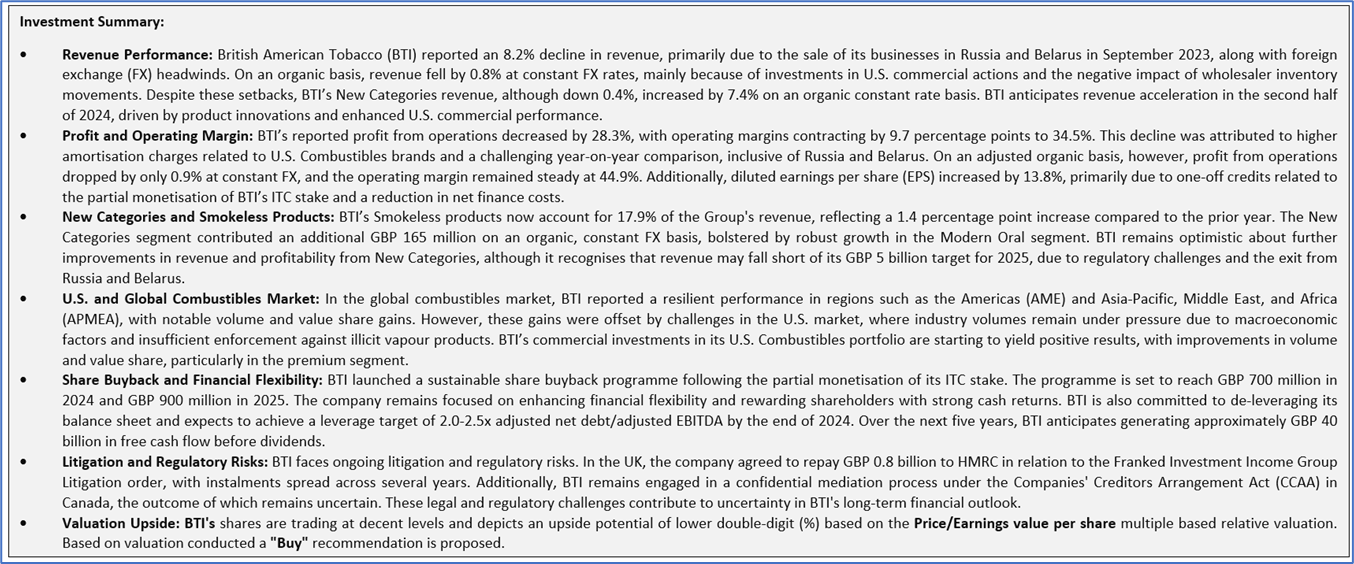
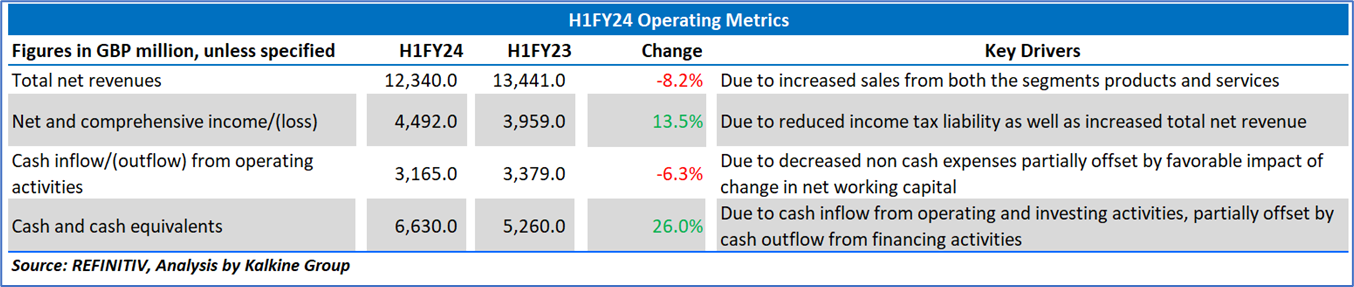
2.2 Insights of H1FY24:
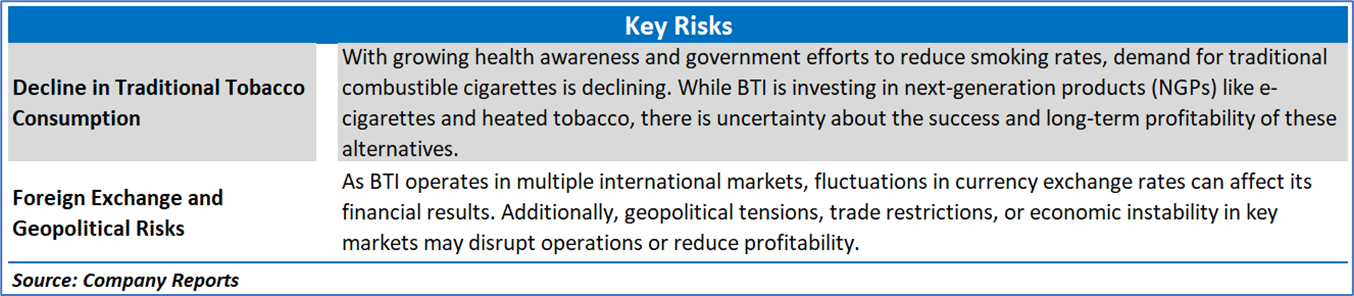
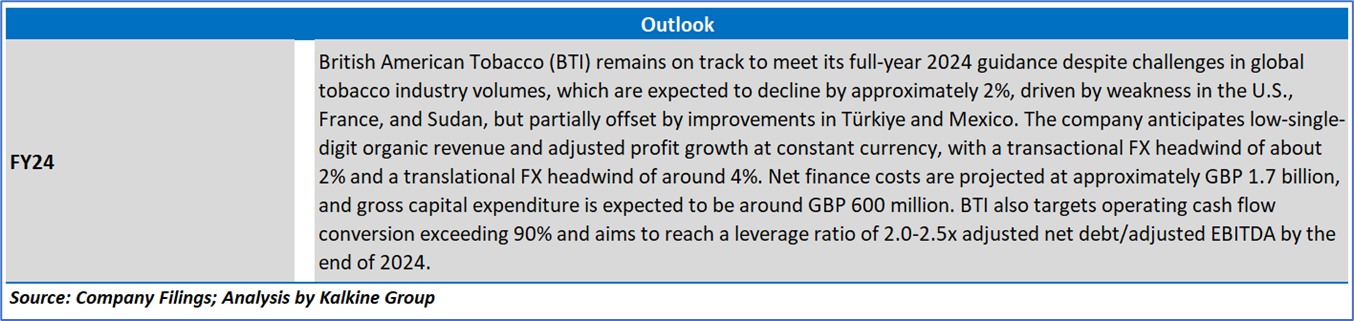
Section 3: Key Risks and Outlook:
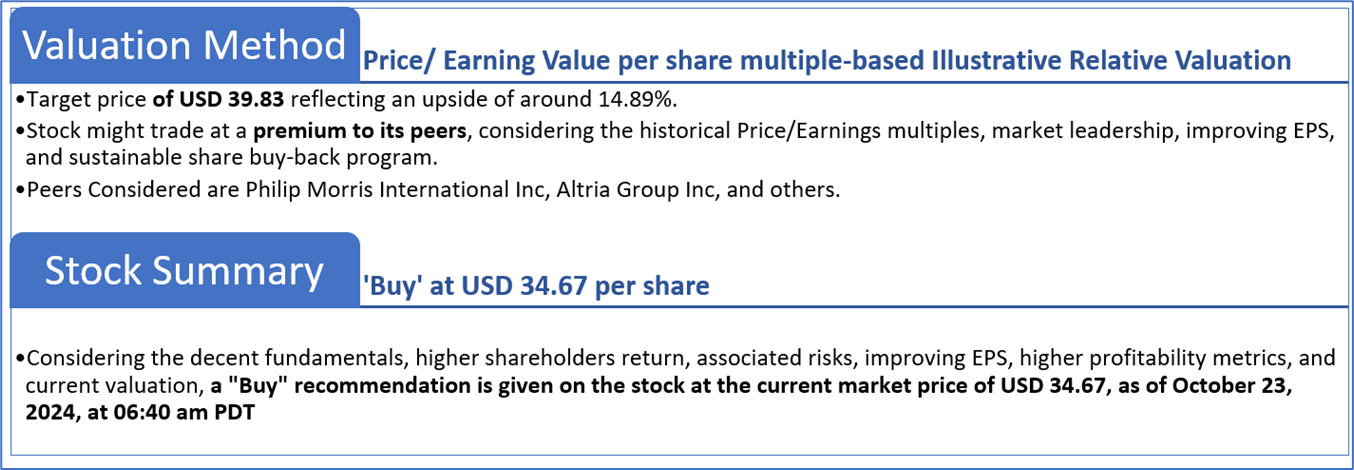
Section 4: Stock Recommendation Summary:
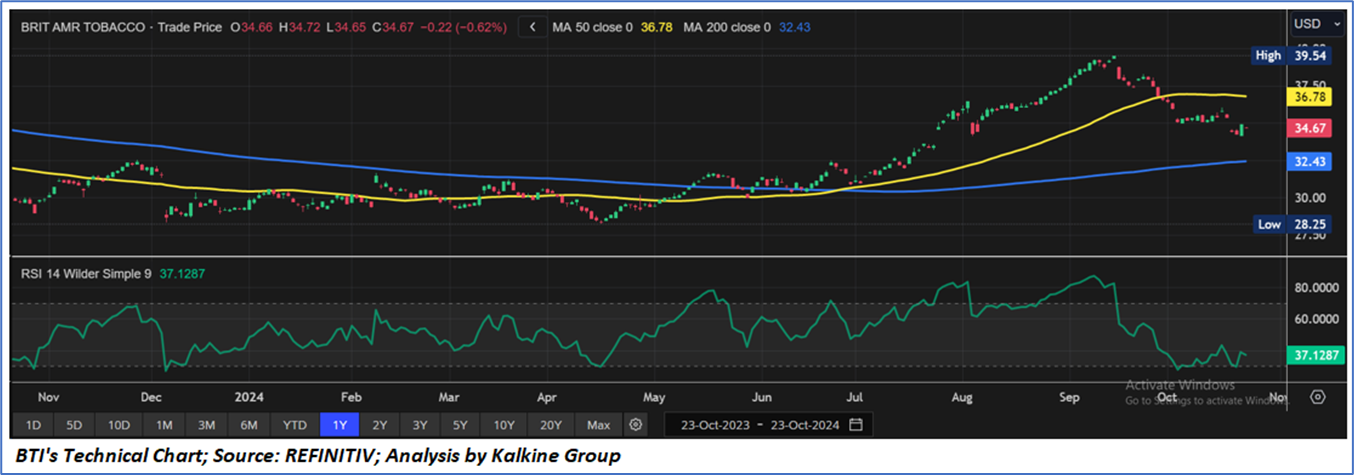
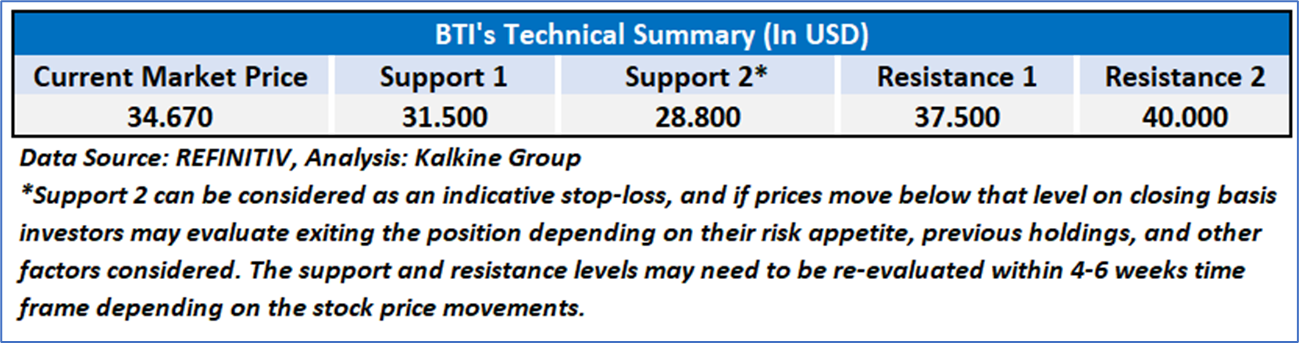
4.1 Technical Summary:
Price Performance:
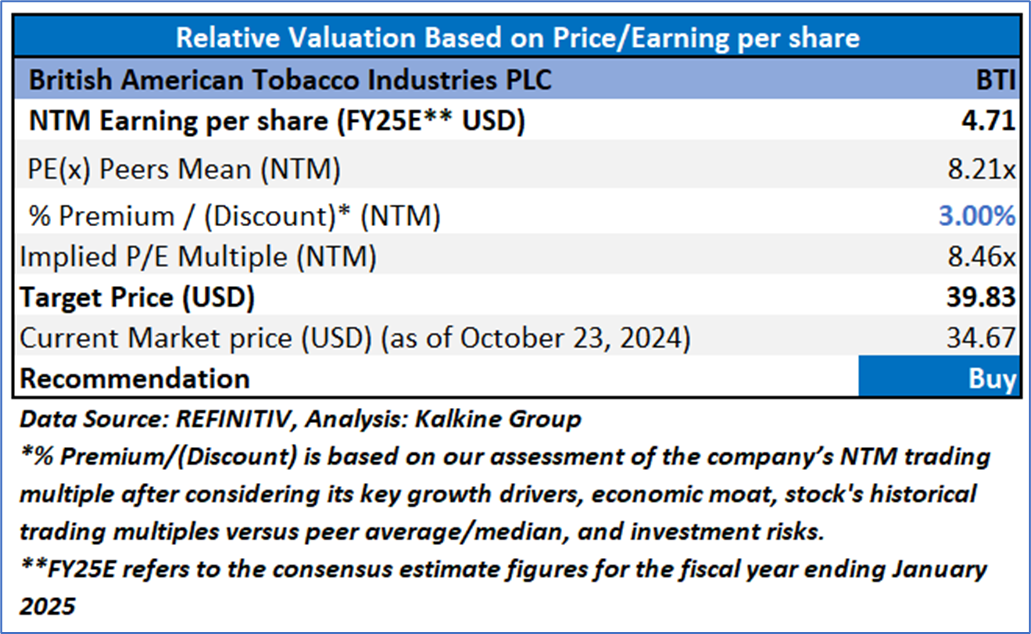
4.2 Fundamental Valuation
Valuation Methodology: Price/Earnings Per Share Multiple Based Relative Valuation
Markets are trading in a highly volatile zone currently due to certain macroeconomic issues and geopolitical tensions prevailing. Therefore, it is prudent to follow a cautious approach while investing.
Note 1: Past performance is not a reliable indicator of future performance.
Note 2: The reference date for all price data, currency, technical indicators, support, and resistance levels is October 23, 2024. The reference data in this report has been partly sourced from REFINITIV.
Note 3: Investment decisions should be made depending on an individual's appetite for upside potential, risks, holding duration, and any previous holdings. An 'Exit' from the stock can be considered if the Target Price mentioned as per the Valuation and or the technical levels provided has been achieved and is subject to the factors discussed above.
Note 4: The report publishing date is as per the Pacific Time Zone.
Technical Indicators Defined: -
Support: A level at which the stock prices tend to find support if they are falling, and a downtrend may take a pause backed by demand or buying interest. Support 1 refers to the nearby support level for the stock and if the price breaches the level, then Support 2 may act as the crucial support level for the stock.
Resistance: A level at which the stock prices tend to find resistance when they are rising, and an uptrend may take a pause due to profit booking or selling interest. Resistance 1 refers to the nearby resistance level for the stock and if the price surpasses the level, then Resistance 2 may act as the crucial resistance level for the stock.
Stop-loss: It is a level to protect against further losses in case of unfavorable movement in the stock prices.
This report has been issued by Kalkine Pty Limited (ABN 34 154 808 312) (Australian financial services licence number 425376) (“Kalkine”) and prepared by Kalkine and its related bodies corporate authorised to provide general financial product advice. Kalkine.com.au and associated pages are published by Kalkine.
Any advice provided in this report is general advice only and does not take into account your objectives, financial situation or needs. You should therefore consider whether the advice is appropriate to your objectives, financial situation and needs before acting upon it.
There may be a Product Disclosure Statement, Information Statement or other offer document for the securities or other financial products referred to in Kalkine reports. You should obtain a copy of the relevant Product Disclosure Statement, Information Statement or offer document and consider the statement or document before making any decision about whether to acquire the security or product.
Choosing an investment is an important decision. If you do not feel confident making a decision based on the recommendations Kalkine has made in our reports, you should consider seeking advice from a financial adviser, stockbroker or other professional (including taxation and legal advice) before acting on any advice in this report or on the Kalkine website. Not all investments are appropriate for all people.
The information in this report and on the Kalkine website has been prepared from a wide variety of sources, which Kalkine, to the best of its knowledge and belief, considers accurate. Kalkine has made every effort to ensure the reliability of information contained in its reports, newsletters and websites. All information represents our views at the date of publication and may change without notice. The information in this report does not constitute an offer to sell securities or other financial products or a solicitation of an offer to buy securities or other financial products. Our reports contain general recommendations to invest in securities and other financial products.
Kalkine is not responsible for, and does not guarantee, the performance of the investments mentioned in this report This report may contain information on past performance of particular investments. Past performance is not an indicator of future performance. Hypothetical returns may not reflect actual performance. Any displays of potential investment opportunities are for sample purposes only and may not actually be available to investors. To the extent permitted by law, Kalkine excludes all liability for any loss or damage arising from the use of this report, the Kalkine website and any information published on the Kalkine website (including any indirect or consequential loss, any data loss or data corruption). If the law prohibits this exclusion, Kalkine hereby limits its liability, to the extent permitted by law, to the resupply of services..
Please also read our Terms & Conditions and Financial Services Guide for further information. Employees and/or associates of Kalkine and its related entities may hold interests in the securities or other financial products covered in this report or on the Kalkine website. Any such employees and associates are required to comply with certain safeguards, procedures and disclosures as required by law.
Kalkine Media Pty Ltd, an affiliate of Kalkine Pty Ltd, may have received, or be entitled to receive, financial consideration in connection with providing information about certain entity(s) covered on its website including entities covered in this Report.
 Please wait processing your request...